Capillary Rheometry and Thermal History Characterization for Recycled Polypropylene Batch Acceptance Thresholds
Capillary rheometry and DSC thermal analysis establish high-shear viscosity and stabilizer limits to qualify recycled polypropylene lots before processing.


Melt
Standard single-point testing fails to capture the complex fluid dynamics of post-consumer polyolefins under high processing pressure. Melt flow rate indexing, defined by ISO 1133 and ASTM D1238 at 230 °C under a 2.16 kg load, measures material flow under negligible shear stress, typically between 1 and 10 s-1. Injection molding equipment subjects molten resin to shear rates ranging from 1,000 to 10,000 s-1, while profile extrusion operates between 100 and 1,000 s-1.
Non-Newtonian polymer fluids exhibit strong shear thinning behavior where viscosity drops by orders of magnitude as shear rate increases. Two incoming recycled polypropylene lots displaying identical melt flow values of 25 g/10 min often behave entirely differently inside a high-speed injection mold.

Limitations of Low-Shear Indexing
Capillary rheometry measures fluid response across deformation conditions that mirror actual conversion equipment. Polypropylene reprocessed through multiple heat cycles experiences distinct molecular structural changes. Standard melt flow rate tests reflect average molecular weight but remain insensitive to shifts in molecular weight distribution.
Low shear numbers mask internal scission. Polymer chains broken down by thermal and mechanical forces during prior extrusion cycles yield altered high-shear viscosity profiles while maintaining an acceptable low-shear index.
Thermal history alters the balance between viscous flow and elastic recovery. When processing recycled homopolymers or impact copolymers, melt strength drops rapidly as chain length decreases. Capillary rheometers force molten polymer through a precision die at controlled piston speeds, recording wall shear stress across a sweeping range of apparent shear rates.
This multi-point characterization uncovers processing anomalies that simple melt indexers miss entirely.
At a shear rate of 1,000 s-1 and a temperature of 210 °C, recycled polypropylene with a melt flow rate of 25 g/10 min exhibits an apparent viscosity reduction of 34 percent compared to virgin homopolymer of identical nominal flow rate.
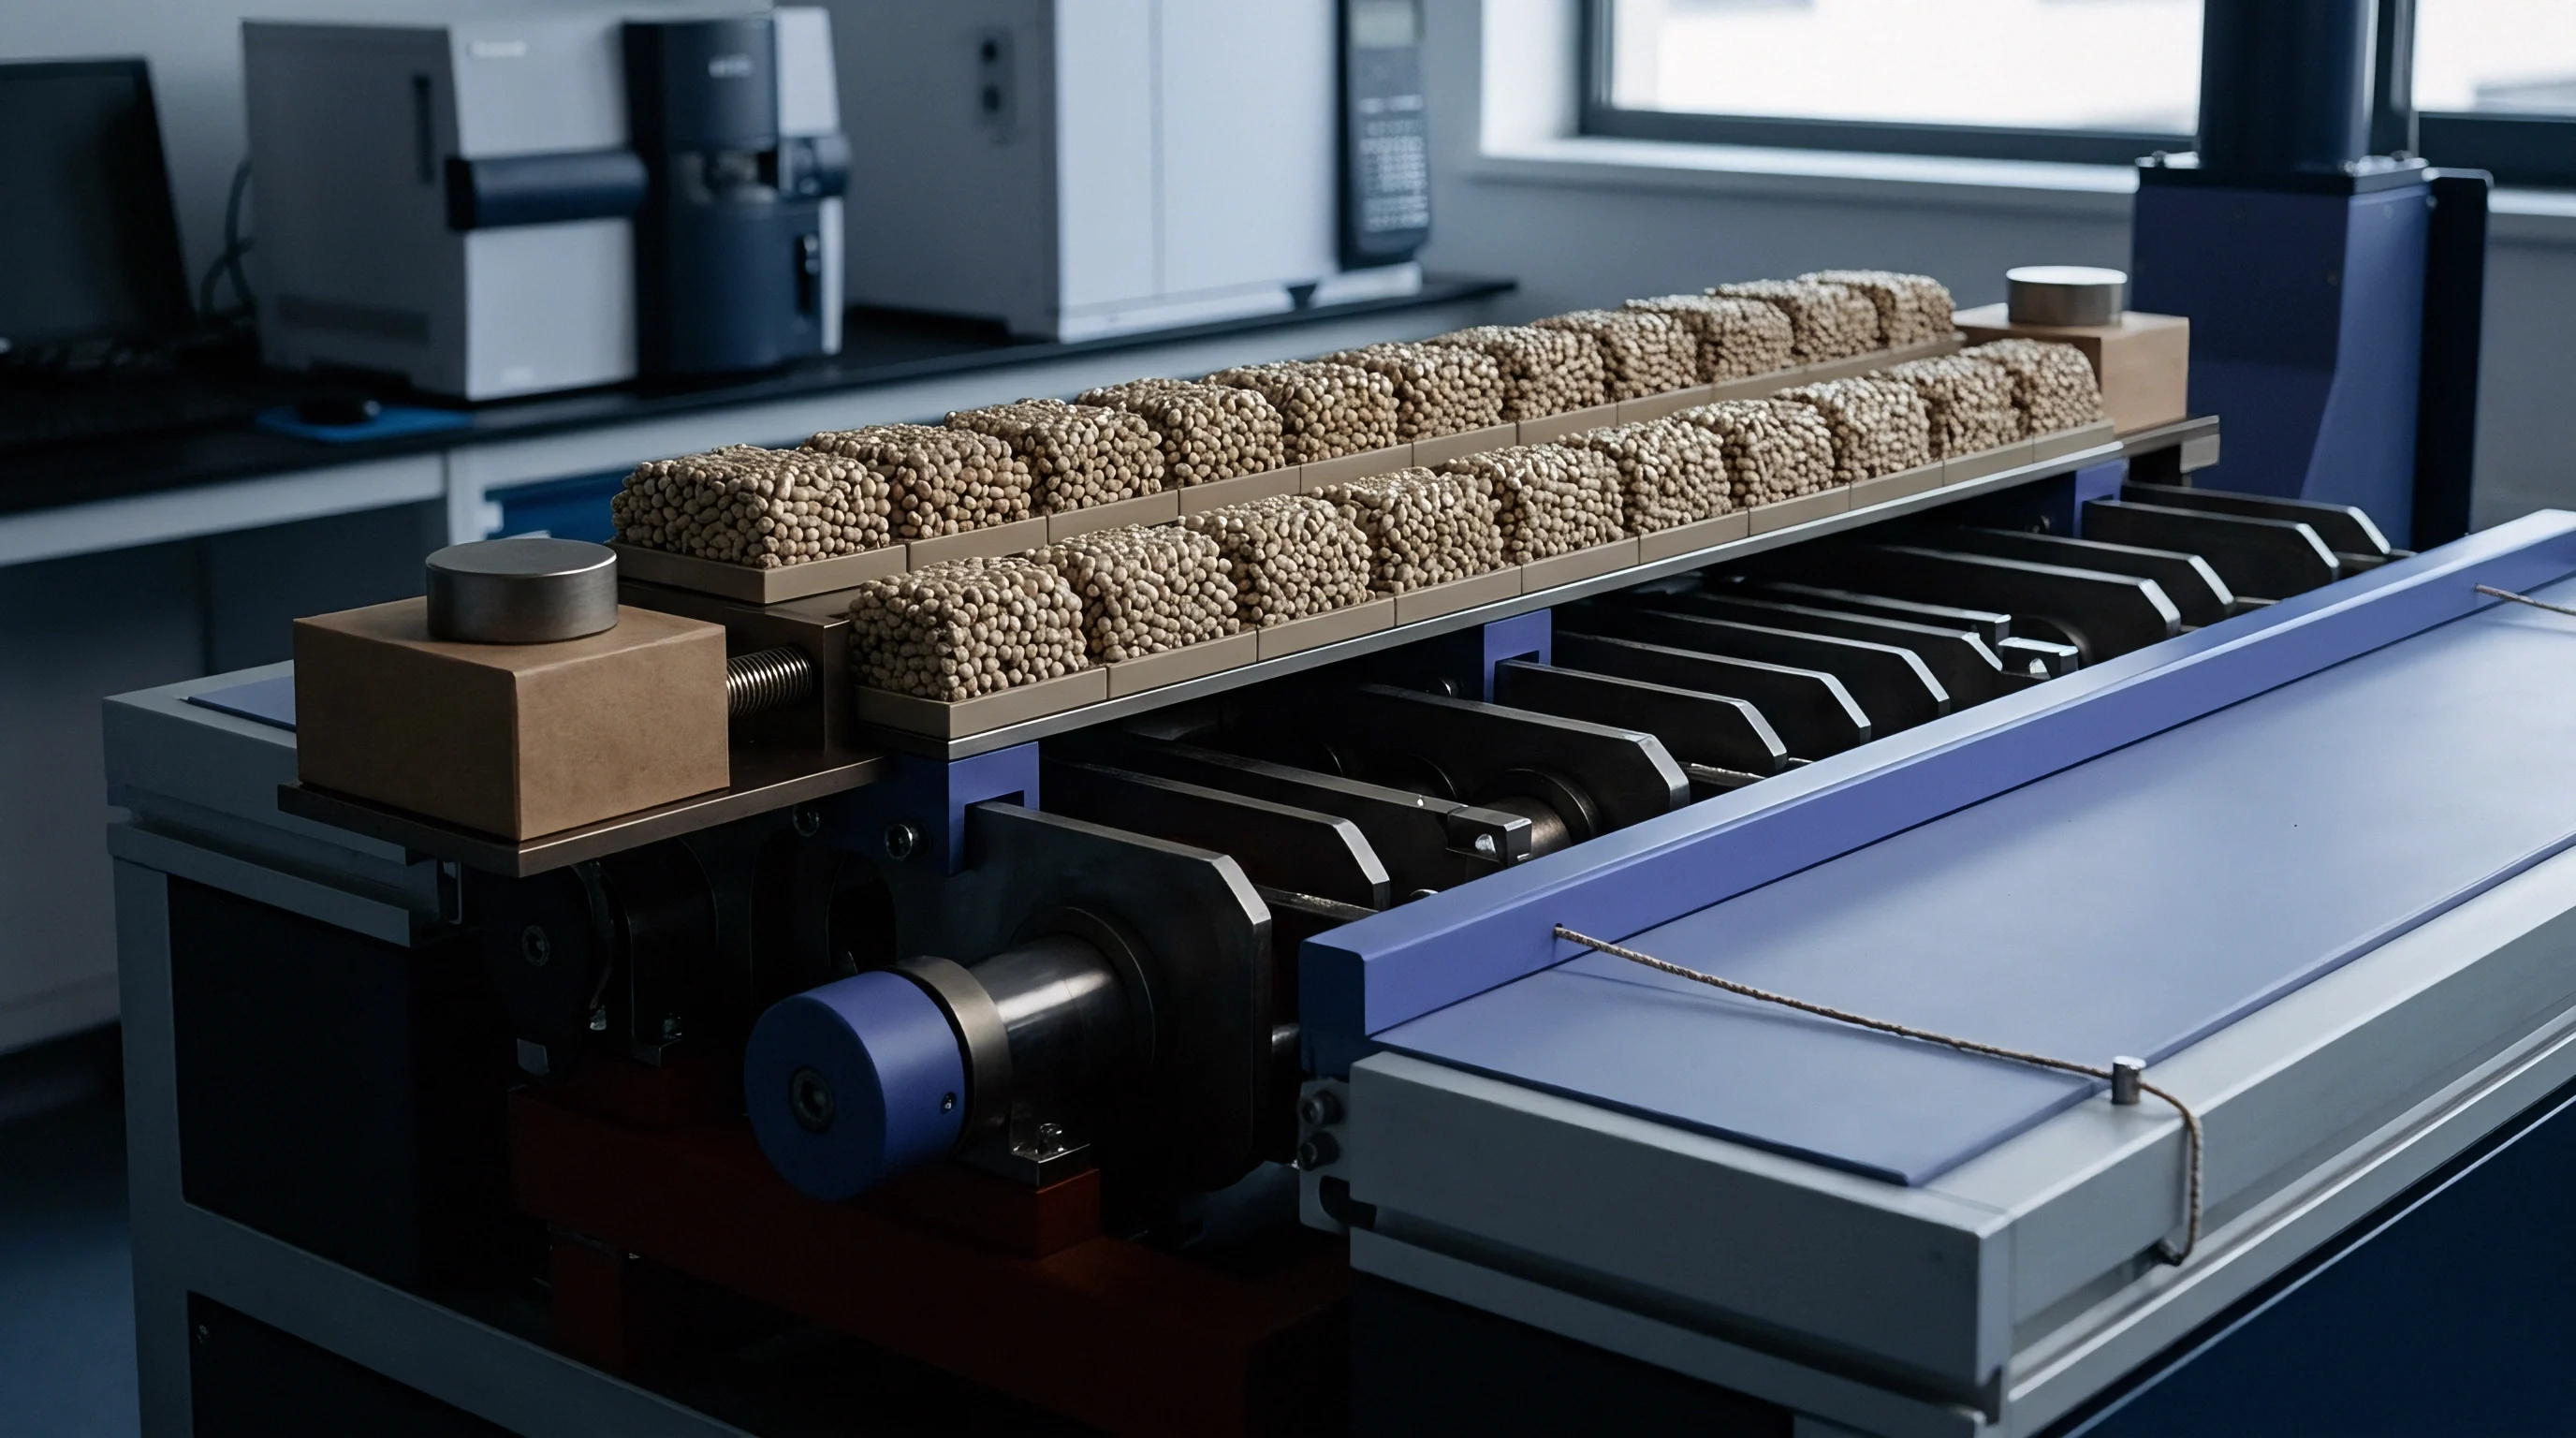
Polymer Scission and Rheological Dynamics
Repeated thermal exposure during reprocessing cleaves long polymer chains into shorter fragments. This beta-scission mechanism occurs predominantly at tertiary carbon sites along the polypropylene backbone when heat and mechanical shear exceed thermal stability thresholds. Chain cleavage narrows molecular weight distributions.
As the molecular weight distribution narrows, the shear-thinning slope flattens, requiring higher extrusion pressures to achieve identical volumetric flow rates through cold runners or complex die geometries.
Degradation alters the flow activation energy of recycled lots. Measuring viscosity across multiple temperatures, such as 190 °C, 210 °C, and 230 °C, allows calculation of activation energy via Arrhenius relationships. Higher activation energy indicates increased sensitivity to barrel temperature variations, leading to process instability during molding cycles.
Evaluating high-shear viscosity profiles provides incoming inspection teams with actionable metrics to screen out unstable raw material batches.
- Thermal Beta-Scission generates low molecular weight species, reducing high-shear viscosity and lowering melt strength during blown film or profile extrusion.
- Cross-Linking Reactions occur in trace polyethylene contaminants, creating micro-gel networks that cause high-shear viscosity spikes and surface defects.
- Stabilizer Depletion accelerates thermal degradation inside the rheometer barrel, resulting in progressive viscosity loss during extended test dwell times.
- Filler Agglomeration increases wall friction within capillary dies, causing uncorrected shear stress values to falsely indicate high polymer molecular weight.
Ignoring non-Newtonian viscosity shifts across varying strain rates causes unexpected mold flash, short shots, and costly tool recalibration during high-speed production runs.
Enthalpy
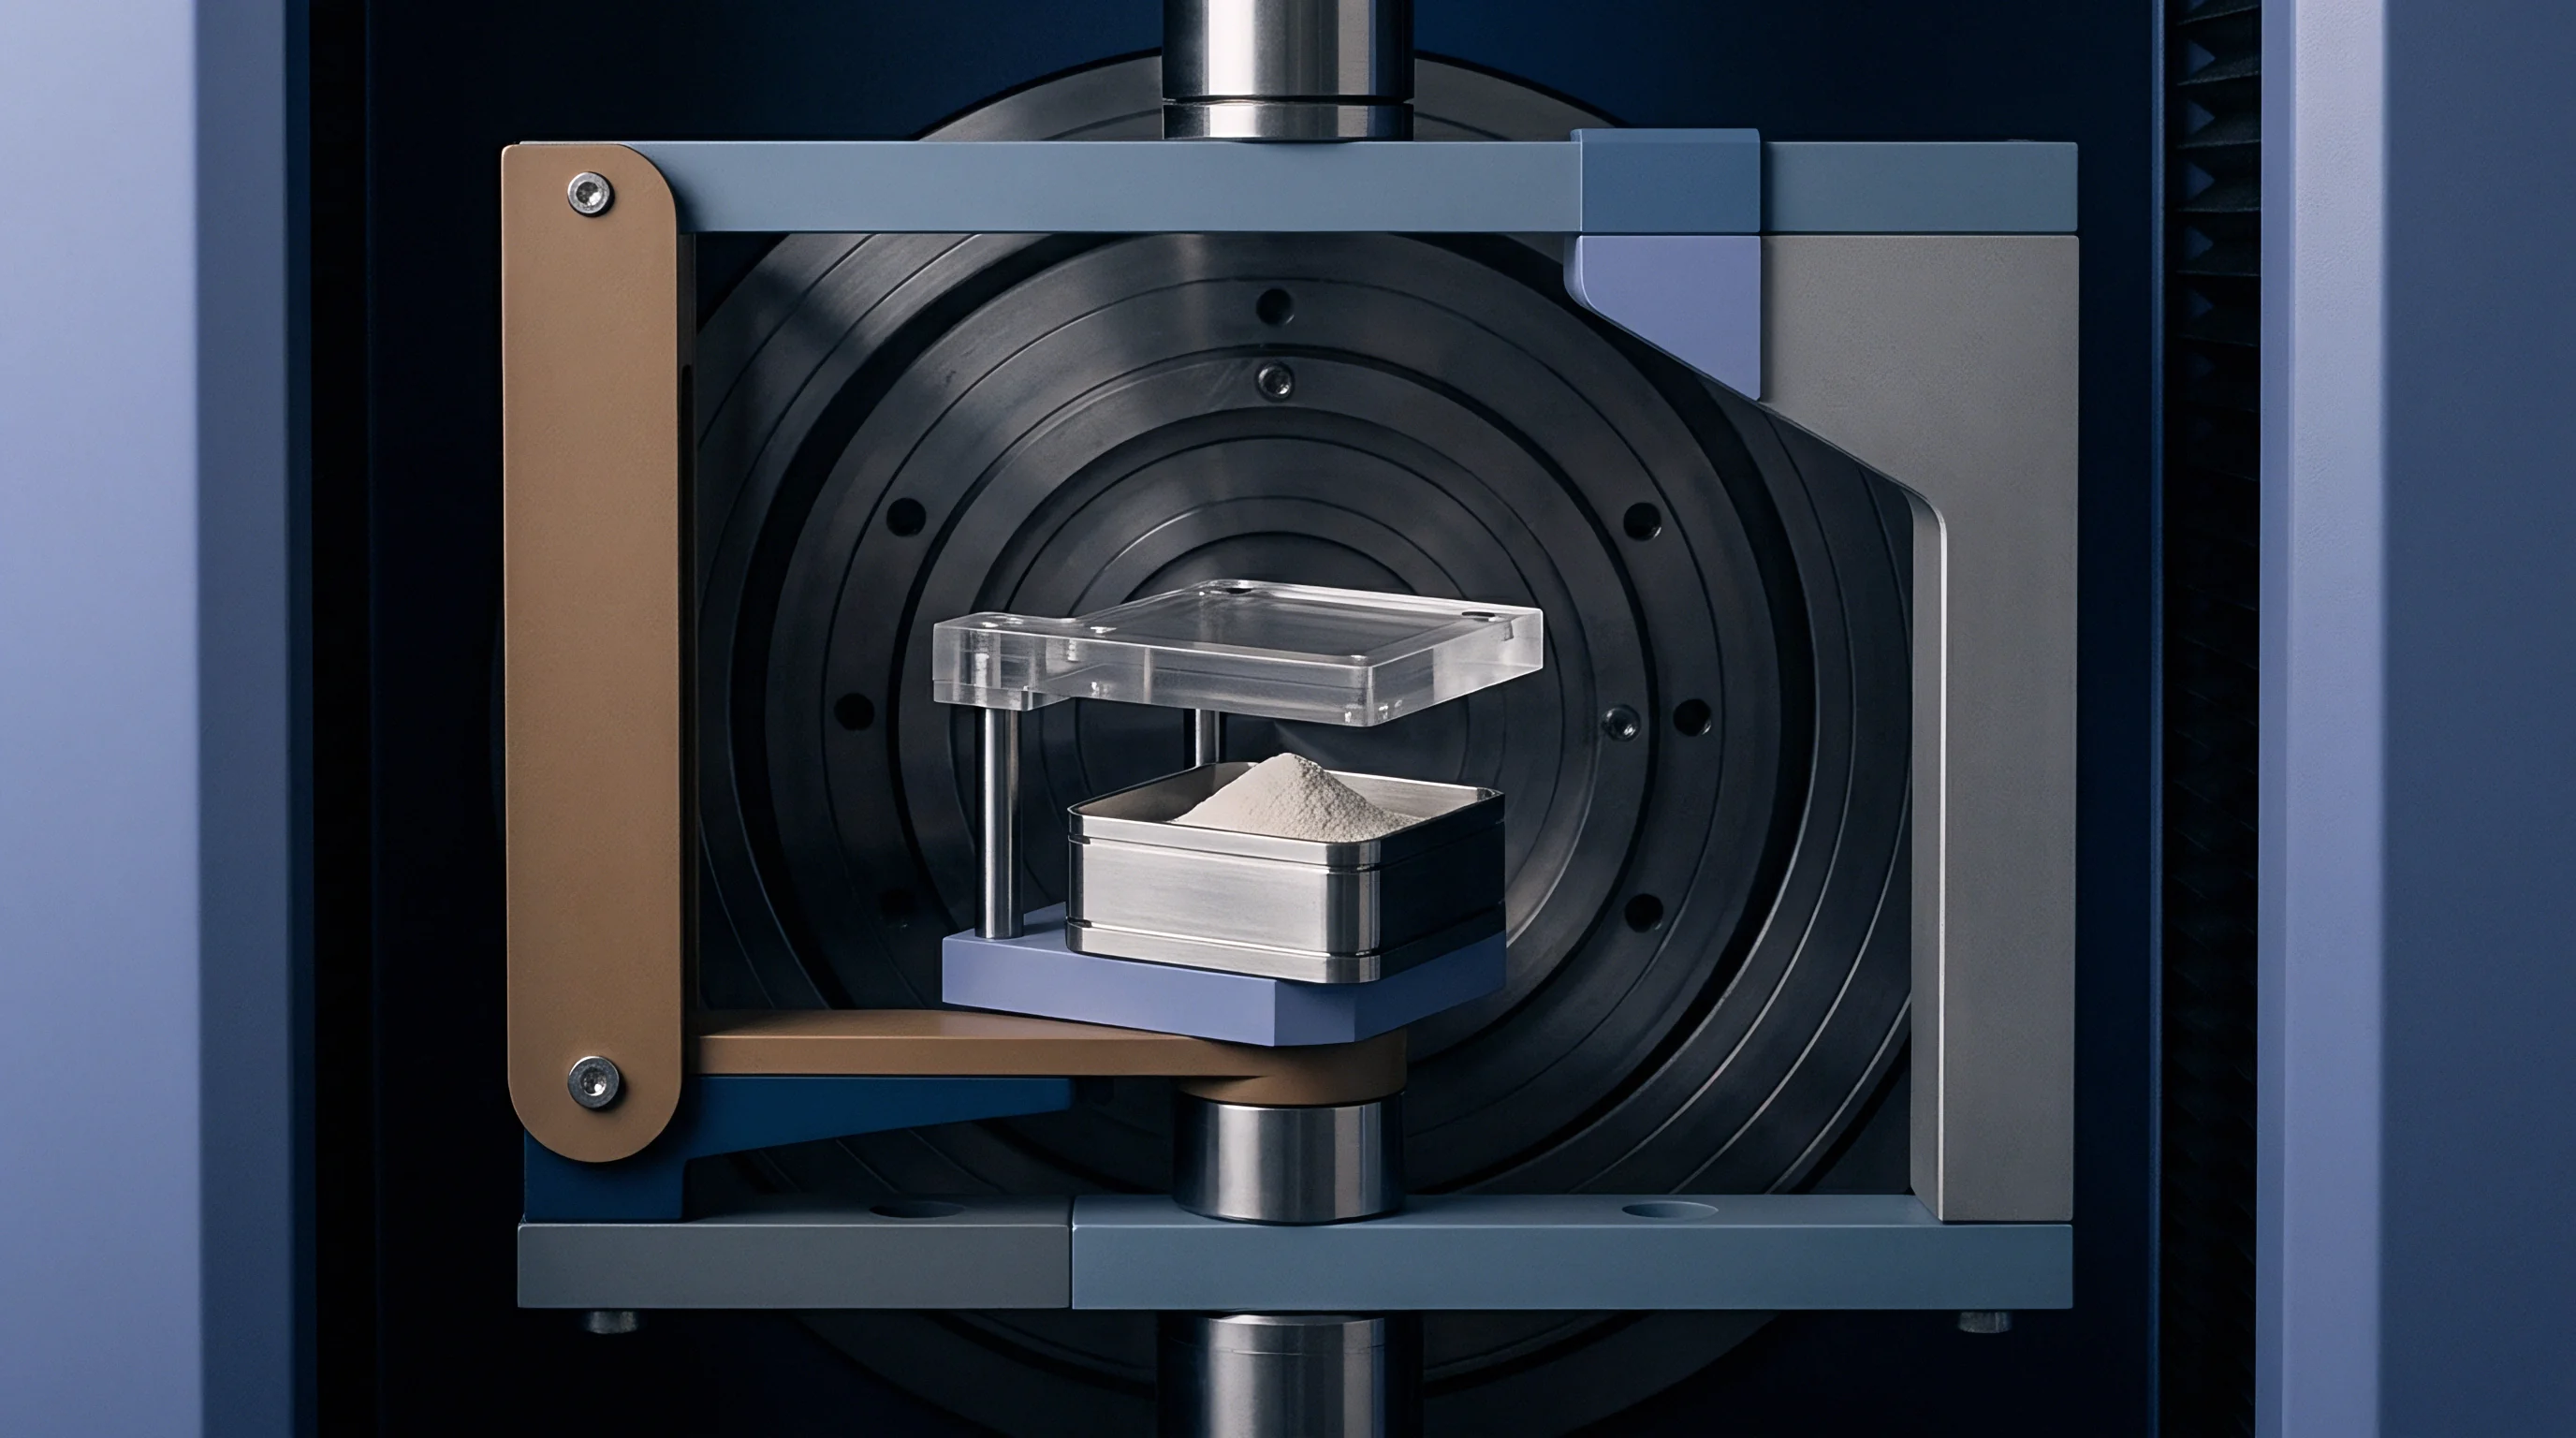
Differential scanning calorimetry isolates thermal transitions that reveal previous heat exposure and phase structure. Standard testing following ISO 11357-3 applies double heating cycles from 30 °C to 200 °C at controlled heating rates of 10 °C/min under nitrogen purge. The first heat scan records the thermal history imprinted on the polymer matrix during previous processing, storage, and aging.
The second heat scan removes thermo-mechanical memory, establishing the intrinsic melting temperature, crystallization behavior, and phase composition of the recycled resin.

Thermal Characterization and Degradation Identifiers
Calorimetric scans plot heat flow against temperature to identify key phase changes within the polymer matrix. Virgin isotactic polypropylene homopolymer demonstrates a sharp endothermic melting peak between 162 °C and 168 °C. Recycled streams derived from post-consumer packaging frequently display secondary melting peaks corresponding to commingled polymer impurities. High-density polyethylene appears as a distinct endothermic peak between 125 °C and 132 °C, while linear low-density polyethylene produces melting shoulders between 118 °C and 124 °C.
Cross-contamination shifts crystallite formation. The area under the melting curve represents the enthalpy of fusion, measured in Joules per gram. Normalizing this value against theoretical 100 percent crystalline polypropylene, established at 207 J/g, yields the percentage of matrix crystallinity.
Recycled lots with high crystallinity exhibit increased stiffness and lower impact strength, whereas lots containing un-melted rubber phases or high copolymer ratios show reduced total heat of fusion.
Compliance with ISO 11357-6 oxidation induction time testing above 15 minutes at 200 °C under oxygen flow prevents catastrophic auto-oxidation during secondary profile extrusion.
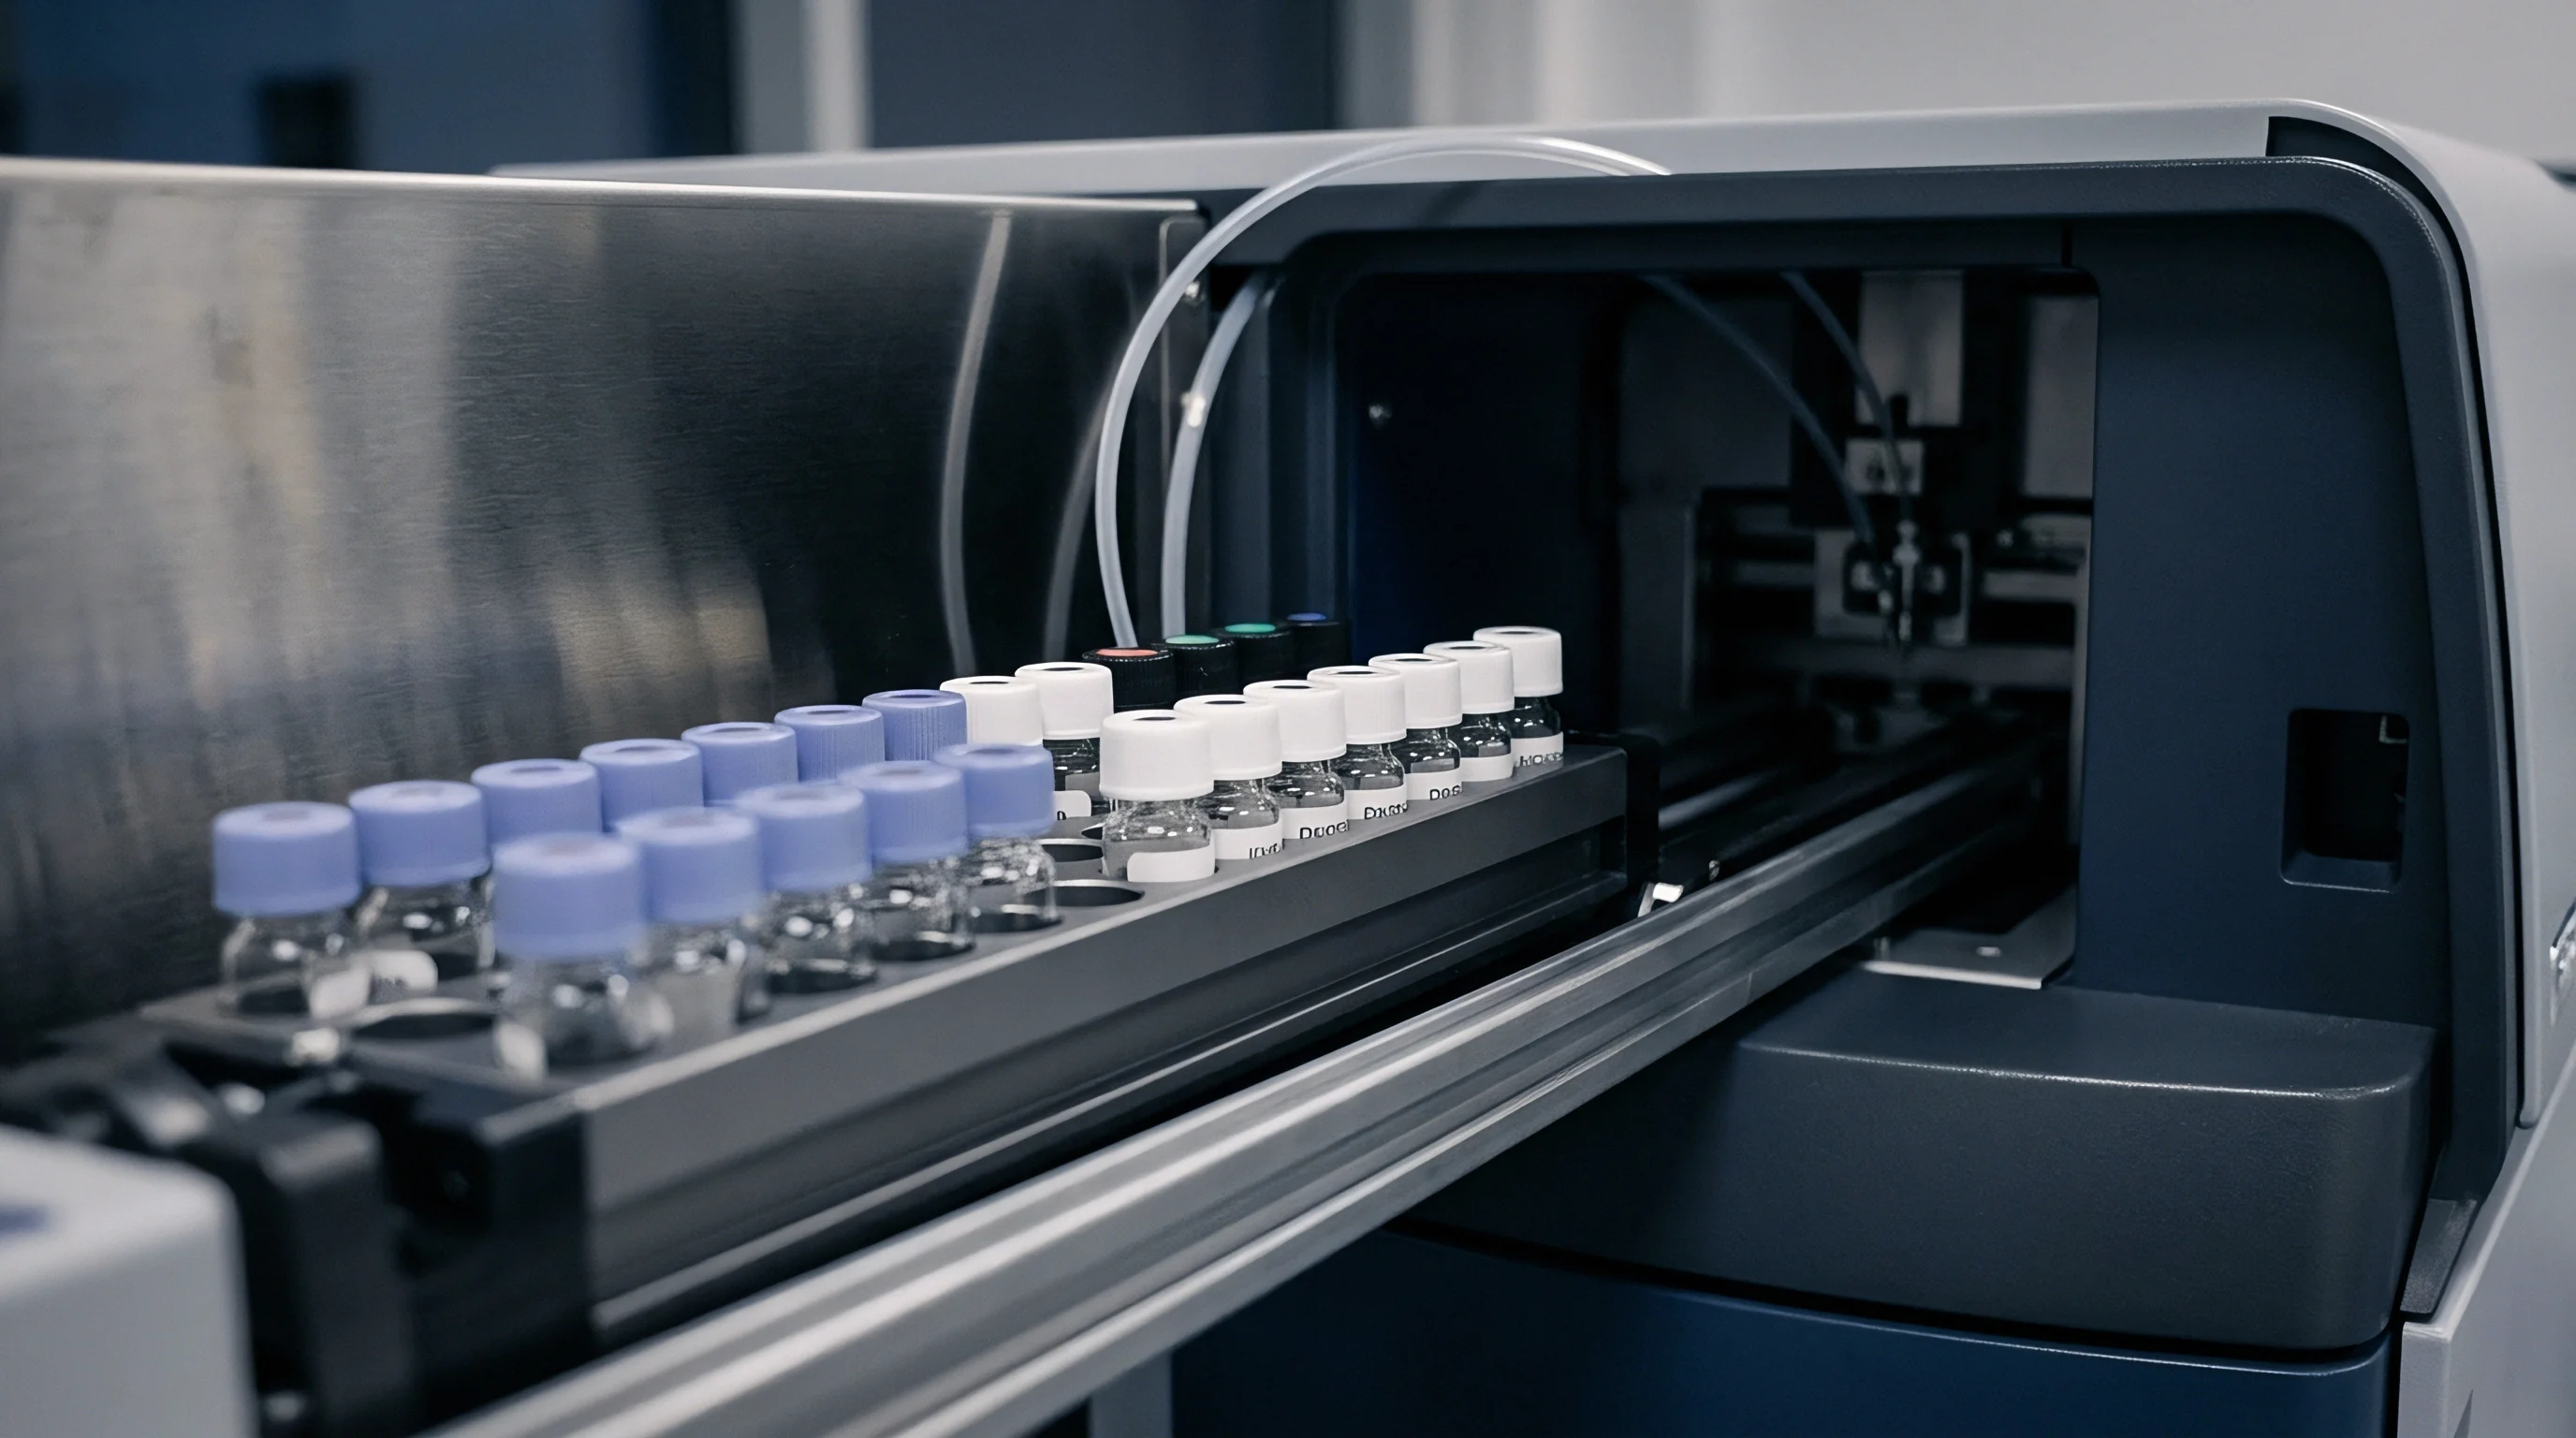
Quantifying Polyethylene Contamination and Oxidation Induction
Post-consumer polypropylene collections frequently contain secondary polyolefin streams that alter crystallization behavior. Integrating the area of the secondary melting peak between 115 °C and 135 °C quantifies total polyethylene contamination. Secondary peak areas reveal polyethylene fractions.
Concentrations as low as two percent by weight induce phase separation in un-compatibilized blends, causing severe impact strength degradation at sub-zero operating temperatures.
Oxidation Induction Time (OIT), conducted in accordance with ISO 11357-6 at an isothermal temperature of 200 °C under pure oxygen flow, measures residual active primary and secondary antioxidants. Primary antioxidants, typically hindered phenols, scavenge free radicals, while secondary antioxidants, usually phosphites, decompose hydroperoxides during melt processing. Stabilizer depletion accelerates thermal degradation.
A steep drop in OIT values indicates that incoming material consumed its protective additive package during previous life cycles, leaving the resin highly vulnerable to auto-oxidation during profile extrusion or injection molding.
| Property Metric | Test Method Standard | Virgin Homopolymer PP | Post-Industrial rPP | Post-Consumer rPP Blend |
|---|---|---|---|---|
| Melting Temperature Peak (PP) | ISO 11357-3 | 163.5 to 166.0 °C | 161.0 to 164.5 °C | 158.0 to 163.0 °C |
| Contaminant Melting Peak (PE) | ISO 11357-3 | None detected | 0.5 to 1.2 °C shoulder | 126.5 to 130.0 °C peak |
| Enthalpy of Fusion (ΔH_m) | ISO 11357-3 | 95.0 to 105.0 J/g | 88.0 to 98.0 J/g | 72.0 to 86.0 J/g |
| Recrystallization Peak (T_mc) | ISO 11357-3 | 112.0 to 116.0 °C | 116.5 to 121.0 °C | 122.0 to 128.5 °C |
| Oxidation Induction Time (OIT) | ISO 11357-6 | 35.0 minutes | 18.0 to 28.0 minutes | 2.5 to 12.0 minutes |
Suppliers frequently attribute secondary melting shoulders to harmless trace copolymers rather than structural polyethylene contamination.

Swell
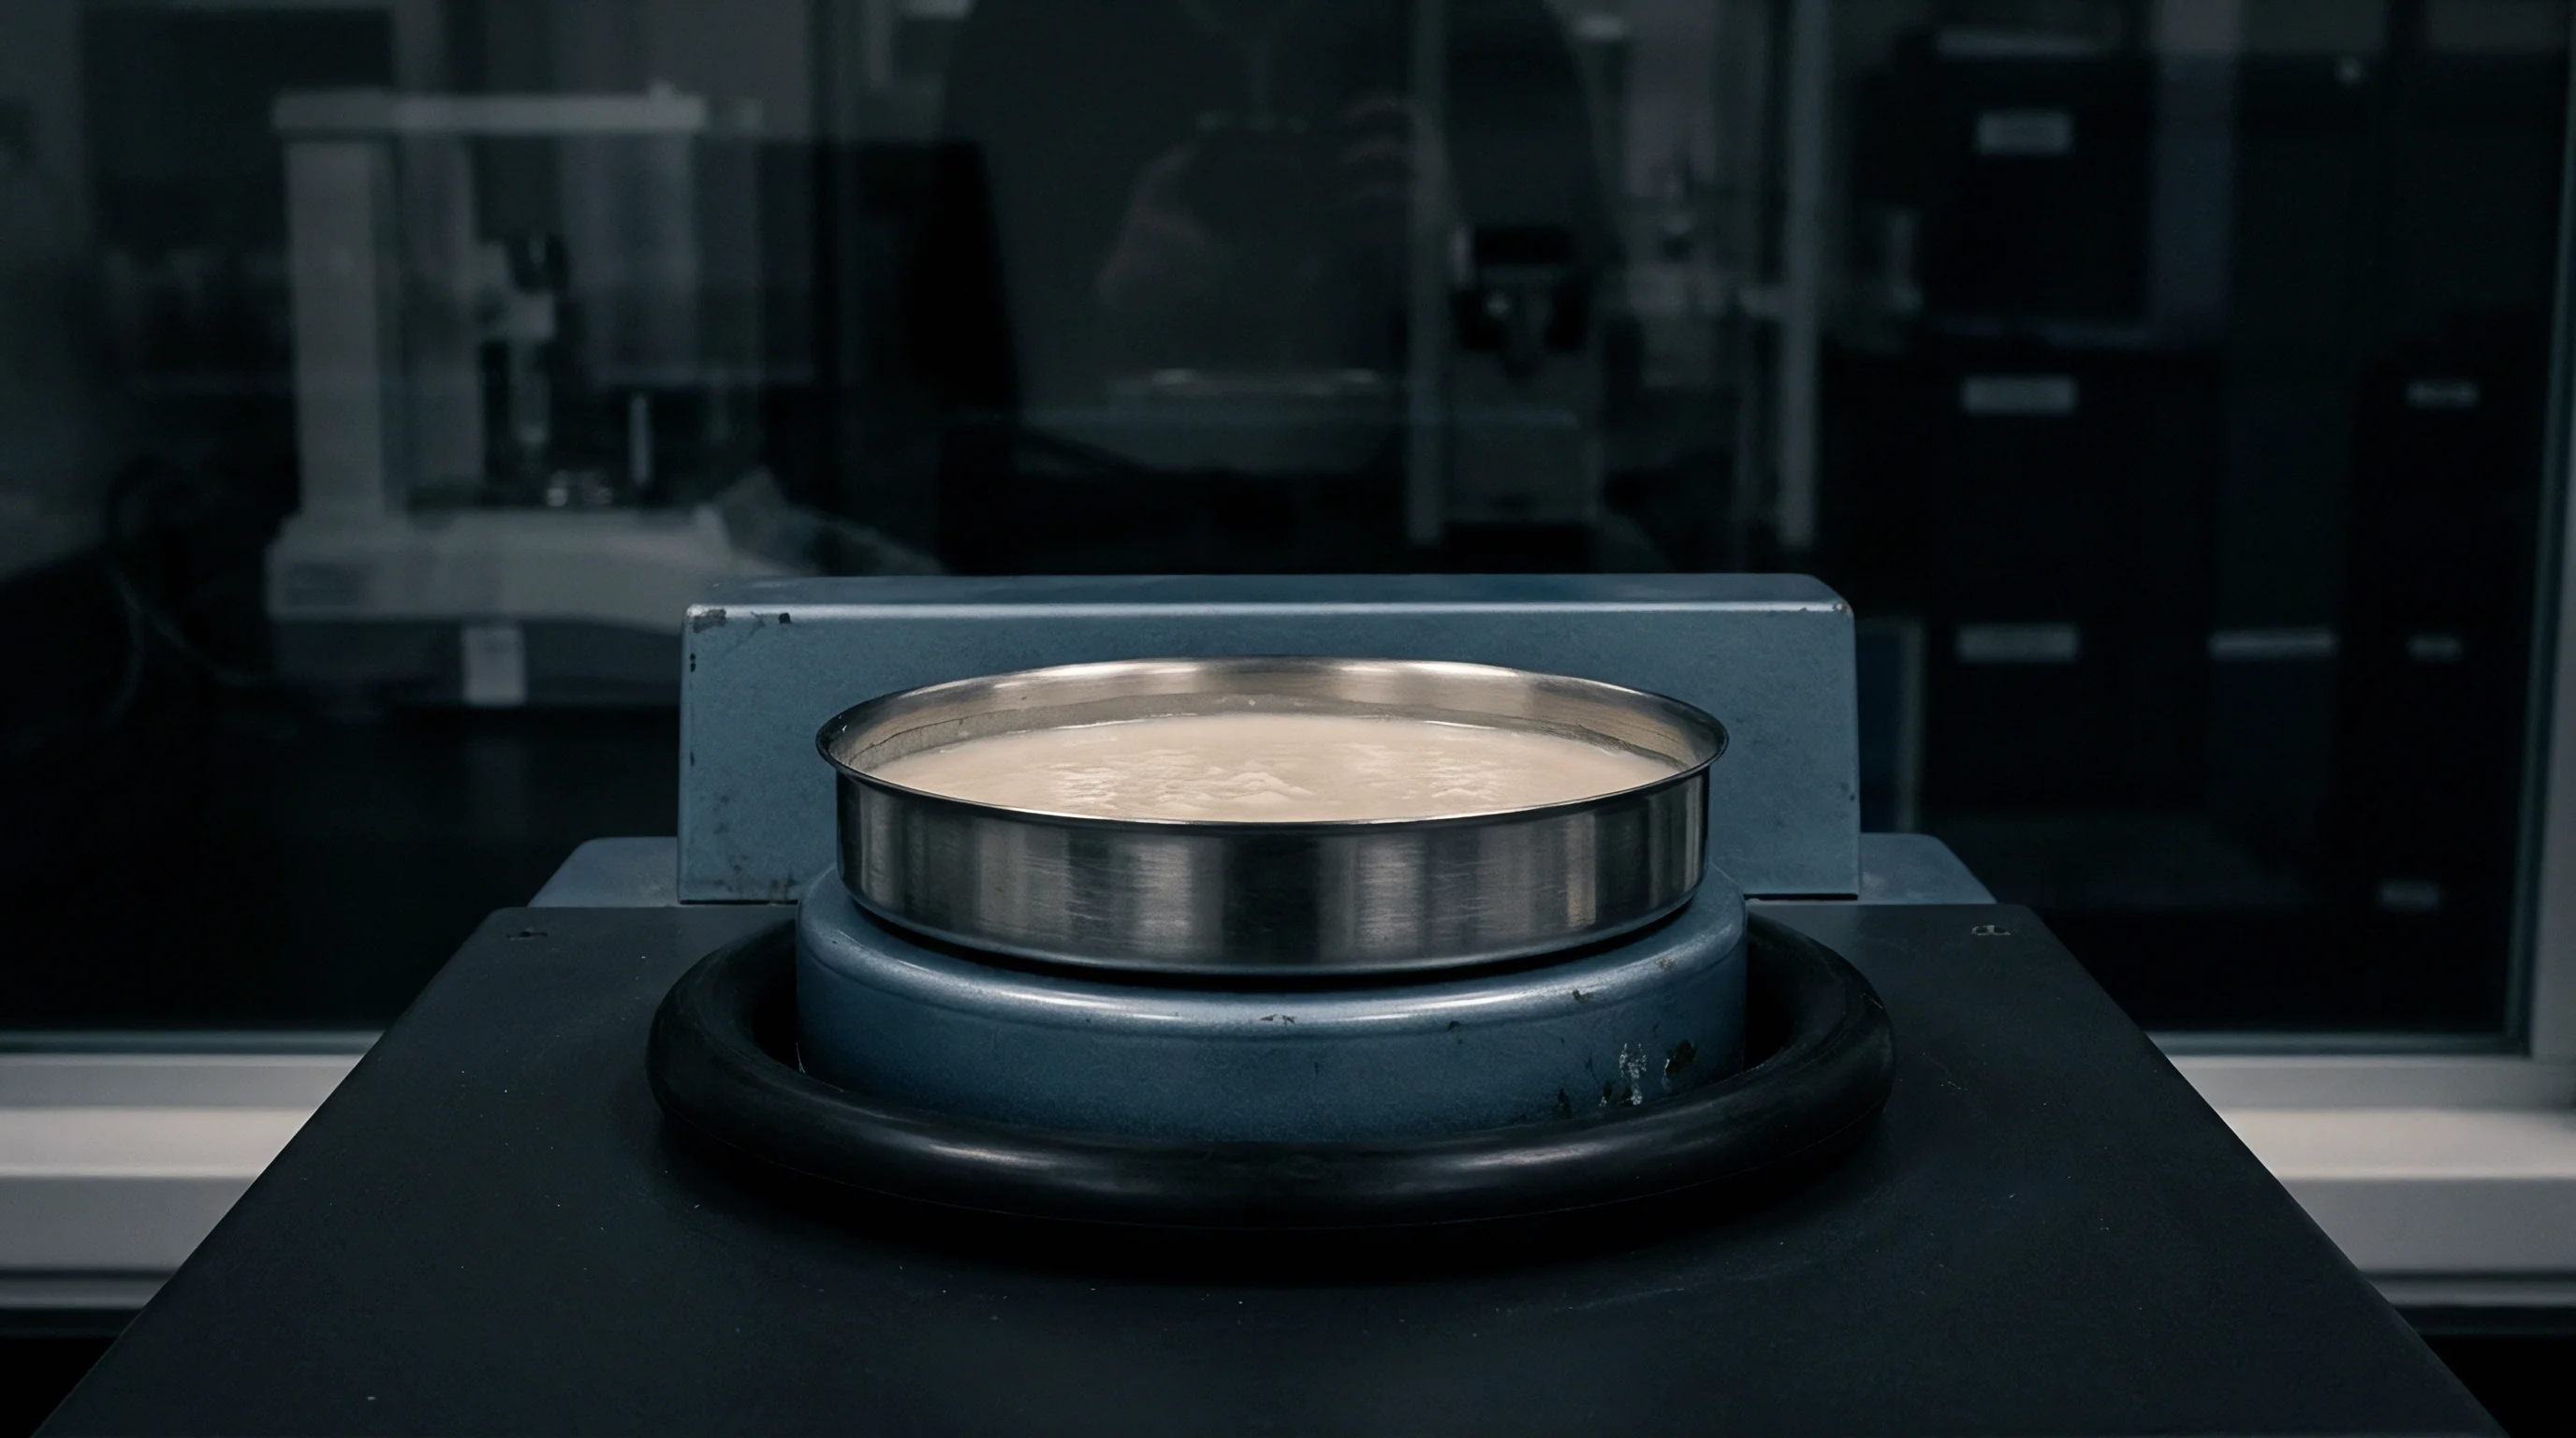
Elastic energy storage within molten polymer forces cross-sectional expansion upon exit from a restricted orifice. Capillary rheometry measures this elastic memory alongside viscous shear resistance. Testing requires a twin-barrel capillary rheometer equipped with precision pressure transducers mounted directly above entrance zones of interchangeable tungsten carbide dies.
Measurements collected using ISO 11443 standards utilize flat-entry dies with a 1.0 mm orifice diameter and length-to-diameter ratios of 10:1 and 30:1 to isolate inlet pressure losses from continuous capillary wall shear stress.

Capillary Rheometry Corrections and Data Refinement
Calculating true shear stress requires eliminating energy losses occurring at the inlet of the test channel. The Bagley correction method plots total measured pressure drop against capillary length-to-diameter ratios at constant shear rates. Extrapolating these linear pressure lines back to zero length reveals the entrance pressure drop, which represents the elastic work done to align polymer molecules before entering the die capillary.
Entrance pressure drops alter apparent values.
True viscosity requires double correction. Non-Newtonian fluid movement creates a parabolic velocity profile across the capillary diameter that departs from Newtonian ideal dynamics. The Rabinowitsch-Weissenberg correction adjusts the nominal wall shear rate by calculating the shear-thinning slope, designated as the rate index n prime.
Combining Bagley end-corrections with Rabinowitsch shear rate adjustments yields true shear viscosity curves essential for setting tight raw material acceptance limits.
Higher capillary die length-to-diameter ratios reduce entrance pressure distortion and yield truer shear stress calculations for post-consumer polymer blends.

Step-by-Step Capillary Test Execution Protocol
Accurate viscosity curves require systematically executing raw data transformations before generating material acceptance thresholds.
- Precondition polymer samples in a vacuum oven at 80 °C for four hours to eliminate moisture and surface volatiles prior to barrel loading.
- Pack dried pellets into the rheometer barrel in four distinct charges, tamping down each layer to minimize trapped air bubbles.
- Heat the packed barrel to the target test temperature of 210 °C and hold for a standardized soak time of six minutes to reach thermal equilibrium.
- Drive the piston downward across a logarithmic speed sweep to generate apparent shear rates between 50 s-1 and 5,000 s-1.
- Record steady-state capillary entrance pressure readings at each shear rate increment using both short and long dies.
- Construct Bagley pressure plots to subtract entrance pressure losses and calculate true wall shear stress.
- Apply Rabinowitsch formulas to convert apparent shear rates into true wall shear rates based on local power-law fluid behavior.
- Measure extrudate diameter using a non-contact laser micrometer positioned 10 mm below the die exit to calculate die swell ratio.
Extrudate geometry reflects elastic memory. High elasticity drives die swell expansion. Post-consumer polypropylene batches exhibiting severe chain degradation show minimal die swell due to loss of high molecular weight entanglements.
High wall-slip conditions occur in heavily lubricated or degraded formulations, causing severe distortion in corrected viscosity curves.
| Apparent Shear Rate (1/s) | Measured Pressure 10:1 Die (bar) | Measured Pressure 30:1 Die (bar) | Entrance Pressure Drop (bar) | Corrected Shear Stress (kPa) | True Viscosity (Pa·s) |
|---|---|---|---|---|---|
| 100.0 | 18.5 | 48.2 | 3.65 | 37.1 | 325.4 |
| 500.0 | 38.2 | 102.4 | 6.10 | 80.25 | 142.1 |
| 1,000.0 | 52.4 | 141.8 | 7.70 | 111.75 | 98.6 |
| 2,500.0 | 76.1 | 208.5 | 10.10 | 165.33 | 58.2 |
| 5,000.0 | 98.4 | 272.0 | 11.80 | 216.83 | 36.4 |
How wall slip velocity varies across high-regrind fraction compounds under non-isothermal industrial extrusion conditions remains an open experimental challenge.


Criterion
Establishing batch release boundaries demands combining multiple material parameters into a single analytical framework. Single point metrics invite production failure. Quality control specifications relying solely on melt flow rate allow wide rheological variations to pass incoming inspection undetected.
Coupling high-shear capillary rheometry with differential scanning calorimetry establishes robust acceptance windows that correlate directly with conversion equipment performance and final part durability.

How Does Non-Linear Shear Behavior Alter Batch Threshold Boundaries?
Varying shear sensitivity across reprocessed lots prevents simple linear scaling of viscosity profiles. Polymer batches experiencing moderate thermal degradation exhibit accelerated shear-thinning at high deformation rates while maintaining acceptable viscosity under low-stress conditions. Establishing a dual-point viscosity ratio threshold eliminates incoming material variance.
Broad distributions yield predictable flow ratios.
The viscosity ratio calculation compares true shear viscosity measured at 1,000 s-1 against true viscosity measured at 100 s-1. A virgin injection molding grade typically maintains a viscosity ratio between 0.28 and 0.32. Highly degraded recycled polypropylene lots drop below 0.22 due to narrow molecular weight distribution resulting from chain scission.
Setting strict lower limits on viscosity ratios prevents the release of brittle, low-strength lots into plant inventory.
Statistical acceptance windows built from combined rheological and thermal parameters eliminate processing downtime caused by unannounced lot substitution.

Multivariable Material Specifications
Effective quality controls combine rheological metrics with calorimetric thermal history indicators. Setting upper bounds on secondary melting enthalpy restricts total polyethylene contamination. Requiring minimum oxidation induction times protects downstream processing stability.
Integrating these independent analytical vectors creates a pass/fail matrix tailored to specific application requirements.
- Viscosity Ratio Limit enforces a minimum threshold of 0.26 for true viscosity ratio between 1,000 s-1 and 100 s-1 at 210 °C.
- Polyethylene Peak Limits cap secondary melting peak enthalpy between 120 °C and 134 °C at a maximum value of 3.5 J/g.
- Oxidation Induction Floor defines a strict minimum OIT limit of 15.0 minutes at 200 °C under pure oxygen flow.
- Recrystallization Temperature Window restricts peak crystallization temperature to a window between 116 °C and 122 °C.
| Test Parameter | Test Standard | Nominal Target Value | Upper Control Limit | Lower Control Limit |
|---|---|---|---|---|
| Capillary Viscosity (1,000 s⁻¹) | ISO 11443 | 105.0 Pa·s | 120.0 Pa·s | 90.0 Pa·s |
| Viscosity Ratio (1,000 / 100 s⁻¹) | ISO 11443 | 0.290 | 0.340 | 0.260 |
| Polyethylene Contamination Enthalpy | ISO 11357-3 | 1.2 J/g | 3.5 J/g | 0.0 J/g |
| Oxidation Induction Time (OIT) | ISO 11357-6 | 22.0 minutes | 40.0 minutes | 15.0 minutes |
| Extrudate Die Swell Ratio | ISO 11443 | 1.25 | 1.40 | 1.12 |
Incorporating ISO 11443 viscosity ratio limits directly into section four of the material supply contract establishes binding grounds for lot rejection prior to silo discharge.


Settlement
Commercial agreements rely on clear, measurable technical parameters to enforce incoming material quality. Relying on basic datasheet claims exposes resin buyers to severe financial risk when reprocessed lots fail on production machinery. Converting laboratory acceptance thresholds into enforceable contract terms provides direct protection against lot-to-lot variance, contamination, and premature thermal breakdown.
Laboratory values define target purchasing windows.

Contractual Specification Structure
Purchasing documentation converts laboratory test methods into binding supplier obligations. Technical supply agreements specify sample extraction methods, testing protocols, and precise control windows. Contracts require suppliers to attach a Certificate of Analysis generated from capillary rheometry and differential scanning calorimetry for every delivered lot.
Retained samples resolve supplier disputes.
Off-spec material triggers formal commercial adjustment clauses. When incoming testing reveals parameters falling outside set control limits, contract terms define monetary deductions or immediate lot rejection rights. Discrepancies generate commercial price deductions.
Clear technical specifications streamline dispute resolution by establishing objective, test-method-anchored pass or fail boundaries.

Worked Cost Impact Analysis
Evaluating the financial consequences of off-spec polymer shipments requires mapping lab metrics directly to plant yield losses. Assume a 40-tonne railcar shipment of post-consumer recycled polypropylene purchased at 1,350 USD per metric tonne, giving a raw material cargo value of 54,000 USD. The receiving plant produces thin-wall containers using an automated hot-runner injection molding process running on a 12-second cycle time.
During receiving inspection, capillary rheometry testing shows a viscosity ratio of 0.21 at 1,000 s-1, well below the contractually agreed lower control limit of 0.26. Differential scanning calorimetry testing shows an oxidation induction time of 4.5 minutes, failing the 15.0-minute specification floor, alongside a secondary polyethylene melting peak of 6.2 J/g indicating approximately 3 percent polyethylene cross-contamination.
Accepting and processing this lot without adjustment causes severe operational costs. Uncorrected viscosity drops induce severe mold flashing, increasing scrap rates from a baseline of 1.5 percent to 8.5 percent. High polyethylene contamination creates un-melted phase domain boundaries that lower top-load container strength, resulting in a 12 percent finished part failure rate during quality control drop testing.
Stabilizer depletion causes thermal degradation within the hot runner system, requiring two unscheduled tool tear-downs for cleaning per 24-hour operational shift.
Financial losses compound rapidly across a five-day production run consuming the 40-tonne lot. Unscheduled downtime equates to 18 operating hours lost at a machine rate of 220 USD per hour, totaling 3,960 USD in lost press capacity. Scrapped material accounts for 3.4 tonnes of wasted resin valued at 4,590 USD, while additional re-sorting labor and scrap grinding add 1,850 USD in direct overhead.
Total operational impact reaches 10,400 USD, representing a 19.2 percent cost penalty on the initial feedstock shipment.
Enforcing tight capillary and thermal acceptance thresholds at receiving prevents these compounding production losses. Contractual provisions allow the buyer to reject the non-conforming 40-tonne shipment outright, forcing the compounder to replace the lot at their expense, or claim a negotiated commercial price adjustment of 260 USD per tonne to offset internal sorting and processing modifications. Grounding purchasing contracts in precise rheological metrics converts incoming material quality control from an administrative hurdle into a profit-protection mechanism.
Establishing clear technical acceptance thresholds on incoming material protects manufacturing margins far more effectively than negotiating retroactive commercial rebates.