Polyolefin Hydrocarbon Oligomer Characterization and Chromatographic Baseline Resolution Techniques
Polyolefin oligomer characterization relies on liquid chromatography fractionation and two-dimensional gas chromatography to separate unresolved complex humps.

Fractionation
Polyolefin resin extracts contain complex mixtures of aliphatic chains, branched structures, and unsaturated hydrocarbon rings. Industrial production of polyethylene and polypropylene leaves residual low molecular weight polymers ranging from C10 to C50. These synthetic oligomers migrate into dry, fatty, or liquid foodstuffs, mimicking mineral oil contamination profiles during routine analysis.
Isolating specific hydrocarbon classes prior to gas chromatography prevents severe signal overlap in flame ionization detectors.
High-performance liquid chromatography partitions raw extracts into saturated and aromatic fractions, separating out interfering lipophilic polymers. Passing crude packaging extracts through activated silica stationary phases retains polar additives, triglycerides, and oxidized species. The non-polar solvent stream then sweeps unfunctionalized hydrocarbons into collection loops without thermal degradation.
High Performance Liquid Isolation Mechanics
Silica stationary phases separate saturated non-polar molecules from aromatic rings through differential adsorption energy. Columns impregnated with silver nitrate offer modified selectivity by forming reversible pi-complexes with unsaturated polyolefin bonds. Solvent transfer volumes depend directly on retention windows.
Saturated polyolefin oligomeric hydrocarbons pass straight through unmodified silica gel in the initial hexane volume, while aromatic species and oligomers bearing carbon-carbon double bonds remain bound until stronger polar solvents elute the column.
Silica columns trap polar triglycerides cleanly. Column dimensions, particle size distribution, and solvent purity control the sharp cutoff between saturated and alkylated aromatic cuts. Incomplete fraction cutting allows polyolefin oligomeric saturated hydrocarbons to spill into the aromatic channel, distorting baseline quantification.
| Analyte Class | Mobile Phase Composition | Elution Volume (mL) | Stationary Phase Mechanism |
|---|---|---|---|
| Saturated Hydrocarbons (MOSH/POSH) | 100% n-Hexane | 2.0 to 3.5 | Zero retention on activated silica |
| Monocyclic Aromatics (MOAH/POAH) | Dichloromethane / n-Hexane (30:70) | 3.6 to 5.5 | Weak pi-pi interaction with silica silanols |
| Polycyclic Aromatics (3+ Rings) | 100% Dichloromethane | 5.6 to 8.0 | Strong pi-pi adsorption on silver ions |
| Polar Additives & Lipids | Toluene / Isopropanol (80:20) | 8.1 to 12.0 | Hydrogen bonding with silica surface hydroxyls |
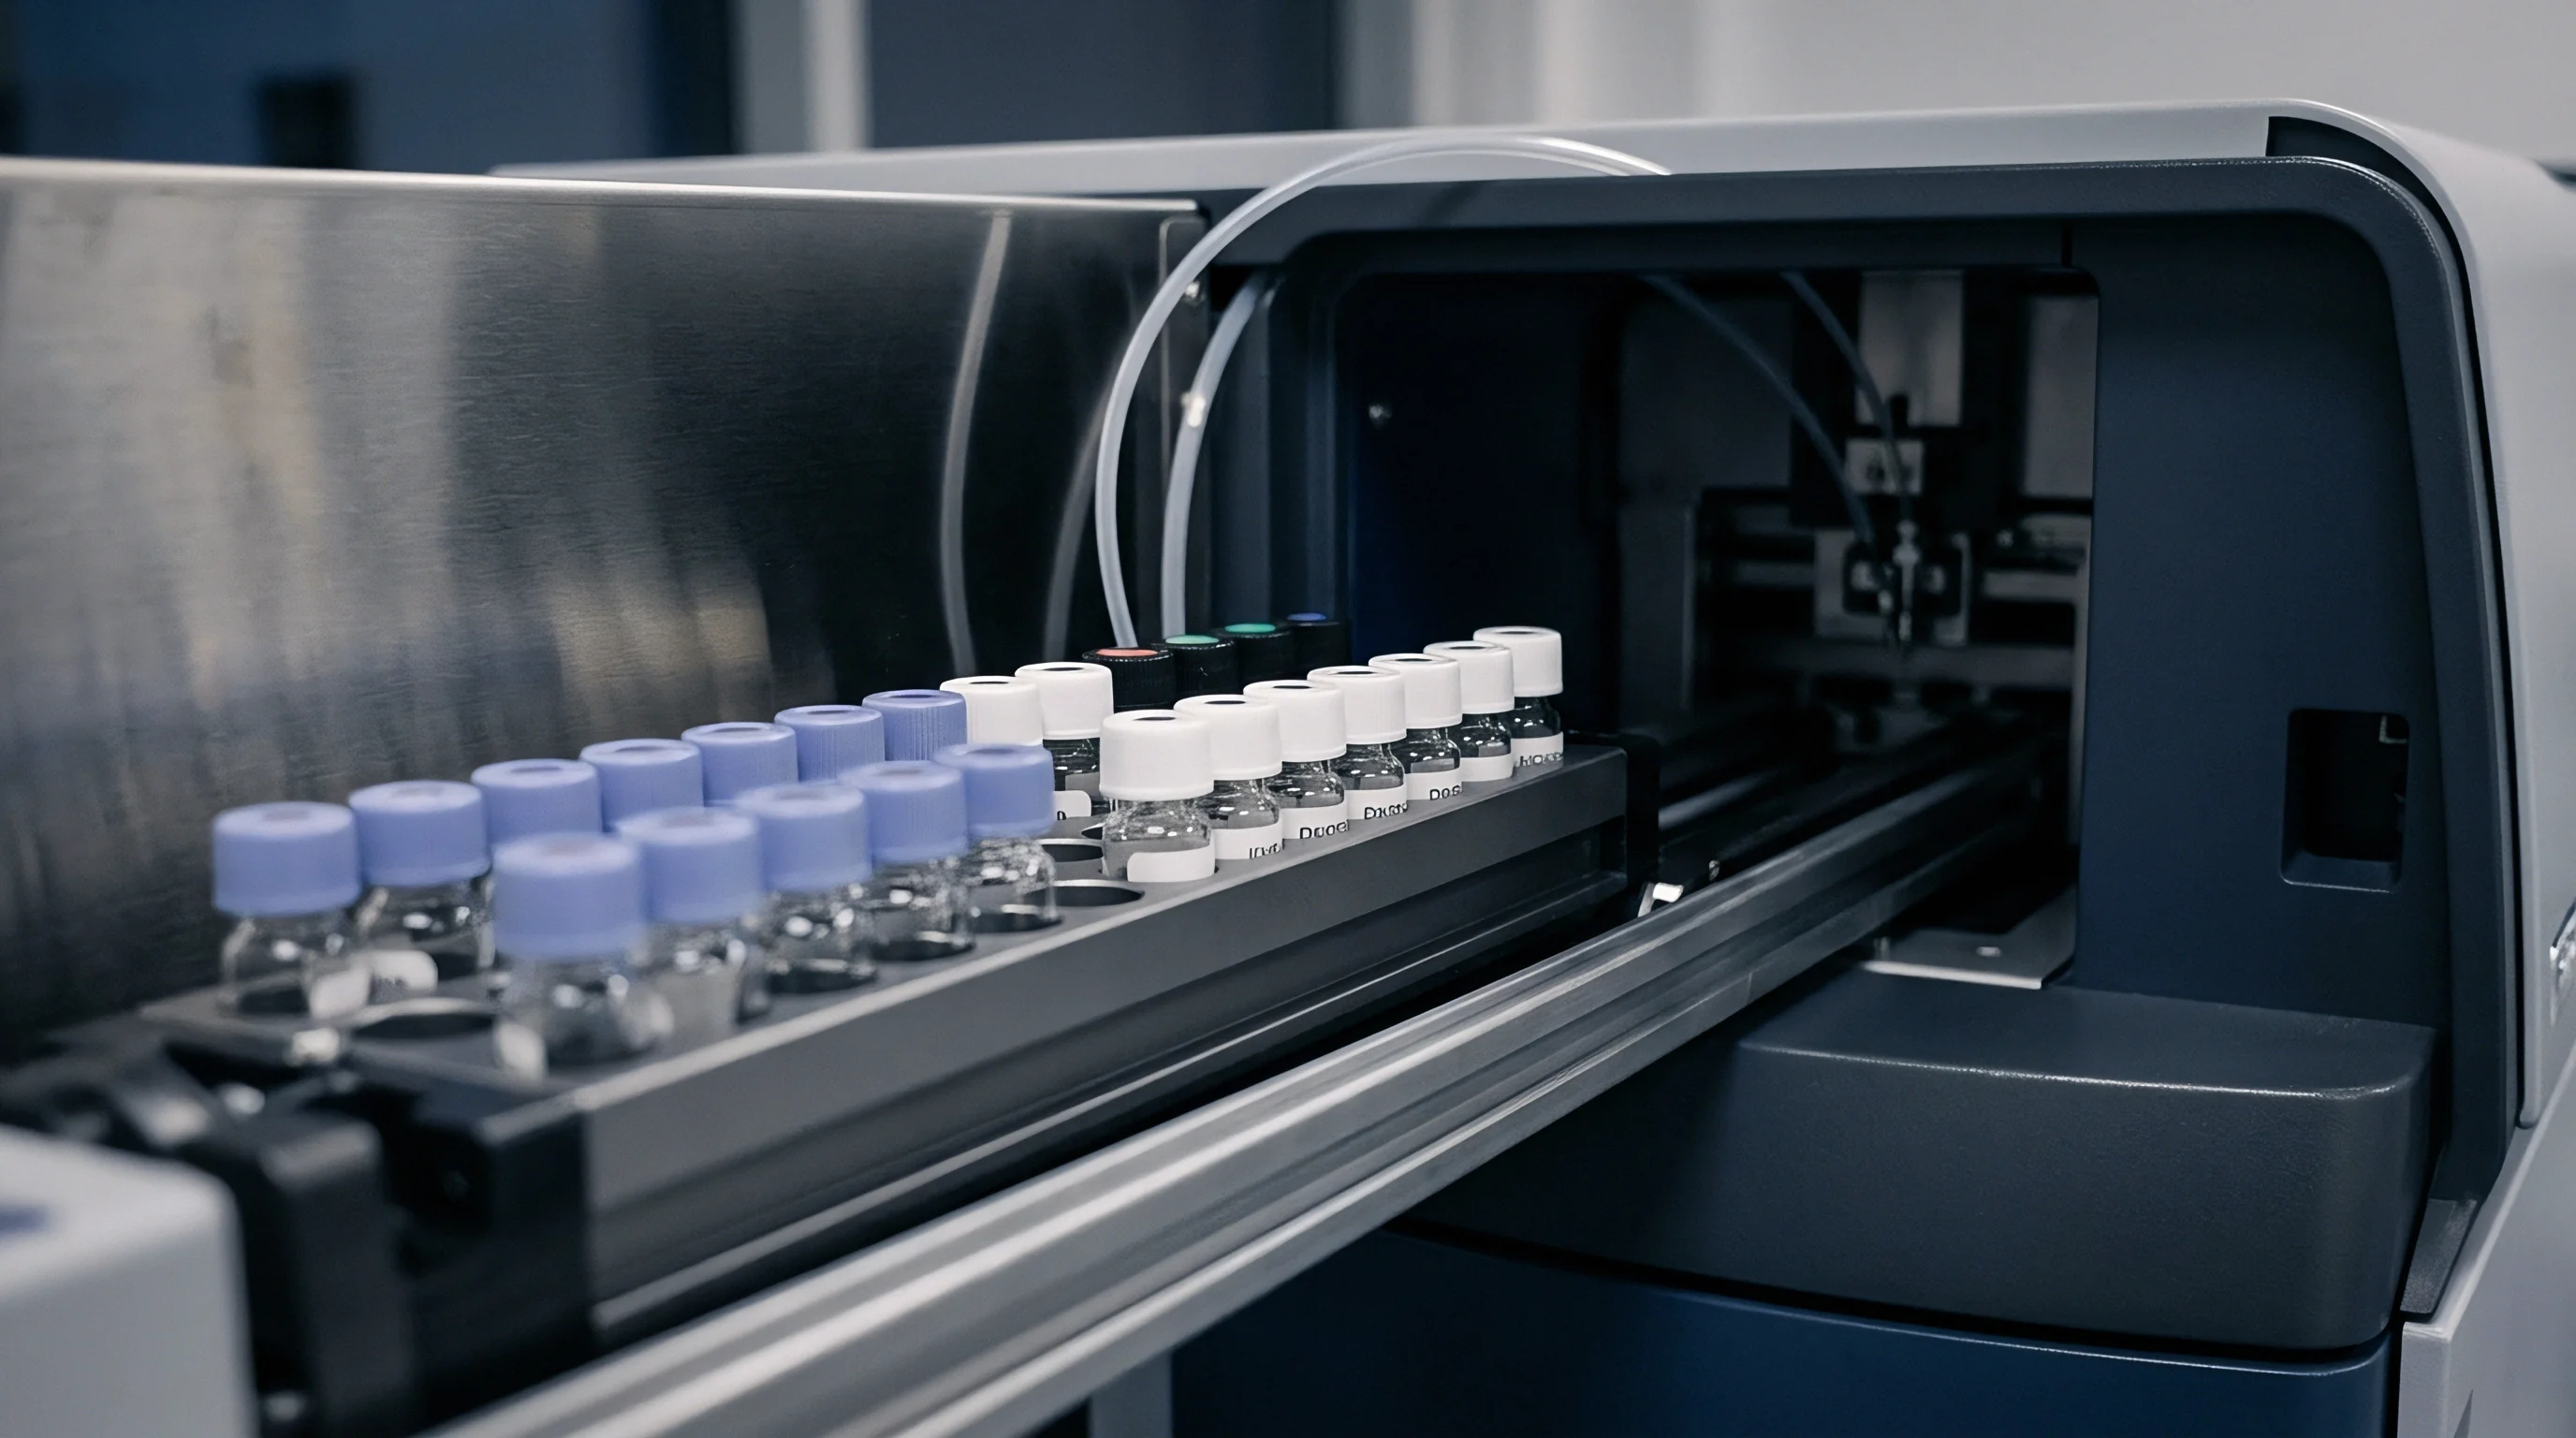
Solvent Gradient Elution Sequences
Hexane solvent streams wash aliphatic molecules through the column while aromatics remain bound to active silica sites. Once the saturated window clears, an automated switching valve redirects column effluent to a secondary gas chromatography inlet loop. Precise valve timing prevents solvent ring degradation and volatile analyte loss, and online systems can couple normal-phase liquid chromatography directly to gas capillary inlets through solvent evaporation interfaces.
Hexane elutes the aliphatic fraction first. Solvent vapor exit tubes vent excess solvent while retaining hydrocarbon chains above carbon number ten. If transfer volumes are mismatched, liquid floods the capillary pre-column, broadening peak shapes and ruining chromatographic resolution.
Migration testing in Tenax for 10 days at 60 degrees Celsius yields 1.2 mg/dm2 of polyolefin oligomeric saturated hydrocarbons.
Manual off-line collection risks atmospheric contamination and evaporative loss of volatile C10 to C14 oligomers. Online configurations eliminate sample handling and lower blank background noise, while automated retention time tracking maintains fraction boundaries across long analytical sequences.
- Extract the plastic packaging material using double-distilled n-hexane at 40 degrees Celsius for two hours.
- Inject fifty microliters of concentrated extract onto a high-performance silica gel column.
- Elute the aliphatic hydrocarbon cut using pure n-hexane at a flow rate of 300 microliters per minute.
- Switch the solvent valve to dichloromethane to elute the aromatic hydrocarbon fraction into a separate collection vial.
- Concentrate both collected volumes under a gentle stream of nitrogen gas at 35 degrees Celsius prior to chromatographic analysis.
Oligomeric humps are often characterized as inert wax additions intrinsic to polymer density specifications.
Column
Capillary gas chromatography separates volatile hydrocarbon chains based on vapor pressure and boiling point distribution. Non-polar capillary columns coated with 100% dimethylpolysiloxane deliver reproducible separation for linear and branched saturated hydrocarbons. Carbon number distributions stretch across retention times corresponding to n-alkanes from C10 to C50.
Optimizing film thickness and carrier gas linear velocity maximizes peak capacity across broad unresolved complex mixtures.
Thermal gradients dictate capillary column resolution. Compared to helium, hydrogen carrier gas provides superior linear velocity flexibility, maintaining theoretical plate efficiency at elevated oven temperatures. Flow rate stability governs peak retention time reproducibility across hundred-run sequence queues.
Stationary Phase Selection for Hydrogenated Hydrocarbons
Non-polar dimethylpolysiloxane capillary coatings remain thermally stable up to 350 degrees Celsius during extended run profiles. Thin stationary phase films ranging from 0.1 to 0.15 micrometers reduce phase bleed and allow high-boiling C40 to C50 oligomers to elute cleanly. Thicker films increase sample loading capacity, though at the expense of higher baseline bleed noise at maximum oven temperatures.
Carrier gas flow directly affects separation efficiency. Mid-polarity stationary phases containing 5% phenyl substituted polysiloxane alter the retention order for branched polyolefin structures, changing baseline separation profiles between linear alkanes and highly substituted iso-alkanes. Stationary phase selection establishes the baseline slope during thermal ramp sequences.
| Column Phase Type | Film Thickness (µm) | Temperature Ramp (°C/min) | Maximum Elution Carbon Number |
|---|---|---|---|
| 100% Dimethylpolysiloxane (DB-1ms) | 0.10 | 15 to 350 | C50 |
| 5% Phenyl-Arylene Polysiloxane (DB-5ms) | 0.12 | 12 to 340 | C45 |
| 50% Phenyl-Methylpolysiloxane (DB-17ms) | 0.15 | 8 to 320 | C35 |
| Polyethylene Glycol (WAX) | 0.25 | 5 to 250 | C28 |
Temperature Ramp Strategy for High Boiling Species
Accelerating the thermal gradient prevents late-eluting saturated components from expanding into broad baseline humps. Starting oven temperatures near 50 degrees Celsius retain volatile C10 components during splitless injection, while rapid thermal ramps exceeding 15 degrees per minute drive heavy polyolefin oligomers through the column quickly enough to suppress peak broadening.
Clause 4.2 of EN 1186-13 mandates blank matrix extraction, forfeiting batch acceptance when baseline noise exceeds 0.05 mg/kg.
Extended isothermal holds at 350 degrees Celsius bake out residual high molecular weight polymers, protecting column life. Detector maintenance schedules depend on thermal bleed accumulation rates, and high-temperature conditioning clears low-volatility deposits before quantitative calibration runs.
- Phase degradation tailing creates asymmetric peak shapes that artificially inflate late-eluting baseline integral values.
- Inlet liner contamination causes active site adsorption, suppressing peak responses for synthetic hydrocarbon oligomers above thirty carbons.
- Carrier gas velocity decay reduces theoretical plate numbers during high-temperature column oven ramp programs.
- Column bleed bleedover generates rising detector baselines that skew unresolved complex mixture quantification boundaries.
Standard delivery contracts referencing European Regulation 10/2011 Annex August 2023 updates automatically reclassify uncharacterized polyolefin humps as non-authorized non-intentionally added substances.
Interference
Synthetic polyolefin oligomers co-elute alongside mineral oil hydrocarbons in single-dimensional chromatographic runs. Polyethylene oligomeric saturated hydrocarbons consist of linear and mono-branched alkanes that match mineral oil saturated hydrocarbon retention windows. Polypropylene oligomers feature highly branched structures with tertiary carbon centers every third monomer unit, generating distinct signal humps centered around specific monomer multiples.
Because polyolefin oligomers generate broad humps, differentiating non-mineral synthetic oligomers from petroleum-derived contaminants demands specialized chemical treatment or multi-dimensional separation strategies. Unmodified flame ionization detector signals sum all hydrocarbon mass indiscriminately within a given retention window.
How Does Polyolefin Oligomer Interference Mask Mineral Oil Contamination?
Polyethylene and polypropylene side-products generate unresolved humps that obscure discrete mineral oil signal bands. These overlapping unresolved complex mixtures inflate calculated mineral oil values, leading to false non-compliance reporting against strict packaging thresholds. While petrochemical mineral oil contamination contains alkylated cyclopentanes and cyclohexanes, polyolefin oligomers consist of open-chain alkenes and branched alkanes formed by polymer backbone cleavage.
Detector response varies with chain length. Polyolefin oligomeric aromatic hydrocarbons containing double bonds co-elute with mineral oil aromatic hydrocarbons, making single-dimensional quantification invalid. Chemically removing unsaturated polyolefin components isolates saturated mineral fractions for accurate measurement.
| Unsaturated Species | Reagent Conditions | Reaction Yield (%) | Silica Column Retention Behavior |
|---|---|---|---|
| Terminal Polyethylene Alkenes | mCPBA / Dichloromethane / 20°C | 98.5 | Complete retention on silica phase |
| Internal Polypropylene Alkenes | mCPBA / Dichloromethane / 20°C | 94.2 | Complete retention on silica phase |
| Sterically Hindered Olefins | Peracetic Acid / Acetone / 40°C | 88.0 | Partial elution in aromatic fraction |
| Saturated Mineral Alkanes | mCPBA / Dichloromethane / 20°C | 0.0 | Zero retention, elutes cleanly in MOSH |
Chemical Modification via Epoxidation
Peracetic acid reactions convert unsaturated double bonds into highly polar oxirane structures that bind to silica. Treatment with meta-chloroperoxybenzoic acid selectively oxidizes polyolefin alkenes while leaving saturated mineral oil alkanes untouched, converting unsaturated species into polar oxiranes.
Passing the epoxidized mixture through a silica gel cleanup column binds the resulting oxiranes firmly to the stationary phase. Saturated mineral oil hydrocarbons elute without retention into the collection vial, free from unsaturated polyolefin interference. Incomplete epoxidation leaves residual olefin peaks that misrepresent saturated mineral oil totals.
Higher column temperature ramps collapse late-eluting oligomeric humps into sharper signal envelopes.
Solvent impurities alter baseline offsets. Reagent purity determines reaction background cleanliness, as trace organic peroxides can introduce degradation artifacts in the gas chromatography inlet. Reagent blank testing confirms that chemical modification steps do not introduce spurious peak humps.
- Identify double bond density by analyzing the raw extract with infrared spectroscopy prior to chemical treatment.
- Execute epoxidation reaction using meta-chloroperoxybenzoic acid at room temperature to selective convert unsaturated polyolefins.
- Pass treated extract through silica to retain polar oxiranes while eluting unreacted saturated mineral oil hydrocarbons.
- Compare chromatographic profiles before and after chemical modification to isolate true mineral oil contamination levels.
Analytical methods still face uncertainty at the exact structural threshold where highly branched synthetic oligomers resist epoxidation and continue to mimic saturated mineral oil signals.

Quantification
Calculating total hydrocarbon mass requires precise integration boundaries across broad, unresolved chromatographic humps. Flame ionization detectors yield near-equal mass response factors for all hydrocarbon isomers, allowing signal area integration against known internal standards. Integrating these unresolved complex mixtures relies on constructing flat or exponential baselines connecting the start and end retention times of specified carbon windows.
Incomplete resolution skews integrated mass values. Automated integration software frequently truncates hump areas or misinterprets baseline noise as analyte signal. Defining standardized integration start points, such as the apex of the solvent peak or the C10 retention marker, ensures consistent mass calculations.
Worked Baseline Construction and Integration Parameters
Flame ionization detector responses remain uniform across aliphatic carbon chains when calculated against internal standard response factors. Consider a 20.0 gram polypropylene packaging film extracted into 100 milliliters of n-hexane and concentrated to 1.0 milliliter. An internal standard mixture containing 10.0 micrograms of bicyclohexyl and 10.0 micrograms of cholestane is added to the extract prior to injection.
Gas chromatography analysis yields an integrated total unresolved hump area of 450,000 area units between the C16 and C35 elution markers. The bicyclohexyl internal standard peak area measures 15,000 area units for a 10.0 microgram absolute mass loading. Calculating total oligomeric hydrocarbon mass gives 300 micrograms in the concentrated extract.
Dividing 300 micrograms by the initial 20.0 gram sample weight gives an oligomer concentration of 15.0 milligrams per kilogram of polyolefin material.
Subtracting sharp, discrete additive peaks from the total integrated hump area refines calculation accuracy. Plasticizer esters, antioxidant degradation products, and synthetic slip agents produce narrow peaks sitting atop the broad oligomeric hump. Software algorithms subtract these discrete peak areas from the envelope, preventing overestimation of polyolefin hydrocarbon oligomer mass.
| Retention Window | Target Analyte Group | Internal Reference Standard | Detection Threshold (mg/kg) |
|---|---|---|---|
| C10 to C16 | Volatile Saturated Oligomers | n-Undecane (n-C11) | 0.10 |
| C16 to C25 | Mid-Weight Hydrocarbon Hump | Bicyclohexyl (CyHex) | 0.20 |
| C25 to C35 | Heavy Polyolefin Oligomers | Cholestane (CHO) | 0.50 |
| C35 to C50 | High-Molecular Polymer Waxes | n-Tetracontane (n-C40) | 1.00 |
| Method Notes: Mass determinations rely on flame ionization detection calibrated against linear alkane response factors under unity response factor assumptions. | |||
Two Dimensional Chromatographic Peak Deconvolution
Orthogonal polar separation columns isolate polyolefin oligomeric saturated hydrocarbons from cyclic mineral structures. Two-dimensional gas chromatography couples a non-polar first-dimension capillary column to a mid-polar or polar second-dimension column using a thermal modulator. The modulator traps eluent fractions from the first column and injects them onto the second column in narrow pulses lasting four to six seconds.
Two-dimensional separation spreads overlapping components across a bivariate plane. Saturated polyolefin oligomers array along distinct chemical bands based on boiling point in the first dimension and polarity in the second, separating cyclic naphthenic mineral oil components vertically from open-chain polyolefin oligomers and allowing automated software region integration for each family.
Aromatic oligomers co-elute with mineral hydrocarbon contaminants under standard single-dimensional gas chromatography.
Quantifying distinct chemical zones on two-dimensional chromatograms requires setting specific polygon boundaries around oligomeric species. Polypropylene oligomer clusters appear as repeating diagonal patterns corresponding to trimers, tetramers, and pentamers, while polyethylene oligomers form tight horizontal bands matching linear alkane series. Integrating polygon regions separately prevents polyolefin signals from artificially inflating mineral hydrocarbon values.
- Internal standard recovery ratios fall between eighty and one hundred twenty percent for valid mass calculations.
- Baseline offset correction drift stays below two picoamperes across the entire carbon elution window.
- Detector response factor variation across C10 to C40 aliphatic standards remains within a five percent margin.
- Blank matrix noise profiles demonstrate zero co-eluting peaks within critical mineral oil retention zones.
Inaccurate peak integration that miscalculates polyolefin oligomer levels leads directly to port container rejections, customs holds, and product recall liabilities.


Attestation
Declarations of conformity trace back to verifiable laboratory batch records for every converted packaging lot, placing full legal liability on importers. Downstream brand owners demand clear analytical proof that polyolefin packaging materials comply with specific migration limits established under European Commission Regulation 10/2011. Test reports cover single production lots.
Generic supplier certificates that omit raw chromatographic baseline integration parameters expose buyers to severe regulatory non-compliance risks.
Because undocumented resins invalidate compliance claims, audit files must hold complete analytical records, including extraction conditions, internal standard recoveries, and two-dimensional separation chromatograms. Certificates stating total hydrocarbon values without distinguishing polyolefin oligomers from mineral oil contaminants fail technical inspection during customs verifications.
Supporting File Requirements for Regulatory Submissions
Auditors inspect raw chromatographic trace data to verify summary compliance cover letters. The technical dossier contains original signal baselines, epoxidation conversion efficiency checks, and blank matrix determinations. Verifying that the laboratory accredited its method under ISO 17025 for mineral oil and polyolefin characterization validates the analytical findings.
Discrepancies between resin manufacturer datasheets and finished packaging test reports frequently stem from thermal degradation during extrusion conversion. Processing virgin polyolefin resin at high temperatures generates new low molecular weight oligomeric humps not present in raw resin pellets. Testing finished converted articles guarantees accurate compliance records for market authority inspections.
Supply Chain Liability Allocation
Packaging convertors hold final legal obligation when food contact materials release uncharacterized oligomeric migrants above legal limits. Supply contracts define analytical testing protocols, batch sampling frequencies, and cost-sharing liabilities for non-compliant shipments. Including explicit baseline resolution requirements in purchasing specifications prevents supplier disputes regarding reported oligomer concentrations.
A declaration resting on generic resin datasheets without finished article migration testing transfers all regulatory risk directly to the importer of record.