Spatial Resolution Calibration Protocols for Micro Mould Cavity Surface Profilometry
Micro-mould profilometry spatial calibration requires instrument transfer function verification using chirp gratings to define spatial frequency limits in deep cavity features.


Target

Physical Standards for Cavity Profilometry Calibration
Calibration standards for micro-scale surface metrology rely on micro-structured reference artifacts with known spatial periods. Micro-mould cavity geometry places strict physical boundaries on how optical and tactile profilometers collect spatial data. Measuring surface roughness inside micro-cavities designed for micro-fluidic chips, optical arrays, or precision medical components requires calibrating lateral spatial resolution independently from vertical height resolution.
Vertical height calibration uses step-height standards under ISO 25178-701, but lateral spatial resolution relies on the instrument’s capacity to resolve fine pitch spatial frequencies across steep sidewalls and high-aspect-ratio trenches.
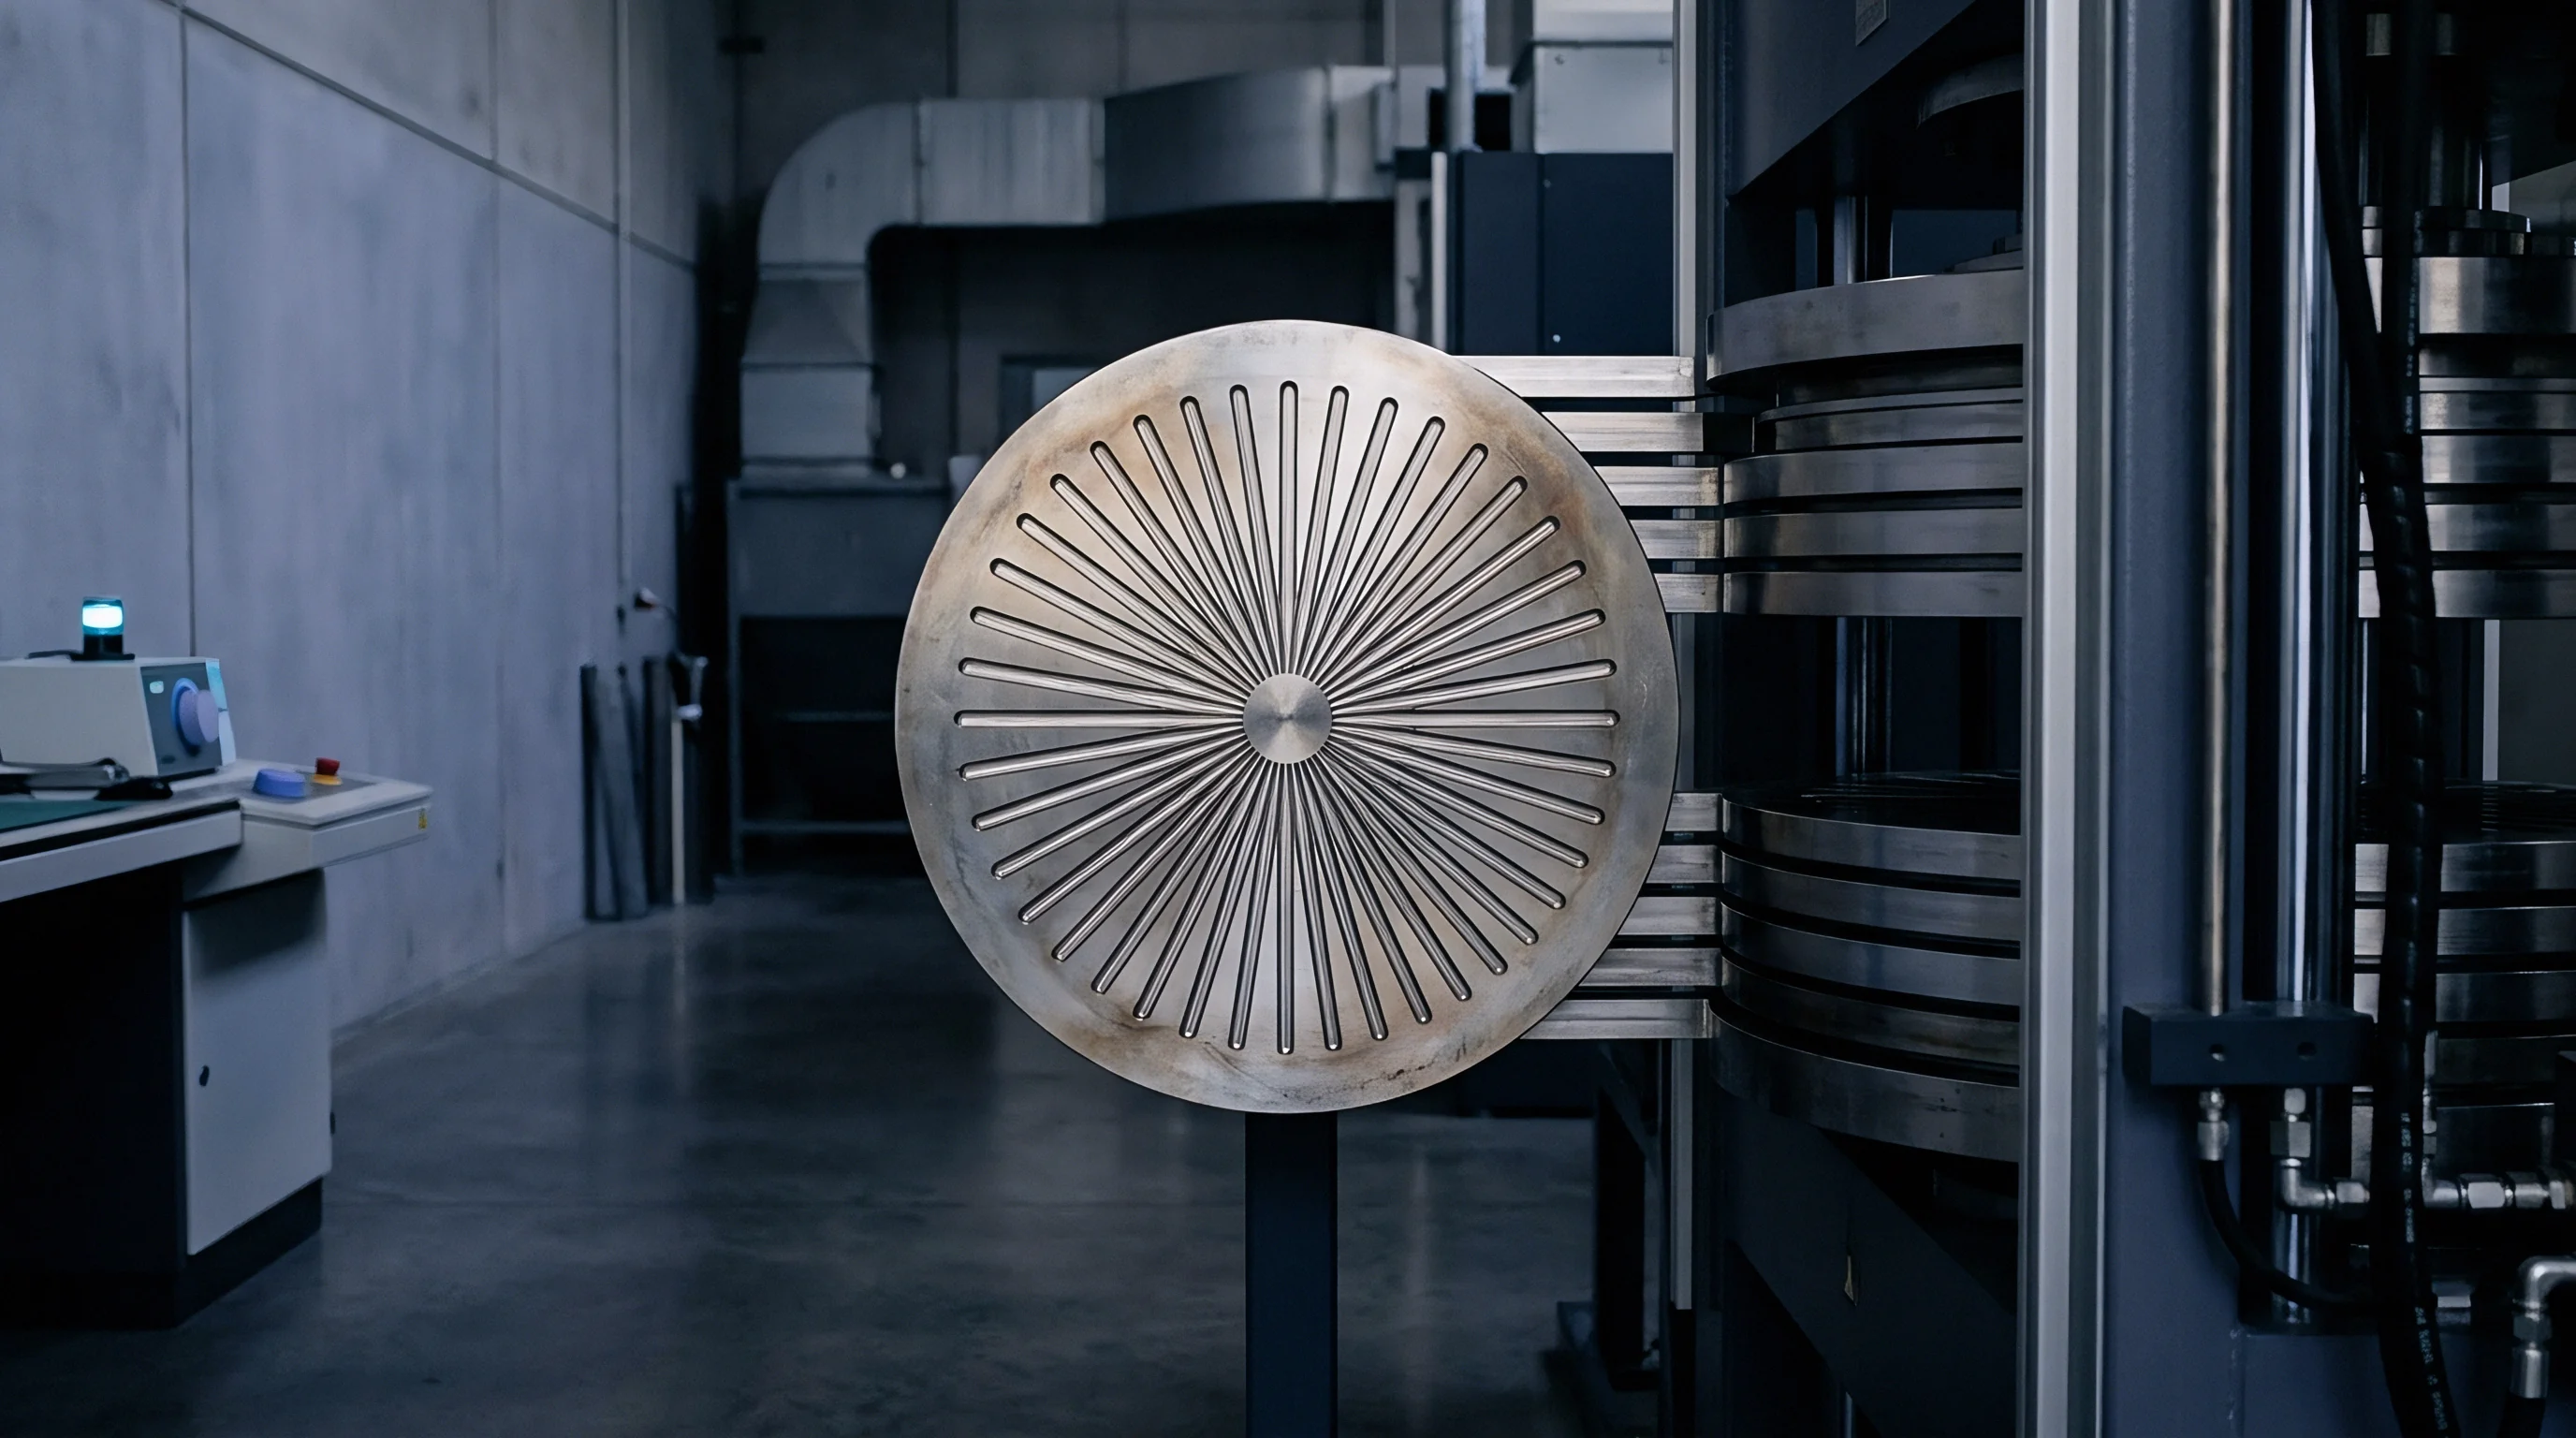
Reference standards used for lateral spatial calibration include 1D and 2D cross-gratings, Siemens stars, and optical chirp standards containing continuous variations in spatial frequency. Physical calibration artifacts machined via electron beam lithography or focused ion beam milling provide pitch accuracies within fractions of a nanometer. Placing these reference standards inside a micro-mould cavity or matching their physical mounting to the cavity depth compensates for changes in optical working distance and illumination scattering.
Coherence scanning interferometry achieves lateral spatial resolution down to 0.45 micrometres when utilizing a 100x magnification objective with a numerical aperture of 0.90 under monochromatic blue light illumination.
Micro-mould surface topography contains overlapping spatial frequencies from high-speed diamond milling, electrical discharge machining, or femtosecond laser ablation. Disentangling machine tool vibration markings from intentional sub-micron optical features demands that the calibration standard covers the full spatial bandwidth of the toolmaking process. Standard flat calibration blocks fail to replicate the optical occlusion, shadowing, and multiple-reflection phenomena occurring inside a micro-cavity with wall angles exceeding 70 degrees.
Artifact Selection for Micro-Scale Geometry
Selecting an appropriate calibration artifact involves balancing spatial frequency coverage against physical accessibility within narrow cavity features. Linear chirp standards feature a continuous gradient of spatial periods ranging from 100 micrometres down to 200 nanometers along a single scan vector. This gradient allows direct evaluation of the spatial frequency response in a single continuous measurement trace.
| Metrology Modality | Lateral Spatial Resolution | Maximum Measurable Slope | Working Distance Limit | Cavity Aspect Ratio Limit |
|---|---|---|---|---|
| Coherence Scanning Interferometry (CSI) | 0.35 to 1.20 µm | 15 to 60 degrees | 0.5 to 4.7 mm | 1:1 to 2:1 |
| Confocal Chromatic Imaging (CCI) | 0.80 to 2.50 µm | 30 to 75 degrees | 1.2 to 12.0 mm | 3:1 to 5:1 |
| Focus Variation Metrology (FVM) | 0.40 to 1.50 µm | 70 to 87 degrees | 1.5 to 22.0 mm | 5:1 to 10:1 |
| Contact Stylus Profilometry | 0.10 to 2.00 µm (tip dependent) | 45 to 88 degrees | Stylus arm reach reliant | 2:1 to 8:1 |
Calibrating lateral resolution inside a tool steel or nickel-cobalt mould insert presents physical risks to delicate optical edges and diamond-turned surfaces. Environmental temperature drift during measurement alters the pitch of metallic reference gratings by up to 12 parts per million per degree Celsius. Toolmakers select silicon-substrate or quartz-substrate artifacts with minimal thermal expansion coefficients to avoid spatial pitch calibration errors during long optical acquisition runs.
Micro-cavity profilometry applications encounter specific spatial calibration degradation modes during tool qualification:
- Optical aberration edge rounding degrades lateral edge sharpness due to diffractive blur at high objective numerical apertures inside deep cavities.
- Stylus tip radius convolution mechanically filters spatial wavelengths smaller than the physical dimension of the diamond probe point.
- Secondary illumination reflections generate phantom height fringes on vertical trench sidewalls that corrupt the spatial frequency spectrum.
- Substrate thermal mismatch causes apparent drift in calibration grating pitch when ambient cleanroom temperatures fluctuate during multi-cavity scanning.
Physical calibration standards determine instrument performance limits under ideal bench conditions, leaving open the question of how uncalibrated surface tilt angles alter spatial resolution inside deep features.

Bandwidth
Instrument Transfer Function and Spatial Frequency Cut-Offs
Instrument response curves across spatial frequencies govern the spatial limit where surface topography features can be faithfully reproduced. The Optical Transfer Function (OTF) and Modulation Transfer Function (MTF) define how an optical profilometer records spatial amplitudes across varying surface spatial frequencies. In surface metrology, this behavior is represented by the Instrument Transfer Function (ITF), which plots measured feature amplitude against true physical feature frequency.
An ideal profilometer maintains an ITF magnitude of 1.0 across all spatial frequencies up to its physical cutoff point. Physical reality forces the ITF to roll off smoothly as feature sizes approach the optical diffraction limit or the mechanical stylus radius. When the spatial wavelength of a micro-mould surface texture feature equals the sensor sampling limit, measured amplitude drops significantly, obscuring small surface flaws.
Mathematical modeling of the instrument transfer function relies on analyzing step-height response curves or rectangular line-gratings under ISO 25178-600. Derivatives of the measured step response yield the Point Spread Function (PSF), from which the spatial frequency bandwidth limit emerges through Fourier transformation. Spatial sampling intervals must conform to the Nyquist criterion, requiring at least two spatial sampling points per spatial period of the smallest feature of interest.
Optical and Mechanical Spatial Frequency Limits
Spatial resolution limits differ between non-contact optical profilometers and contact stylus instruments. Optical systems depend on light wavelength and objective numerical aperture (NA). High-NA objectives increase spatial bandwidth but reduce focal depth, creating optical sectioning difficulties when scanning micro-cavities with high relief variance.
Optical profilometers suffer a steep drop in lateral modulation transfer when scanning geometries whose spatial period falls below twice the primary illumination wavelength.
Contact stylus measurements define spatial bandwidth by mechanical contact mechanics and probe tip geometry. Hertzian contact stress limits the maximum allowable stylus force on soft cavity materials, including copper-tungsten EDM electrodes and aluminium prototype inserts. A stylus tip radius of 2 micrometres acts as a physical low-pass spatial filter, completely smoothing out surface features with spatial wavelengths below 500 nanometers.
| Probe or Objective Specification | Optical/Mechanical Limit | Minimum Spatial Wavelength | Nyquist Pixel/Sample Pitch | Amplitude Loss at Spatial Limit |
|---|---|---|---|---|
| 100x Optical (NA 0.90, λ = 460 nm) | Optical Diffraction | 0.31 µm | 0.08 µm | 50% at 0.40 µm period |
| 50x Optical (NA 0.55, λ = 550 nm) | Optical Diffraction | 0.61 µm | 0.15 µm | 50% at 0.75 µm period |
| 20x Optical (NA 0.40, λ = 550 nm) | Optical Diffraction | 0.84 µm | 0.21 µm | 50% at 1.10 µm period |
| Stylus Tip Radius 2.0 µm | Mechanical Tip Geometry | 1.25 µm | 0.25 µm | 70% at 1.50 µm period |
| Stylus Tip Radius 0.5 µm | Mechanical Tip Geometry | 0.45 µm | 0.09 µm | 40% at 0.60 µm period |
Determining spatial sampling parameters requires matching pixel density to the optical system numerical aperture rather than increasing camera resolution arbitrarily. Over-sampling without corresponding optical resolution increases file size without adding topography information. Under-sampling generates aliasing errors, transforming high-frequency tool chatter marks into false low-frequency surface waves on cavity inspection reports.
Spatial sampling resolution yields accurate topography data only when pixel density matches optical resolving power rather than optical array dimensions.

Probing

Interactions and Wave Scattering in Steep Cavities
Surface contact and optical wave interactions inside deep micro-structure walls introduce severe spatial distortion modes. Optical profilometry modes rely on receiving specularly scattered or diffracted light back into the objective lens optical path. Steep cavity sidewalls bounce light away from the collector aperture, producing signal loss, spurious noise, or apparent surface elevation drops.
Focus variation systems combat lighting dropouts by sweeping through z-heights while continuously processing local image contrast across adjacent pixels. This method allows measuring cavity sidewall slopes up to 87 degrees, though spatial resolution decreases as local surface contrast vanishes. Coherence scanning interferometry provides precise nanometric height resolution on flat surfaces but suffers phase jumps and optical batwings when encountering sharp geometric steps inside micro-fluidic channel ribs.
Micro-injection moulding cavities designed for micro-lens array production exhibit curved surface normals that continually shift relative to the optical axis. Local slope angle changes reduce effective numerical aperture, narrowing spatial frequency response across the optical surface profile.

How Does Cavity Aspect Ratio Distort Optical Spatial Frequency Response?
Aspect ratios exceeding 2:1 restrict objective clearance, forcing metrologists to use long working distance lenses with lower numerical apertures. A lower numerical aperture directly worsens lateral spatial resolution, broadening the spatial point spread function and obscuring sub-micron polish marks. High aspect ratio cavities physically block oblique illumination rays, preventing complete surface height map reconstruction without tilting the cavity fixture.
According to ISO 25178-70, spatial resolution characterization requires quantifying both lateral spatial limit and topographic spatial bandwidth under real operational inclination angles.
Physical probing with diamond-tipped styli introduces mechanical geometry constraints when traversing deep, narrow micro-grooves. Stylus shank clearance angles restrict approach geometry, preventing the tip from reaching bottom radius corners in narrow ribs. Dragging a stylus probe across optical-grade cavity inserts creates permanent micro-scratches on copper, brass, or nickel core pins.
Ignoring cavity aspect ratio limitations during metrology system setup yields erroneous spatial roughness profiles, resulting in the acceptance of rough tooling that causes micro-part ejection tearing or premature tool fouling.

Grating

Lateral Calibration Sequences and Alignment Protocols
Physical execution of lateral calibration requires rigorous alignment of structured 2D calibration grids relative to the optical traverse axis. Alignment errors between the calibration grid axes and system motion axes create geometric distortion, slanting linear features and exaggerating lateral spatial pitch measurements. Technicians utilize multi-axis tilt stages to flatten the reference target plane within tens of arcseconds prior to taking spatial calibration scans.
Cross-grating targets containing square grid patterns with known pitches, such as 10.000 micrometres ± 0.005 micrometres, calibrate lateral distance scales across x-axis and y-axis sensor dimensions. Software routines map pixel locations to true physical distance grids, generating a two-dimensional spatial distortion matrix. This correction matrix compensates for optical lens distortion, camera sensor tilt, and mechanical traverse non-linearities across the field of view.
Spatial resolution calibration sequences follow a standardized procedure to isolate physical instrument errors from environmental disturbances:
- Mount the reference target onto a thermally stabilized, vibration-isolated multi-axis positioning stage directly beneath the metrology objective.
- Level the reference artifact surface relative to the instrument optical focal plane until tilt interference fringes disappear across the primary field of view.
- Acquire a series of ten consecutive spatial topography images of the reference cross-grating, refocusing the system before each exposure pass.
- Compute the spatial Fourier transform of each raw image trace to identify peak fundamental and spatial harmonic spatial frequencies.
- Map lateral distortion vectors by measuring physical pixel location deviations relative to the reference coordinate matrix.
- Apply the calculated spatial correction matrix to the profilometer processing software and verify correction accuracy using a secondary chirp standard.

Spatial Calibration under Field Conditions
Cleanliness during calibration determines baseline measurement accuracy inside toolroom metrology suites. Airborne dust particulates, residual cutting fluids, or fingerprint oils fill sub-micron reference lines, altering calibration grating profile geometry. Ultrasonic cleaning of calibration targets using spectroscopic grade solvents precedes every lateral calibration cycle.
Mechanical vibration from surrounding press lines and toolroom CNC machinery corrupts low-frequency optical interference signals. Air-isolation metrology tables attenuate floor vibrations above 5 Hz, preventing false spatial ripple signatures from distorting instrument transfer function calculations.
Factory optical calibration is often assumed to eliminate the need for user lateral spatial calibration, yet physical field trials routinely demonstrate optical drift caused by transportation settling and shop-floor thermal cycling.

Transfer

Filtration, Cut-Offs, and ISO 25178 Parameters
Mathematical filtering separates process-induced spatial frequencies from true micro-cavity geometry features. ISO 25178-2 establishes spatial frequency filter conventions that divide raw measured surface topography into scale-limited surfaces. The S-filter removes high-frequency optical or electronic noise with spatial wavelengths smaller than the lateral instrument resolution limit.
The L-filter removes long-wavelength form errors, isolating roughness components for surface texture evaluation.
Selecting nested filter cut-offs, designated as lambda-s and lambda-c, determines which spatial surface wavelengths enter 3D aerial parameter equations. Setting an incorrect lambda-s spatial cut-off filter masks microscopic diamond tooling marks, presenting artificial smoothness on surface quality reports. Standard spatial cut-off selections must reflect the micro-mould geometry scale rather than conventional macroscopic machining values.
| Feature Type / Machining Process | Primary Spatial Wavelength Range | Recommended S-Filter (λs) | Recommended L-Filter (λc) | Sampling Grid Interval |
|---|---|---|---|---|
| Single-Point Diamond Turned Micro-Optics | 0.2 to 5.0 µm | 0.25 µm | 0.08 mm | 0.05 to 0.10 µm |
| Micro-EDM Fluidic Channel Cavity | 1.0 to 25.0 µm | 0.80 µm | 0.25 mm | 0.20 to 0.40 µm |
| Femtosecond Laser Textured Ribs | 0.1 to 2.0 µm | 0.15 µm | 0.025 mm | 0.03 to 0.08 µm |
| Micro-Milled Tool Steel Core Pins | 2.0 to 50.0 µm | 1.25 µm | 0.80 mm | 0.50 to 1.00 µm |
Selecting spatial filtering cut-offs requires balancing physical feature definitions against measurement spatial noise floor limits. An excessively tight S-filter artificially clips physical peaks on micro-milled cavity tool steel, altering calculated areal surface parameters including peak intensity height and root-mean-square gradient.

Selecting Parameters for Process Validation
Evaluating micro-cavity topography requires parameters that capture lateral spatial information alongside conventional height statistics. Simple arithmetic mean height (Sa) ignores lateral spatial wavelength structure entirely, yielding identical values for smooth continuous undulations and sharp high-frequency cutter scratch marks. The spatial auto-correlation length (Sal) parameter quantifies the dominant spatial wavelength present on cavity surfaces, identifying tool chatter or step-over variations.
Selecting appropriate filtering cut-offs involves a clear decision matrix based on tool manufacturing history and geometry:
- Process-matched cut-off selection prevents filtering out critical machining feed marks that directly govern polymer melt release force.
- Grid spacing verification confirms spatial sampling pitch remains below one-fifth of the smallest anticipated surface feature dimension.
- Bandpass validation verifies that nested S-F and L-F operators maintain mathematical stability across non-planar cavity geometries.
- Form suppression operator application isolates local roughness without introducing edge-effect ringing along steep rib intersections.
According to DIN 16742 qualification rules, spatial roughness parameter evaluation protocols must explicitly state the exact S-filter and L-filter cutoff wavelengths used during inspection calculations.
Tooling purchase specifications that state maximum allowable roughness values without defining the corresponding spatial cut-off filters allow suppliers to manipulate mathematical smoothing filters to pass out-of-specification cavity inserts.


Dossier

Verification Protocols and Tool Acceptance Dossiers
Commercial tool acceptance requires a fully documented quality packet specifying spatial resolution limits alongside tool surface finish claims. A complete metrology verification dossier bridges the gap between theoretical optical profilometer performance and actual micro-cavity surface quality. Procuring micro-injection tooling for high-precision components requires establishing explicit spatial profiling metrics before cutting steel.
A sign-off dossier records spatial frequency calibration profiles, instrument transfer function limits, environmental test conditions, and raw unfiltered surface topography datasets. Including raw un-filtered surface height matrix files alongside processed reports allows independent audit verification using third-party surface analysis software packages. This data preservation protects buyers when polymer replication issues emerge during high-volume production shifts.
Tooling sign-off documentation includes specific metrology verification records to prove spatial inspection integrity:
- Traceable calibration certificates showing target pitch accuracy and optical distortion correction matrices under ISO 17025 standards.
- Instrument transfer function plots demonstrating spatial frequency bandwidth limits measured using calibrated optical chirp standards.
- Raw spatial height matrices delivered in open binary format containing full spatial density metrics prior to digital filtering.
- Cut-off filter selection logs detailing exact lambda-s and lambda-c parameters applied during spatial roughness calculation passes.
- Environmental monitoring logs documenting cleanroom temperature stability and acoustic vibration levels during cavity measurement runs.

Commercial Risk and Tool Ownership Integration
Mismatch between mould tool surface roughness specifications and actual polymer part replication fidelity drives costly disputes between buyers and tooling vendors. A cavity insert measured on an uncalibrated optical profilometer may show an acceptable surface finish of 20 nanometers Sa, yet fail to release moulded polycarbonate micro-fluidic parts due to hidden high-frequency cutter grooves. The polymer melt fills sub-micron grooves under injection pressures reaching 1500 bar, creating mechanical interlocking that tears fine part features during ejection.
Tooling purchase agreements protect buyers by assigning financial ownership transition to successful dimensional and spatial surface verification. Sign-off clauses tie final tooling milestone payments directly to verified instrument transfer function profiles executed on the specific cavity geometries inside the supplier’s cleanroom.
When metrology dossiers demonstrate that spatial profiling protocols were executed using calibrated reference standards and appropriate ISO spatial filters, the risk of surface quality failure transfers from the toolmaker to the moulding process engineer, providing clear boundaries for tool sign-off and production release.