Spectroscopic Baseline Calibration Protocols for Post Industrial Polymer Compound Inspection
Standardize post-industrial resin testing by hot-pressing flat coupons, executing airPLS baseline fits, and anchoring integration bounds outside filler zones.

Pellet
Incoming post-industrial resin compounding lots conceal chemical heterogeneity behind uniform melt-cut faces. A lot of recycled polypropylene homopolymer arriving with an accredited ISO 1133 melt mass-flow rate of 12.0 g/10 min at 230 degrees Celsius and 2.16 kg routinely passes density displacement testing under ISO 1183 Method A while hiding lethal processing contaminants. Fourier transform infrared spectrometers equipped with attenuated total reflectance crystals register baseline shifts driven by three physical properties: pellet surface curvature, surface micro-roughness from strand pelletizer blade chatter, and refractive index dispersion across the mid-infrared region.
Placing a curved, rigid 3 mm pellet directly onto an uncoated diamond or zinc selenide crystal yields erratic contact surface areas. The resulting evanescent wave penetration depth, governed by crystal angle and refractive index differentials, produces severe spectral tilting and non-Beer-Lambert absorption behavior across the 4000 to 400 reciprocal centimeter scan window.

Spectral Distortion Induced by Asperity Variations
Direct unheated compression of raw post-industrial pellets onto attenuated total reflectance internal reflection elements creates non-uniform contact micro-geometries. The contact diameter between a hard semi-crystalline polymer pellet and an attenuated total reflectance crystal rarely exceeds 300 micrometers under standard clamping pressure. This restricted contact limits evanescent field interaction with the bulk matrix while maximizing anomalous light scattering across high-wavenumber regions.
Uncontrolled scattering produces a continuous upward baseline drift from 4000 down to 2000 reciprocal centimeters. The uncorrected baseline slope overwhelms minor carbon-hydrogen stretch fundamentals and obscures initial oxidation signifiers.
Attenuated total reflectance correction equations address refractive index dependencies across changing wavelengths. They do not eliminate spectral distortion originating from mechanical void spaces between resin granules and optical element substrates. When an unplasticized post-industrial compound rests against the prism, air pockets between pellet asperities induce refractive mismatch.
Stray internal reflections alter absolute band ratios, which undermines multivariate identification calibrations. The sourcing engineer encounters high lot rejections or false acceptances on recycled feedstocks because the instrument reads mechanical crystal decoupling rather than chemical contamination.
Baseline slope across 4000 to 2000 reciprocal centimeters shifts systematically with crystal contact geometry rather than chemical degradation.

Sample Presentation Geometries and Contact Area Repeatability
Consistent sample preparation eliminates mechanical contact variance. Compounding receiving benches use heated compression to form uniform test coupons or micro-pellet films. Compacting raw pellets at 180 to 210 degrees Celsius under 5 megapascals of hydraulic ram pressure produces thin, smooth disks measuring 150 to 200 micrometers in thickness.
These films provide uniform optical contact across the entire active area of a diamond attenuated total reflectance crystal, eliminating surface scatter baselines. The mechanical transformation yields uniform path lengths and reproducible evanescent field coupling for both high-density polyethylene and polypropylene matrices.
Cryogenic milling presents an alternative pathway for heat-sensitive post-industrial compounds containing crosslinking precursors or reactive compatibilizers. Pulverizing resin under liquid nitrogen below minus 150 degrees Celsius yields fine powders with particle diameters between 75 and 150 micrometers. Pressing these powders into dry potassium bromide pellets at 70 megapascals creates transmission test windows suitable for standard transmission spectroscopy under ISO 10640.
Transmission methods bypass surface-layer stratification, yielding absorption profiles that accurately reflect bulk lot composition. The engineer selects transmission or attenuated total reflectance modes based on the presence of opaque carbon black and mineral particulate loadings.
Optical consistency governs quantitative spectroscopic baselines across post-industrial polymers, leaving unaddressed the systematic interference of particulate mineral fillers and carbon pigments on raw baseline stability.


Mineral
Inorganic fillers and light-attenuating pigments disrupt mid-infrared baseline calibration across recycled polyolefin compounds. Talc, calcium carbonate, barium sulfate, and furnace carbon black arrive in post-industrial streams through automotive, compounding trim, and extrusion edge wastes. Each additive introduces specific refractive index discontinuities and strong fundamental lattice vibrations that overlap critical polymer host absorption bands.
Untreated baseline calibrations fail because strong mineral absorption bands distort regional baseline anchor points.

Scattering Profiles of Carbon Black Pigments
Furnace carbon black added at loadings between 0.5 and 2.5 mass percent acts as a Rayleigh and Mie scattering source throughout the mid-infrared wavelength spectrum. The sub-micron primary particle aggregates absorb and scatter incident infrared radiation, introducing a severe, monotonic baseline climb that rises continuously from 400 reciprocal centimeters to 4000 reciprocal centimeters. Standard two-point baseline linear offsets cannot linearize this curved, exponentially sloping background.
The elevated baseline reduces the effective dynamic range of the detector, causing significant photometric compression of weak carbonyl and hydroxyl bands.
| Inorganic Compound | Primary Absorption Bands (cm⁻¹) | Baseline Interference Zone (cm⁻¹) | Interfering Host Peak Target |
|---|---|---|---|
| Calcium Carbonate (Calcite) | 1420 (broad), 874 (sharp), 712 (sharp) | 1550 to 1300 | Polypropylene CH₂/CH₃ bending (1460, 1377) |
| Talc (Hydrous Magnesium Silicate) | 3676 (sharp), 1018 (intense), 669 | 1150 to 900 | High-density polyethylene vinyl groups (965, 909) |
| Barium Sulfate (Barytes) | 1180, 1120, 1070 (broad triplet), 608 | 1250 to 1000 | Polyethylene terephthalate ester C-O stretch (1100) |
| Furnace Carbon Black (N550/N660) | Continuous non-specific absorption slope | 4000 to 600 | Full spectrum baseline lift and band compression |
| Rutile Titanium Dioxide | Broad lattice absorption below 800 | 850 to 400 | Cis-alkene and aromatic out-of-plane bending |

Lattice Absorptions and Anchor Point Occlusion
Calcium carbonate introduces an asymmetric carbon-oxygen stretching vibration centered broadly at 1420 reciprocal centimeters. This massive absorption band swallows the characteristic polymer backbone scissor and bending vibrations of polyethylene at 1463 reciprocal centimeters and polypropylene at 1460 and 1377 reciprocal centimeters. Attempting to draw a baseline between 1500 and 1350 reciprocal centimeters creates severe calculation errors, generating false negatives for copolymer split determination.
Calibration software must place baseline boundary points outside the active mineral absorption domain, anchoring windows securely at 1550 reciprocal centimeters on the high side and 1310 reciprocal centimeters on the low side.
Talc introduces an intense, broad silicon-oxygen lattice band between 1080 and 950 reciprocal centimeters, combined with a sharp hydroxyl band at 3676 reciprocal centimeters. The primary Si-O-Si stretch obliterates structural unsaturation signals typically used to monitor thermal degradation. Trans-vinylene unsaturation at 965 reciprocal centimeters and terminal vinyl bands at 909 reciprocal centimeters disappear entirely within the talc absorption envelope.
Validating post-industrial polypropylene copolymer lots loaded with 20 mass percent talc requires derivative mathematical transformations rather than simple baseline subtractions to resolve obscured inflection peaks.
A contract clause rejecting resin lots based on raw infrared absorbance ratios without filler baseline corrections fails immediately in commercial arbitration.
Baseline manipulation methods must process these multi-component absorption backgrounds without eliminating trace chemical signifiers of material degradation.


Shift
Mathematical preprocessing of mid-infrared spectra stabilizes baseline positions prior to multivariate classification or single-band quantitative regression. Post-industrial resin streams exhibit wide shifts in chemical matrix purity, thermal oxidation states, and compounding additives across delivery batches. Standardizing baseline behavior requires deploying algorithmic corrections matched to the underlying physical cause of the distortion.
Applying an incorrect baseline algorithm damages spectral fidelity, eroding critical quantitative signal while amplifying detector noise.

Linear, Polynomial, and Adaptive Correction Algorithms
Linear two-point baseline correction defines a straight reference line between two user-specified zero-absorption wavenumbers, subtracting the interpolated value across the selected window. This method works cleanly across isolated absorption regions such as the carbonyl oxidation band from 1850 to 1650 reciprocal centimeters. It fails across wider spectral windows where carbon black scattering or crystal dispersion introduces parabolic curvature.
For curved baselines, second-order or third-order polynomial fitting algorithms calculate an estimated background curve. Polynomial algorithms require rigorous boundary constraints to prevent the computed baseline from carving into broad physical absorption bands.
Asymmetric Least Squares and airPLS algorithms fit smooth baselines to complex spectra by iteratively weighting errors. Positive deviations representing genuine polymer absorption bands receive low weights, while negative regions receive high weights to pull the baseline down against the true spectral trough. This automated baseline approach eliminates user bias in multi-operator compounding inspection laboratories.
The mathematical penalty parameter lambda controls baseline stiffness, and parameter p controls asymmetry. For polyolefin testing with mineral modifiers, setting lambda at 100,000 and p at 0.001 reliably isolates complex mineral backgrounds from narrow polymer absorption features.

Derivative Transforms and Normalization Bounds
Derivative spectroscopy eliminates baseline offsets entirely by measuring the slope and curvature of the spectral trace. The Savitzky-Golay first derivative transform removes flat constant baseline offsets, converting peak maxima into zero crossings. The second derivative removes linear sloping baselines, transforming original absorption peaks into downward-pointing troughs whose minima match the original band centers.
Calculating derivatives amplifies high-frequency instrument noise, necessitating careful optimization of the smoothing polynomial degree and filter window points. A 15-point smoothing window with a second-order polynomial provides optimal signal-to-noise retention for high-density polyethylene degradation monitoring.
Vector normalization and Standard Normal Variate scaling follow derivative transformations to normalize effective optical path length variations across irregular samples. Standard Normal Variate calculates the average absorbance across the full spectral profile, subtracts this mean from each spectral point, and divides the remainder by the standard deviation of the spectrum. Normalization operates successfully only across spectral regions free from totally absorbing peaks.
If a saturated pigment band drives detector absorbance above 2.5, standard normal variate algorithms distort all remaining peak amplitudes, ruining multivariate regression models.
Mathematical corrections stabilize optical traces on clean reference windows, yet post-industrial feeds frequently carry degraded polymer fractions that distort the baseline through active chemical oxidation.

Flaw
Chemical degradation in post-industrial plastics creates dynamic spectral interferences that mimic or compound optical baseline errors. Extrusion trim, thermoforming skeletons, and blow-molding flash endure repeated thermal and oxidative cycles before reprocessing. Thermal-mechanical degradation breaks carbon-carbon backbones, while photo-oxidative degradation generates complex oxygenated functional groups.
These degradation products introduce broad, overlapping absorption profiles that permanently skew standard calibration baselines.
Carbonyl Oxidation Distributions and Hydroperoxide Overlaps
Thermo-mechanical oxidation introduces a broad absorption envelope spanning 1800 to 1650 reciprocal centimeters, commonly referred to as the carbonyl band. In virgin polymers, this window serves as a stable zero-absorbance anchor for baseline drawing. In recycled post-industrial polymers, the zone fractures into distinct chemical signatures: peracids at 1780 reciprocal centimeters, gamma-lactones at 1765, aliphatic esters at 1740, aliphatic aldehydes at 1733, carboxylic acids at 1715, and isolated ketones at 1705 reciprocal centimeters.
Secondary auto-oxidation generates broad hydroperoxide and hydrogen-bonded hydroxyl stretches stretching continuously from 3600 to 3200 reciprocal centimeters.
| Chemical Functional Group | Peak Center (cm⁻¹) | Band Morphology | Primary Degradation Mechanism |
|---|---|---|---|
| Isolated Hydroperoxides (ROOH) | 3550 | Sharp shoulder | Early-stage radical propagation via oxygen capture |
| Hydrogen-Bonded Hydroxyls | 3420 | Broad asymmetric band | Secondary alcohol cascade and moisture absorption |
| Peracid / Lactone Carbonyl | 1780 to 1765 | High-frequency shoulder | Chain-scission cyclization under excessive shear |
| Ketone Carbonyl (Bulk Degradation) | 1715 to 1705 | Dominant peak | Norrish I and Norrish II photochemical reactions |
| Conjugated Polyene Systems | 1640 to 1600 | Low-intensity shoulder | Consecutive thermal dehydrochlorination or desaturation |
| Trans-Vinylene Unsaturation | 965 | Sharp isolated peak | High-temperature extrusion chain scission |

Additive Depletion and Transesterification Artifacts
Phenolic primary antioxidants such as pentaerythritol tetrakis(3,5-di-tert-butyl-4-hydroxyhydrocinnamate) show diagnostic ester absorption bands near 1745 reciprocal centimeters, along with sterically hindered phenolic hydroxyl peaks at 3650 reciprocal centimeters. Secondary phosphite process stabilizers such as tris(2,4-di-tert-butylphenyl)phosphite display phosphorus-oxygen-aryl bands at 1080 and 850 reciprocal centimeters. During compounding, these sacrificial stabilizers oxidize into phosphonates and quinoid degradation products.
The resulting quinone methide structures produce intense conjugated carbonyl absorptions around 1650 reciprocal centimeters, lifting local baselines and falsifying baseline corrections intended for fatty acid lubricant assessment.
Post-industrial polymer scrap containing mixed fractions of polyethylene terephthalate, polyamide, or ethylene vinyl acetate introduces complex multi-species degradation. Reprocessing condensation polymers in the presence of trace moisture triggers hydrolytic chain cleavage, expanding terminal carboxylate and amine absorption profiles. Ethylene-vinyl acetate scrap undergoes progressive deacetylation at temperatures exceeding 220 degrees Celsius, releasing acetic acid and forming conjugated carbon-carbon double bonds.
These conjugated dienes and trienes absorb infrared energy across 1640 to 1580 reciprocal centimeters, generating a stepped baseline offset that invalidates polyolefin automated baseline routines.
Distinguishing actual chemical degradation from optical baseline tilt requires establishing fixed reference standards built from confirmed pristine and degraded chemical profiles.
Gage
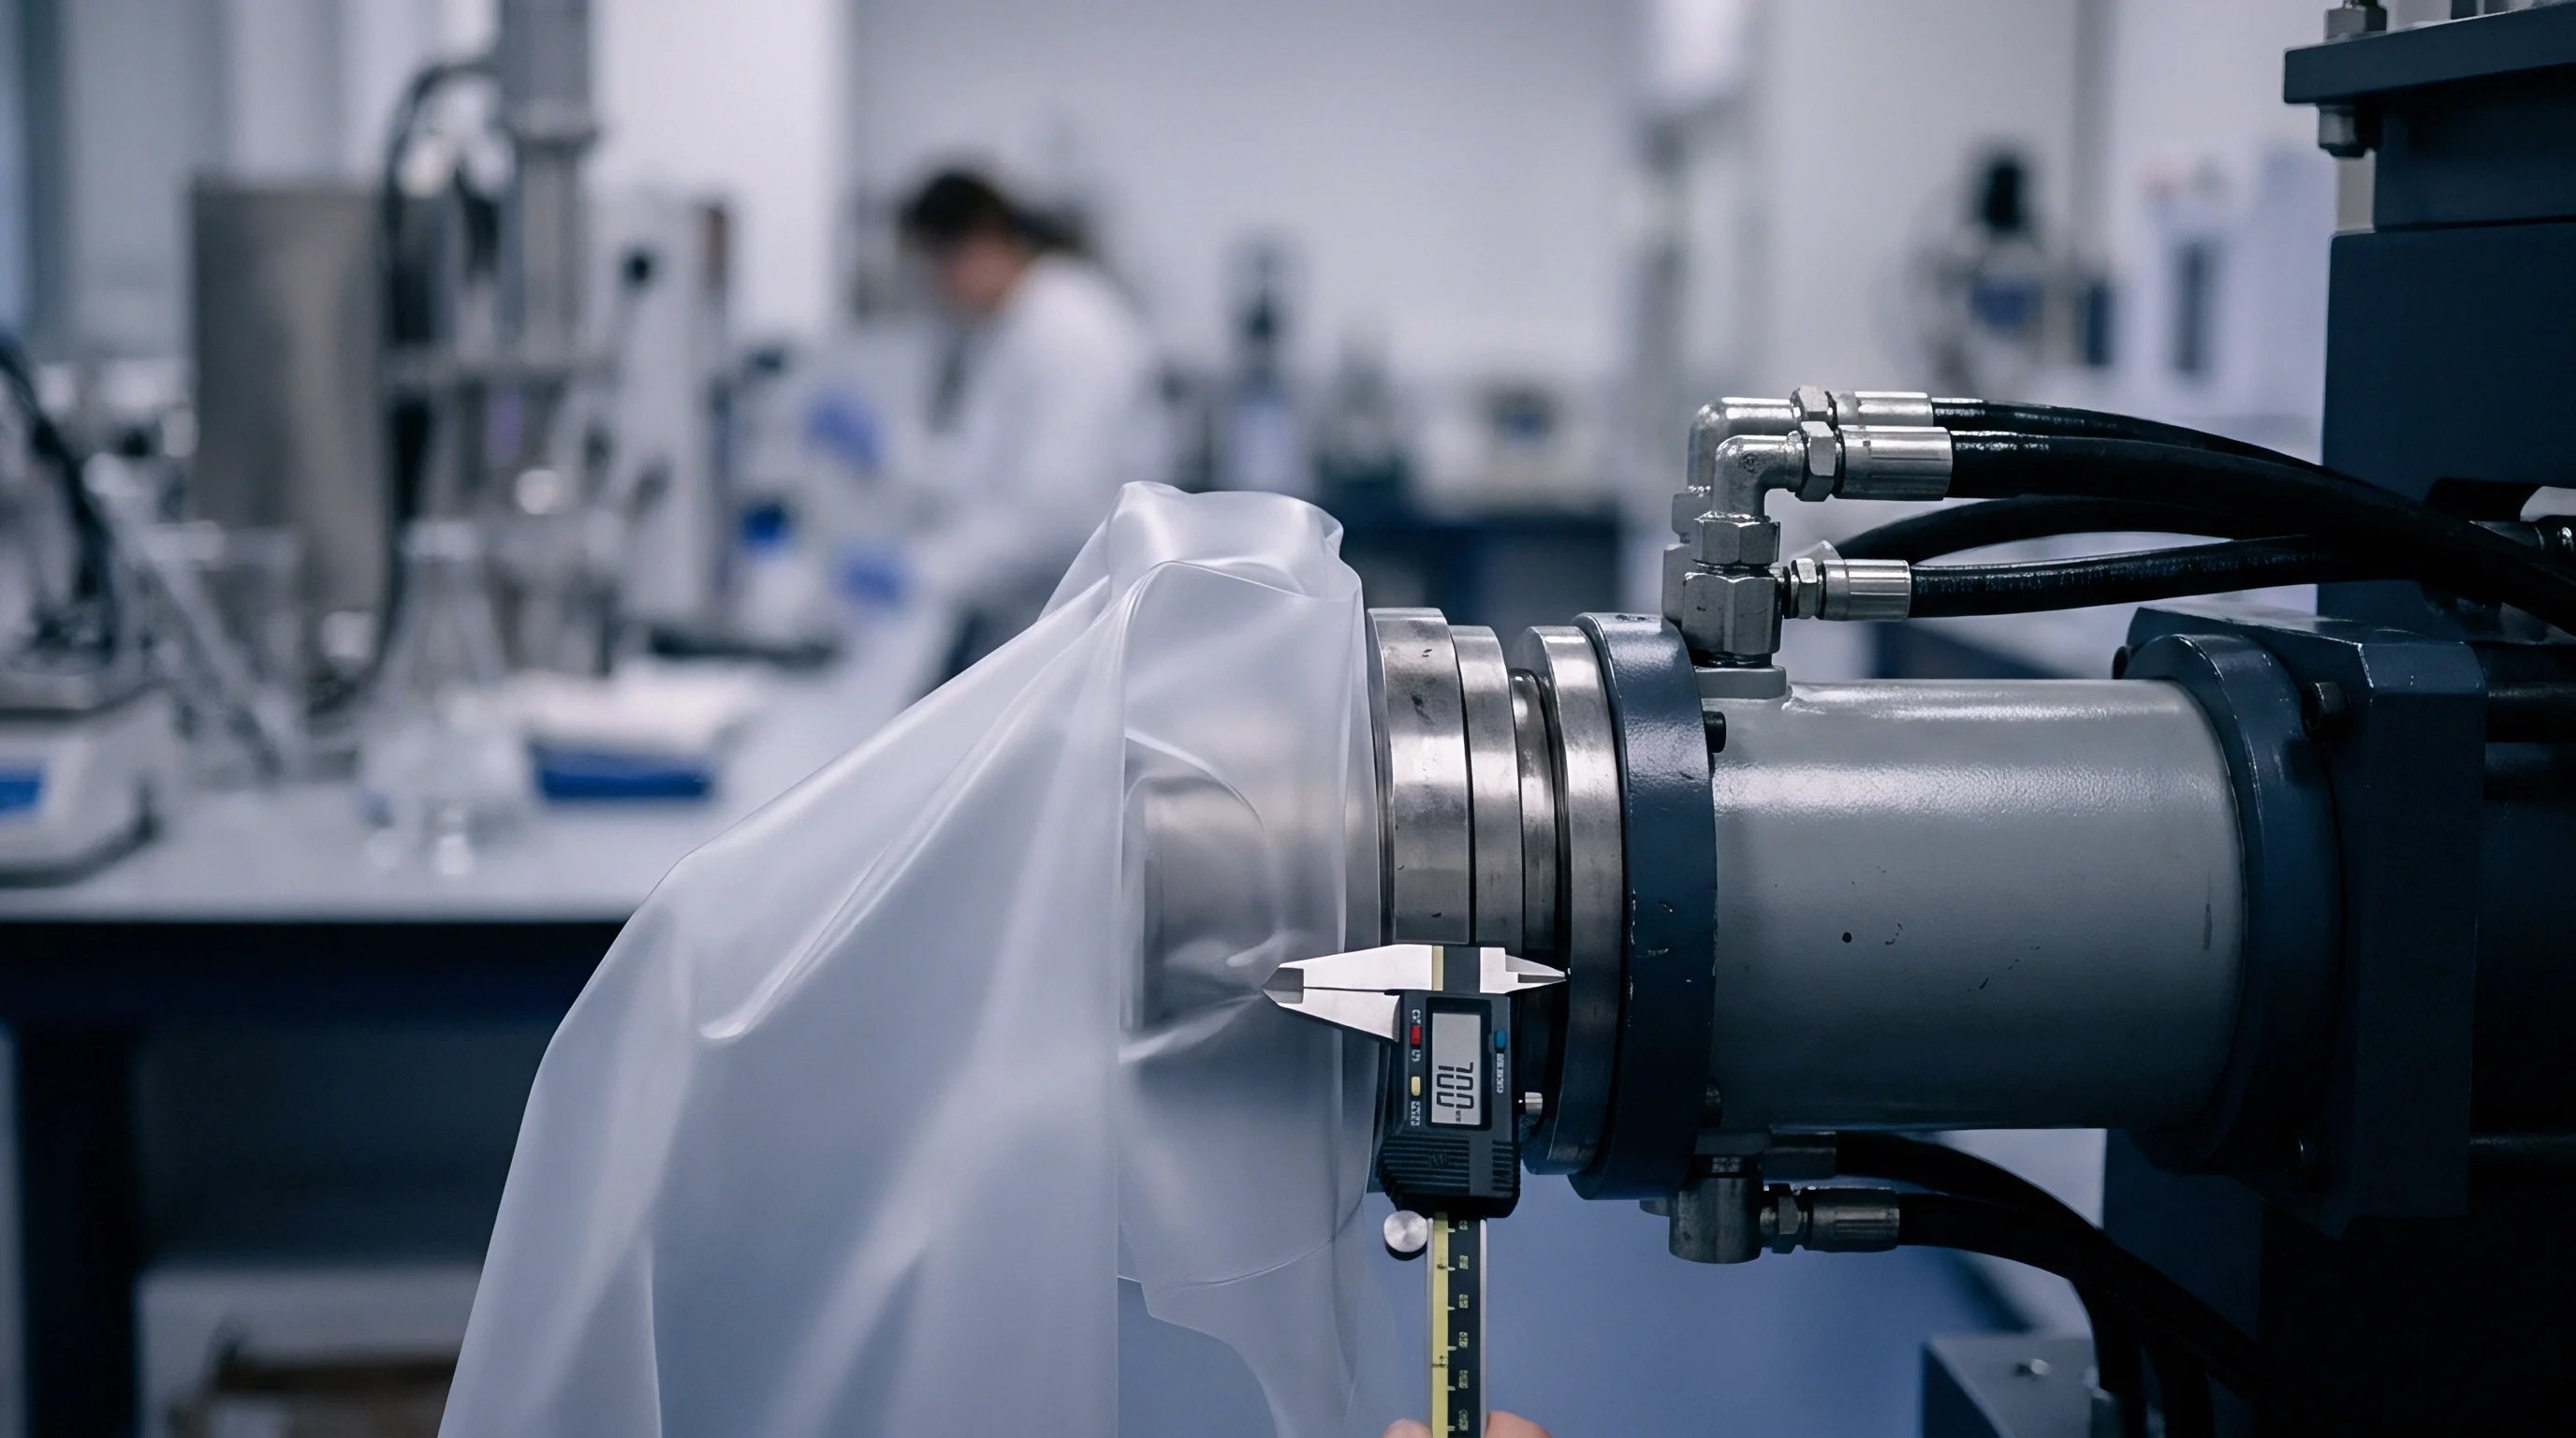
Physical calibration standards establish quantitative truth for incoming inspection instruments. A spectrometer reading post-industrial pellets cannot self-validate; its photometric accuracy, wavelength scale precision, and dynamic range require calibration against traceably qualified reference physical standards. Compounding inspection stations depend on established calibration transfer sets to verify baseline linearity, detector health, and attenuated total reflectance crystal alignment before evaluating delivery samples.

Calibration Transfer Protocols and Physical Artifacts
Photometric scale linearity verification relies on calibrated neutral density filters and precision-cast polyolefin reference films verified via ASTM E1421 testing. Polystyrene reference cards certified under ISO 13818 establish wavelength scale reproducibility to within 0.1 reciprocal centimeter at 3060, 1601, 1028, and 906 reciprocal centimeters. Laser reference lines from internal helium-neon sources verify interferometer timing but do not assess physical beam path misalignment or attenuated total reflectance crystal coating degradation.
Optical crystals suffer surface micro-pitting and abrasion from repeated testing of mineral-filled compounds, altering the effective angle of incidence and shifting baseline heights.
A calibration standard set for post-industrial compound inspection includes reference control coupons pressed from virgin homopolymer base stock, loaded with known quantities of analytical-grade calcium carbonate, synthetic talc, and oxidized low-density polyethylene wax. These reference coupons calibrate Chemometric Partial Least Squares and Principal Component Analysis models. If the transfer standard spectrum displays a baseline drift exceeding 0.02 absorbance units between 2200 and 2000 reciprocal centimeters against its baseline master scan, the instrument crystal requires polishing or optical realignment.
Standard Reference Materials and Method Parameters
Primary calibration matrices must comply with explicit international operational test methods to sustain commercial validity. ISO 10640 outlines baseline management criteria for evaluating degradation states in plastics via infrared spectroscopy. Under ASTM D5576, baseline techniques for polyolefins carrying mineral fillers dictate two-point tangent baseline constructions across explicit operational windows.
Sourcing contracts fail when incoming quality groups utilize arbitrary internal instrument baselines rather than standards-backed calibration methods.
Testing post-industrial polypropylene copolymer lots for total ethylene content demonstrates the operational need for calibrated standard sets. ASTM D5592 governs ethylene determination by infrared spectroscopy, requiring the ratio of the propylene methyl rock at 1167 reciprocal centimeters against ethylene methylene rocking bands at 730 and 720 reciprocal centimeters. A baseline calibrated incorrectly across the 800 to 650 reciprocal centimeter window alters calculated ethylene percentages by up to three percent.
On a 40-tonne lot of high-impact copolymer, an error of this scale disguises a low-grade homopolymer blend substitution that causes rapid part brittleness under sub-zero impact conditions.
A laboratory using an uncalibrated optical crystal yields baseline variations that transform high-impact copolymer into failing homopolymer blends on paper.
Physical reference standards fix instrument performance bounds, allowing the incoming inspection desk to calculate lot acceptance thresholds with repeatable statistical limits.
Tally
Acceptance protocols for post-industrial compounds convert baseline-corrected spectroscopic data into concrete commercial decisions. The sourcing desk operates at the intersection of material mechanics and financial exposure. Compounding facilities routinely deliver lots that diverge from initial pre-shipment qualification samples.
A structured mathematical calculation pipeline resolves whether a material variance warrants immediate shipment rejection, price discounting, or direct compounding correction on the extruder line.

Spectral Deconvolution and Multi-Component Quantification
Quantitative analysis of complex post-industrial compounds relies on resolving multi-peak baselines across shared absorption zones. Classical least squares analysis maps pure component reference spectra against the baseline-corrected incoming spectrum. When analyzing a post-industrial polypropylene stream contaminated with post-industrial linear low-density polyethylene and talc, the system calculates absolute mass fractions by matrix inversion.
Baseline correction across 1200 to 600 reciprocal centimeters must precede deconvolution to prevent baseline energy from skewing regression coefficients.
A worked example demonstrates the mathematical sequence for validating a 20-tonne shipment of recycled polypropylene automotive compound. The purchasing agreement specifies a talc loading of 15.0 mass percent, a maximum high-density polyethylene cross-contamination fraction of 3.0 mass percent, and a maximum Carbonyl Index of 0.15. The laboratory draws ten composite core samples from incoming gaylords under ISO 2859-1 normal inspection level II.
Samples are hot-pressed at 190 degrees Celsius into 180-micrometer films and analyzed on a diamond attenuated total reflectance accessory across 64 co-added scans at 4 reciprocal centimeter resolution.
The processing software applies an airPLS baseline algorithm across the 2000 to 600 reciprocal centimeter region. It calculates the Carbonyl Index by integrating the carbonyl absorption envelope from 1760 to 1690 reciprocal centimeters and dividing that area by the polypropylene reference band integrated from 1480 to 1420 reciprocal centimeters. Polyethylene contamination fraction resolves by evaluating the isolated methylene rocking doublet at 730 and 720 reciprocal centimeters against a multivariate calibration set.
Talc loading derives from the baseline-corrected silicon-oxygen peak height at 1018 reciprocal centimeters using external calibration curves.

Commercial Threshold Actions and Landed Material Valuation
When analytical results exceed technical boundary thresholds, the inspection desk executes defined commercial remedies. A shipment deviating from specification damages manufacturing throughput, causes injection tool flashing, and creates catastrophic field-warranties from mechanical embrittlement. A calculated Carbonyl Index exceeding 0.35 indicates extensive thermal history, reducing room-temperature Izod impact strength from an expected 8.0 kilojoules per square meter down to below 3.5 kilojoules per square meter under ISO 180 testing.
| Spectroscopic Parameter | Calibration Baseline Range (cm⁻¹) | Target Range | Tolerance Limit | Commercial Action on Out-of-Spec |
|---|---|---|---|---|
| Carbonyl Index | 1850 to 1650 / 1480 to 1420 | < 0.15 | 0.25 max | 12 percent price discount or reject |
| PE Cross-Contamination | 760 to 700 / 1167 peak | < 2.5 mass % | 5.0 mass % max | Hold shipment; route to utility blending |
| Talc Filler Loading | 1150 to 900 / 2722 reference | 14.0 to 16.0 mass % | 12.0 to 18.0 mass % | Debit supplier for masterbatch adjustment |
| Moisture / Free Hydroxyl | 3650 to 3100 / baseline anchor | < 0.05 index | 0.10 index max | Mandate extended desiccant drying run |
| Total Optical Baseline Drift | 4000 to 2000 linear fit | < 0.02 Abs | 0.05 Abs max | Invalidate run; clean crystal; re-test |
The financial impact of undetected contamination justifies rigorous baseline protocol enforcement. On a 20-tonne container of polypropylene compound priced at 1,150 euros per tonne, an unverified lot carrying 7 percent polyethylene contamination and a high oxidation index ruins cycle times in automotive molding tools. Molders encounter unexplainable shrinkage variance, part warpage outside tolerance, and severe gate blush.
The landed cost calculation per good part escalates as scrap rates jump from an expected 1.5 percent to over 14 percent.
The formal protocol governs every stage of sample presentation, baseline subtraction, and numerical verification before authorizing offloading into bulk storage silos.


Protocol
Execution of spectroscopic receiving inspection requires unambiguous physical instructions. The compounding inspector, working under continuous receiving schedules, implements a mechanical and computational routine that eliminates ambient variance, contamination, and user bias. The following execution steps establish baseline integrity on all incoming post-industrial lots:
- Crystal Interface Sanitization requires wiping the optical crystal with spectroscopy-grade isopropanol and lint-free optical paper, followed by verifying zero residue under ambient illumination.
- Background Reference Acquisition generates a 64-scan single-beam background spectrum at 4 reciprocal centimeter resolution against ambient atmosphere, confirming water vapor and carbon dioxide band levels remain below established noise bounds.
- Thermal Coupon Consolidation presses five randomly drawn pellets between polyimide release sheets at 195 degrees Celsius for 45 seconds under 3 megapascals of clamping pressure, yielding an optically flat disc free of gas bubbles.
- Interface Coupling Verification positions the pressed film across the crystal center and applies calibrated mechanical torque up to 40 newton-centimeters to eliminate all peripheral air gaps.
- Diagnostic Single-Beam Scan captures sample energy transmission, verifying baseline absorbance values sit strictly between 0.00 and 0.02 absorbance units within the 2200 to 2000 reciprocal centimeter window.
- Algorithmic Baseline Execution applies an asymmetric least squares baseline fit with parameter lambda set at 100,000 to strip non-polymeric slope variations without distorting true chemical peaks.
- Band Integration Execution integrates target degradation and additive profiles against anchored boundary limits to calculate comparative property indices.

Data Preservation and Traceability Chains
Raw interferograms and unprocessed single-beam spectra must be permanently archived alongside the mathematically modified records. Sourcing disputes frequently progress to formal commercial arbitration months after the suspect resin has been molded into commercial goods. If the testing laboratory stores only baseline-subtracted absorbance traces, independent verification remains impossible.
The archiving protocol captures the raw sample interferogram, background single-beam file, preprocessing parameter log, and final property calculation ledger into an unalterable inspection record.
Traceability parameters extend to instrument hardware validation states. The laboratory logs the date of the last optical alignment, crystal replacement records, and helium-neon laser output voltage alongside each inspection batch. A sudden shift in laser frequency alters spectral data point spacing, causing subtle offsets when subtracting standardized background files.
Documented calibration validity confirms that registered baseline anomalies originate from true chemical variations within the post-industrial compound rather than progressive spectrometer degradation.

Are Baseline Protocols Adaptable to In-Line Process Monitoring?
Extrusion compounders increasingly attempt to move baseline verification from bench instruments directly to in-line melt pipe probes. In-line attenuated total reflectance probes and transmission flow cells face hostile environments: melt temperatures exceeding 240 degrees Celsius, pressures over 100 bar, and turbulent polymer flow. Baseline behavior shifts dynamically as the polymer melt density and refractive index vary under pressure fluctuations.
Mechanical shear heating against the probe face creates a thin, highly degraded boundary layer that produces elevated local carbonyl absorption profiles unrepresentative of the bulk melt core.
High-speed in-line sensors mitigate dynamic drift by adopting rapid reference-stepping algorithms. Fast-scanning spectrometers record single-beam references against clean optical diverter paths while applying real-time temperature compensation coefficients to the polymer refractive index models. Despite these algorithmic advances, high mineral filler loadings, agglomerated masterbatch particles, and volatile gas bubbles generate transient optical scattering spikes that overwhelm automated baseline algorithms.
In-line monitoring systems indicate gross process drift, but the bench-scale physical coupon protocol remains the sole legally defensible baseline method for commercial lot acceptance.
A supplier will argue that in-line optical tracking proves lot consistency across compounding runs, even when static bench inspection catches severe baseline distortion from unplasticized regrind fractions.