Understanding Melt Flow Index Measurement Methods for Recycled Polypropylene
Standardized 230°C conditions, melt density corrections, and dual-load shear ratio tracking isolate degradation and contamination in recycled polypropylene resin.


Rheology
Mass flow rates through standard capillary orifices provide the baseline metric for polymer melt behavior in commercial compounding. Melt flow index measurements quantify the extrusion mass of a molten polyolefin through a standardized die under fixed temperature and load conditions. For recycled polypropylene, this measurement acts as an initial indicator of molecular weight, structural integrity, and processability.
Rheological behavior in re-processed polypropylene reflects the structural changes induced by thermal and mechanical degradation during previous service lives and re-extrusion cycles.

Standard Load Conditions for Recycled Polypropylene
Capillary extrudate mass measured per ten minutes under ISO 1133 Condition M at 230 degrees Celsius with a 2.16 kilogram weight forms the universal baseline for polyolefin grading. ASTM D1238 Condition 230/2.16 mirrors this operational standard, serving as the primary benchmark on material technical datasheets. Virgin polypropylene homopolymers typically exhibit narrow melt flow distributions matched to specific forming processes.
Injection molding grades range from 10 to 100 grams per ten minutes. Extrusion blow molding resins maintain lower indices, ranging from 0.5 to 2.0 grams per ten minutes. High-fraction recycled streams frequently deviate from these clean targets.
Thermal degradation during re-processing cleaves long polymer backbones. Tertiary carbon atoms along the polypropylene chain are vulnerable to radical attack driven by heat and shear. Microscopic chain scission shortens average polymer lengths, accelerating flow through the die under load.
Consequently, a recycled lot derived from a nominal 12 MFR virgin injection molding grade often yields values of 20 to 35 MFR after multiple heat cycles. Sourcing practices must account for this upward index drift when specifying post-consumer compounds.
| Test Standard | Nominal Temperature (°C) | Applied Load (kg) | Primary Shear Rate Range (s⁻¹) | Recyclate Sensitivity |
|---|---|---|---|---|
| ISO 1133-1 Condition M | 230 | 2.16 | 1 to 10 | High sensitivity to low molecular weight fractions. |
| ASTM D1238 Condition 230/2.16 | 230 | 2.16 | 1 to 10 | Standard commercial benchmark; masks non-Newtonian shear thinning. |
| ISO 1133-1 Condition V | 230 | 5.00 | 5 to 50 | Exhibits improved signal-to-noise ratio for low flow fractional components. |
| ASTM D1238 Condition 230/10.0 | 230 | 10.00 | 10 to 100 | Captures high shear rate behavior in highly filled compounds. |
Testing single loads fails to reveal shifts in molecular weight distribution. Two recycled polypropylene lots displaying an identical 12 MFR under a 2.16 kilogram weight can process differently inside an injection mold. One lot may retain a broad molecular weight distribution with residual long chains.
The second lot may feature a narrow, degraded distribution caused by peroxide treatment during re-compounding. Broad distributions demonstrate pronounced shear thinning at commercial processing shear rates, while narrow degraded distributions maintain near-Newtonian viscosity curves under high shear. Measuring flow ratios across dual loads isolates these structural differences.
Polypropylene melt tested at 230 degrees Celsius under a 2.16 kilogram load exhibits an inverse exponential relationship between melt flow rate and zero-shear viscosity across molecular weights from 150,000 to 450,000 grams per mole.
Dual-load verification measures extrudate output under both 2.16 kilogram and 5.0 kilogram weights. Comparing the higher mass flow against the baseline load yields the Flow Rate Ratio. Uncontaminated virgin homopolymers maintain predictable flow ratios between 2.8 and 3.2.
Recycled streams exhibiting high polydispersity or cross-linked polyethylene contaminants push flow ratios above 4.5. Low flow ratios below 2.5 point to aggressive peroxide visbreaking, where chemical additives intentionally clip long polymer chains to flatten the viscosity profile.
Higher melt flow numbers signal shorter polymer backbones and lower melt strength during blow molding or sheet extrusion.


Piston
Vertical force transmission through the heated barrel assembly determines the accuracy of melt volume rate data. Instrumental tolerances defined in ISO 1133 and ASTM D1238 specify a cylinder bore inner diameter of 9.550 millimeters with a tolerance of plus or minus 0.007 millimeters. The hardened steel land on the pressure foot measures 9.474 millimeters in diameter.
This precise mechanical clearance prevents molten polymer from back-flowing upward around the shaft while allowing unhindered vertical travel down the barrel wall. Wear on these mechanical surfaces distorts velocity measurements.

Automated Volumetric Displacement versus Manual Cut Weight
Optical encoder systems track the descent of the load shaft to calculate melt volume rate across designated displacement intervals. Gravimetric testing, historically designated as Method A, relies on timed mechanical cuts of the extrudate strand exiting the capillary die. The timed strand cuts are cooled, weighed on an analytical balance, and normalized to ten-minute mass outputs.
Automated optical displacement, designated as Method B, tracks volume displacement per unit time. Multiplying the volumetric rate by the melt density of polypropylene at 230 degrees Celsius produces the mass melt flow rate.
Density values shift significantly in recycled compounds containing mineral fillers or phase contaminants. Virgin polypropylene melt density at 230 degrees Celsius equals 0.738 grams per cubic centimeter. A recycled compound containing 20 percent talc by weight increases melt density to 0.865 grams per cubic centimeter.
Inputting the default virgin density into a Method B volumetric calculation yields a false mass flow value. Accurate gravimetric calibration requires direct mass measurement of extrudate strands or experimental determination of the compound melt density at test temperatures.
- Barrel Air Entrapment Void formation in the melted charge causes premature encoder triggering, driving artificially elevated flow rate readouts.
- Die Deposit Accumulation Degraded polymer char along the capillary exit wall restricts orifice clearance and depresses measured flow values.
- Preheat Duration Drift Thermal exposure below six minutes leaves un-melted crystalline domains, whereas heating beyond ten minutes accelerates chain scission in un-stabilized recyclate.
- Packing Force Inconsistency Variable manual tamping of fluffy regrind flake creates localized density gradients inside the heating chamber.
Proper sample preparation prevents instrument fouling and measurement distortion. Flake feedstocks derived from post-consumer rigid packaging present low bulk density. Tamping the barrel requires consistent volumetric charges to expel air pockets between irregular flakes.
Trapped air pockets act as compressible gas cushions during preheating. When the load weight settles onto the charge, sudden collapse of air voids produces artificial velocity spikes on automated displacement sensors.
ISO 1133-2 Annex A specifies that moisture sensitive polyolefin re-compounds undergo forced air desiccation below 0.02 percent mass moisture before barrel loading.
Thermal stability during the standard preheat phase dictates data reliability. Standard test protocol mandates a five-minute to six-minute thermal equilibration window after charging pellets or flake into the barrel. Un-stabilized post-consumer polypropylene lacking adequate secondary antioxidants undergoes auto-oxidation inside the enclosed cylinder during this preheat window.
Polymer chains undergo scission before the test stroke begins. The measured flow rate continuously accelerates throughout the measurement zone, rendering the resulting dataset invalid for grade certification.
Compounding facilities frequently claim that higher flow rate values stem entirely from lot moisture rather than severe thermal chain scission.


Variance
Heterogeneity in post-consumer feedstock streams introduces unpredictable fluctuations in melt flow indices across successive compounding lots. Post-industrial recycled polypropylene sourced from clean factory scrap maintains consistent melt flow values within plus or minus 10 percent of nominal targets. Post-consumer recycled streams derived from mixed material recovery facilities exhibit batch-to-batch variations exceeding 40 percent.
This wider spread originates from mixed packaging geometries, varying original virgin grades, and residual polyolefin contaminants.

Why Does Polyethylene Contamination Distort Melt Index Values?
Linear low-density polyolefin fractions present within recycled polypropylene post-consumer bales alter the phase morphology and shear behavior during capillary flow. High-density polyethylene and polypropylene form immiscible blends characterized by droplet-matrix or co-continuous phase structures. Polyethylene exhibits higher shear sensitivity and a lower melting transition at 130 degrees Celsius.
At the standard 230 degree Celsius test temperature, the molten polyethylene phase acts as a internal lubricant, accelerating flow through the capillary die at low applied loads.
| Contaminant Type | Concentration Range (% mass) | Observed MFR Shift | Viscosity Ratio Change (Eta/Eta_0) | Dominant Physical Mechanism |
|---|---|---|---|---|
| LLDPE Co-Fraction | 2.0 to 10.0 | Non-linear increase (+15% to +45%) | Depressed low-shear viscosity | Phase separation and inter-phase slipping. |
| HDPE Fraction | 3.0 to 15.0 | Moderate increase (+10% to +25%) | Shifted relaxation spectrum | Immiscible domain droplet elongation in die. |
| Talc Mineral Filler | 5.0 to 40.0 | Linear decrease (-20% to -65%) | Elevated yield stress and zero-shear viscosity | Particle packing and hydrodynamic volume restriction. |
| Peroxide Residue | 0.01 to 0.05 | Severe exponential increase (+50% to +300%) | Broad spectrum viscosity collapse | Controlled radical chain scission of backbone. |
Phase-separated blends yield deceptive flow indices. Small fractions of high-density polyethylene expand the low-shear flow rate while reducing melt strength during processing. Standard single-point melt flow index tests fail to register phase separation.
A compounder selling recycled polypropylene containing 8 percent polyethylene contamination may report a compliant 15 MFR datasheet value. When processed on a commercial line, the material exhibits low melt strength, severe wall slip, and gate blushing in finished injection-molded components.

Molecular Weight Degradation and Thermal History
Repeated extrusion cycles cleave the tertiary carbon atoms along the polymer backbone, systematically altering the molecular mass distribution. High-molecular-weight chains contribute disproportionately to melt strength and zero-shear viscosity. As thermal mechanical stress clips these long chains into shorter fragments, the high-molecular-weight tail of the distribution collapses.
The weight-average molecular weight drops, and the polydispersity index narrows unless broad-fraction post-consumer regrind is introduced.
- Heat five grams of incoming pellets inside a differential scanning calorimeter to 200 degrees Celsius at ten degrees per minute to isolate thermal transitions.
- Measure the endothermic peak area around 125 degrees Celsius to quantify high-density polyethylene cross-contamination within the matrix.
- Perform a dual-load capillary test at 230 degrees Celsius under 2.16 kilograms and 5.0 kilograms to determine the flow rate ratio.
- Compare the resulting flow rate ratio against baseline virgin homopolymer curves to detect cross-linking or radical visbreaking treatment.
Controlling this variance requires rigorous incoming feedstock sorting and chemical re-stabilization during compounding. Re-compounders introduce organic peroxides, such as 2,5-dimethyl-2,5-di(tert-butylperoxy)hexane, to intentionally degrade high molecular weight fractions in a process called visbreaking. Visbreaking tightens the melt flow index spread across variable post-consumer feedstocks.
It converts variable, high-viscosity recycled streams into predictable, high-flow injection molding compounds. Visbreaking sacrifices impact strength because the shortened chains reduce inter-crystallite tie-molecule density.
Mismatched flow indices lead to uneven mold filling, excessive part shrinkage, and catastrophic structural failure under cyclic mechanical load.

Die
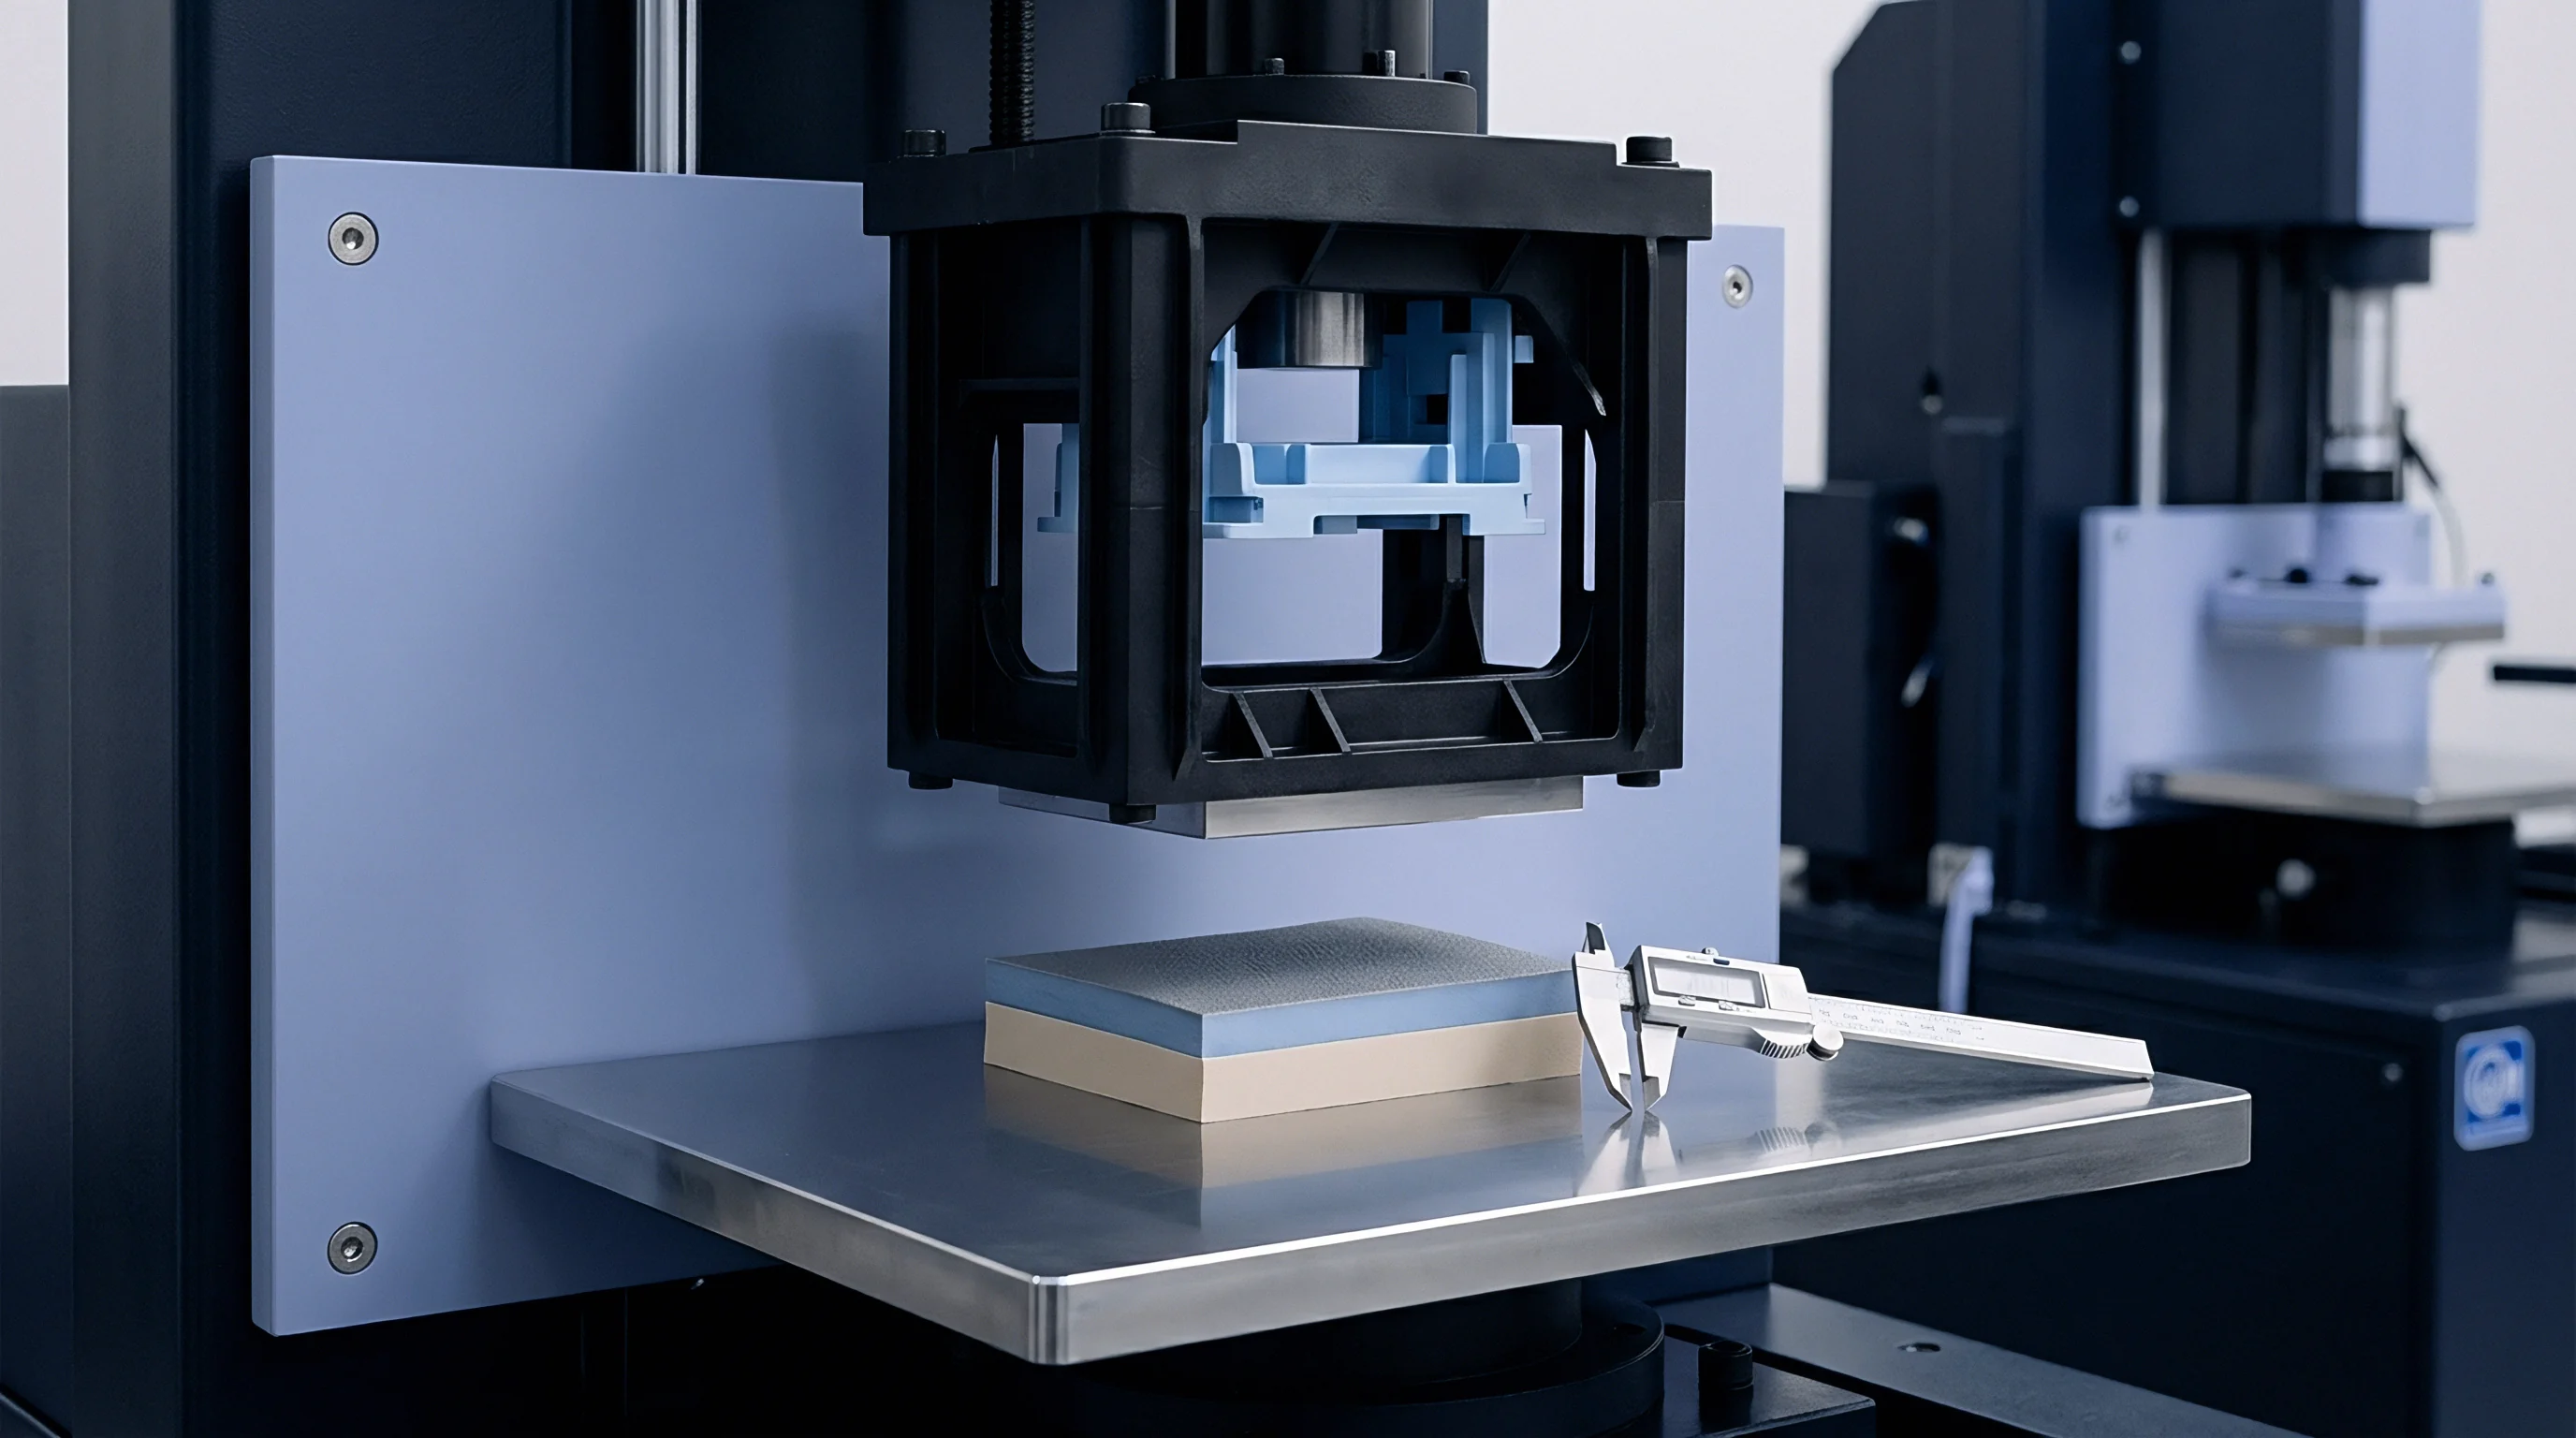
Capillary dimensions of 2.095 millimeters in diameter and 8.000 millimeters in length form the standard geometric constriction for melt testing. This standard die yields an length-to-diameter ratio of 3.82. The short capillary length introduces significant entrance and exit pressure losses that alter the local velocity gradient inside the die.
Newtonian fluid calculations assume fully developed laminar flow across the entire capillary length. Molten polymers are non-Newtonian, viscoelastic fluids that store elastic energy when compressed into the narrow entry funnel of the die orifice.

Entrance Geometry and Velocity Profile Inaccuracies
Viscoelastic fluids experience intense extensional flow at the converging funnel leading into the tungsten carbide capillary channel. Polymer chains align rapidly in response to acceleration, storing elastic energy. A portion of the total pressure drop across the test instrument overcomes this entrance resistance rather than driving steady shear flow along the die land.
In short capillary dies used for melt index bench instruments, entrance pressure drops account for 10 to 30 percent of the total applied force. Standard melt index figures omit corrections for this entrance effect.
Correction methods applied in analytical capillary rheology illustrate the magnitude of this measurement distortion. The Bagley correction requires testing the polymer melt through dies of identical diameter but varying lengths, typically length-to-diameter ratios of 5, 10, 20, and 30. Extrapolating the total pressure drop to a hypothetical zero die length reveals the entrance pressure loss.
Standard benchtop melt flow indexers operate with a single short die, preventing empirical Bagley corrections during routine quality control operations. Quoted melt index figures incorporate uncorrected end-effect errors.
Non-Newtonian velocity profiles introduce further error when calculating true shear rates at the capillary wall. Standard volumetric rate calculations assume a parabolic velocity distribution across the die radius. Polypropylene melt exhibits pronounced shear-thinning behavior.
The fluid velocity profile flattens in the center of the die channel, creating a plug flow region surrounded by high shear gradients near the tungsten carbide wall. True wall shear rates exceed parabolic assumptions by factors ranging from 1.2 to 1.8, depending on the shear-thinning exponent of the polymer compound.
Calculating wall shear stress and shear rate requires adjusting for non-Newtonian velocity profiles via the Weissenberg-Rabinowitsch correction. The wall shear rate formula incorporates the derivative of the log mass flow rate against the log wall shear stress:
Shear Rate (True) = ((3 n + 1) / (4 n)) ((4 Volumetric Flow Rate) / (pi Radius^3))
Where n represents the non-Newtonian flow behavior index. Virgin homopolymer polypropylene exhibits an n value of approximately 0.35 under processing shear rates. Highly degraded post-consumer polypropylene shifts toward an n value of 0.55 as chain scission eliminates long-chain entanglements.
Standard melt index apparatuses apply a fixed conversion factor, ignoring changes in the non-Newtonian flow behavior index between virgin and recycled lots.
Extrudate swell expands when long polymer chains maintain elastic memory, whereas degraded recycled backbones exit the orifice with minimal expansion.
Die swell measurement provides critical insight into the elastic recovery of recycled melts. As the polymer exits the 2.095 millimeter die, stored elastic strain relaxes, causing the extrudate strand diameter to swell beyond the orifice dimension. Swell ratios for virgin polypropylene homopolymers range from 1.3 to 1.7.
Recycled polypropylene subjected to severe thermal degradation demonstrates reduced extrudate swell, often dropping below 1.15. The loss of high-molecular-weight entanglements weakens the elastic response of the melt upon pressure release.
Determining whether die swell suppression in recycled compounds originates from filler orientation or low molecular weight fractions remains an active challenge for rheological modeling.


Qualification
Receiving inspection procedures for post-consumer resin containers prevent batch contamination before raw material enters production hoppers. Sourcing recycled polypropylene requires incoming verification routines that extend beyond vendor datasheets. Datasheet values reported by re-compounders often reflect idealized laboratory samples rather than composite averages across multi-tonne shipping lots.
Incoming qualification protocols establish baseline acceptable criteria for melt flow rate, melt density, moisture content, and inorganic contaminant fractions.

Verification Steps for Incoming Recyclate Lots
Composite sampling across twenty-five distinct bulk bags yields a representative specimen for melt flow index assessment. Standard sampling methodology uses a multi-zone thief sampler inserted diagonally into each box or bag to collect material across depth profiles. Combining individual samples creates a composite lot sample.
Testing five discrete sub-samples from this composite pool identifies intra-lot variance. High standard deviations across sub-samples signal poor compounding homogenization or improper mixing of post-consumer flake lots prior to pelletization.
- Melt Flow Rate Tolerance Window Acceptable shipment batches remain within plus or minus fifteen percent of the nominal specification datasheet value.
- Melt Density Calibration Measured extrudate density at 230 degrees Celsius determines volumetric displacement calculations for filled grades.
- Thermal Stability Index Continuous twenty-minute residence time testing reveals whether antioxidant additives prevent thermal degradation during processing.
- Ash Content Determination Calcination at 600 degrees Celsius separates organic polymer mass from inorganic mineral reinforcement fractions.
Thermal stability qualification measures melt flow rate changes as a function of barrel residence time. Standard melt testing uses a six-minute preheat duration. Extended residence testing holds the molten charge inside the cylinder for twenty minutes at 230 degrees Celsius before extruding the strand.
Stable recycled compounds containing appropriate Hindered Phenol and Phosphite antioxidant packages exhibit less than a 5 percent increase in melt flow rate after extended heating. Un-stabilized compounds exhibit melt flow jumps exceeding 50 percent, indicating rapid oxidative degradation during residence pauses in production equipment.
Ash content analysis complements melt index verification for filled recycled compounds. Mineral fillers such as talc, calcium carbonate, and glass fibers increase compound density while retarding melt flow through physical hydrodynamic drag. A 20 MFR specified compound may arrive at 12 MFR because the compounder over-dosed talc by 5 percent mass fraction.
Thermogravimetric calcination isolates mineral content by burning off the organic polymer matrix at 600 degrees Celsius in an oxidizing atmosphere. Cross-referencing ash percentage against melt flow values pinpoints whether flow restriction stems from filler loading or polymer matrix viscosity shifts.
Inserting ISO 1133-2 Compliance Clause 4.3 into resin supply agreements empowers buyers to reject lots exhibiting melt flow variation exceeding ten percent across container samples.


Settlement
Commercial valuation of recycled polypropylene lots relies heavily on melt index predictability to prevent costly cycle time extensions. Mismatched melt flow indices directly impact part conversion economics during injection molding and extrusion. When an incoming resin lot exhibits a higher melt flow rate than specified, melt viscosity inside the machine barrel drops.
Lower viscosity leads to flash formation along mold parting lines, requiring manual deflashing labor or causing part rejects. Conversely, lower melt flow rates increase melt viscosity, driving up injection pressure requirements and risking incomplete mold cavity filling.

Commercial Penalties and Mold Tooling Adjustments
Fluctuations in polymer flow rates alter injection pressure requirements, forcing operators to adjust clamping forces and cooling profiles. Lower viscosity melt requires less filling pressure but demands longer cooling cycles if low molecular weight content delays crystallization. Higher viscosity melt demands higher hydraulic injection pressures, elevating energy consumption per cycle and increasing shear heating within hot runner systems.
These operational adjustments directly alter landed part costs.
| Nominal MFR Target | Delivered Lot MFR | Cycle Time Variance (s) | Part Scrap Rate (%) | Cost Impact per 10,000 Units ($ USD) |
|---|---|---|---|---|
| 12.0 (Homopolymer) | 12.0 (Compliant Lot) | 0.0 (Baseline 28.0 s) | 0.5 | Baseline cost structure |
| 12.0 (Homopolymer) | 18.5 (Degraded Lot) | +2.5 (Cooling delay) | 4.2 | +$480.00 (Flash and warp rejects) |
| 12.0 (Homopolymer) | 7.2 (Under-visbroken) | +4.0 (Fill/pack delay) | 6.8 | +$920.00 (Short shots and sink marks) |
| 12.0 (Homopolymer) | 24.0 (Contaminated PE) | +5.5 (Phase crystallization) | 11.5 | +$1,850.00 (Delamination and part failure) |
Quantifying financial exposure involves mapping melt index drift to part scrap rates and machine hourly costs. A standard 350-tonne injection molding press operates at an average rate of $85.00 per hour. An unpredicted shift from a nominal 12 MFR to an 18.5 MFR lot extends cycle time by 2.5 seconds per shot on a 28-second baseline cycle to accommodate thermal dissipation from low molecular weight species.
Across a 100,000-unit production run using a four-cavity tool, this cycle extension adds 17.3 machine hours, incurring an immediate direct cost penalty of $1,470.50 in machine time alone.
Scrap rate increases compound these direct machine losses. Degraded low molecular weight chains reduce impact performance and induce part warping due to anisotropic differential shrinkage. A scrap rate increase from 0.5 percent to 4.2 percent on a 100,000-unit order wastes 3,700 parts.
With a unit material cost of $0.65 per molded part, material loss adds $2,405.00 to total job expenses. Combined with machine downtime and sorting labor, total failure costs rapidly exceed the purchase savings gained when buying un-certified recycled resin lots.
Uncontrolled melt index variations alter cavity pressure distribution during injection molding, inducing flash or short shots across automated production runs.
Purchase contracts must incorporate price adjustment schedules tied to melt flow index compliance bands. Sourcing practices mitigate financial risk by establishing clear commercial deducts for delivered lots operating outside tightly defined target windows. A common commercial clause applies a 3 percent price discount for resin batches landing between 15 and 25 percent above specified flow targets, compensating for cycle time extensions.
Batches exceeding 25 percent variance earn outright lot rejection at vendor expense, including freight and silo handling costs.
Financial losses mounting from part rejects and machine downtime quickly surpass the modest price discount offered on un-certified post-consumer resin lots.