Surface Texture Measurement Limits in Precision Micro Injection Moulding
Micro injection texture measurement limits depend on polymer translucency, stylus deformation, and short spatial cutoffs that require strict ISO 25178 callouts.

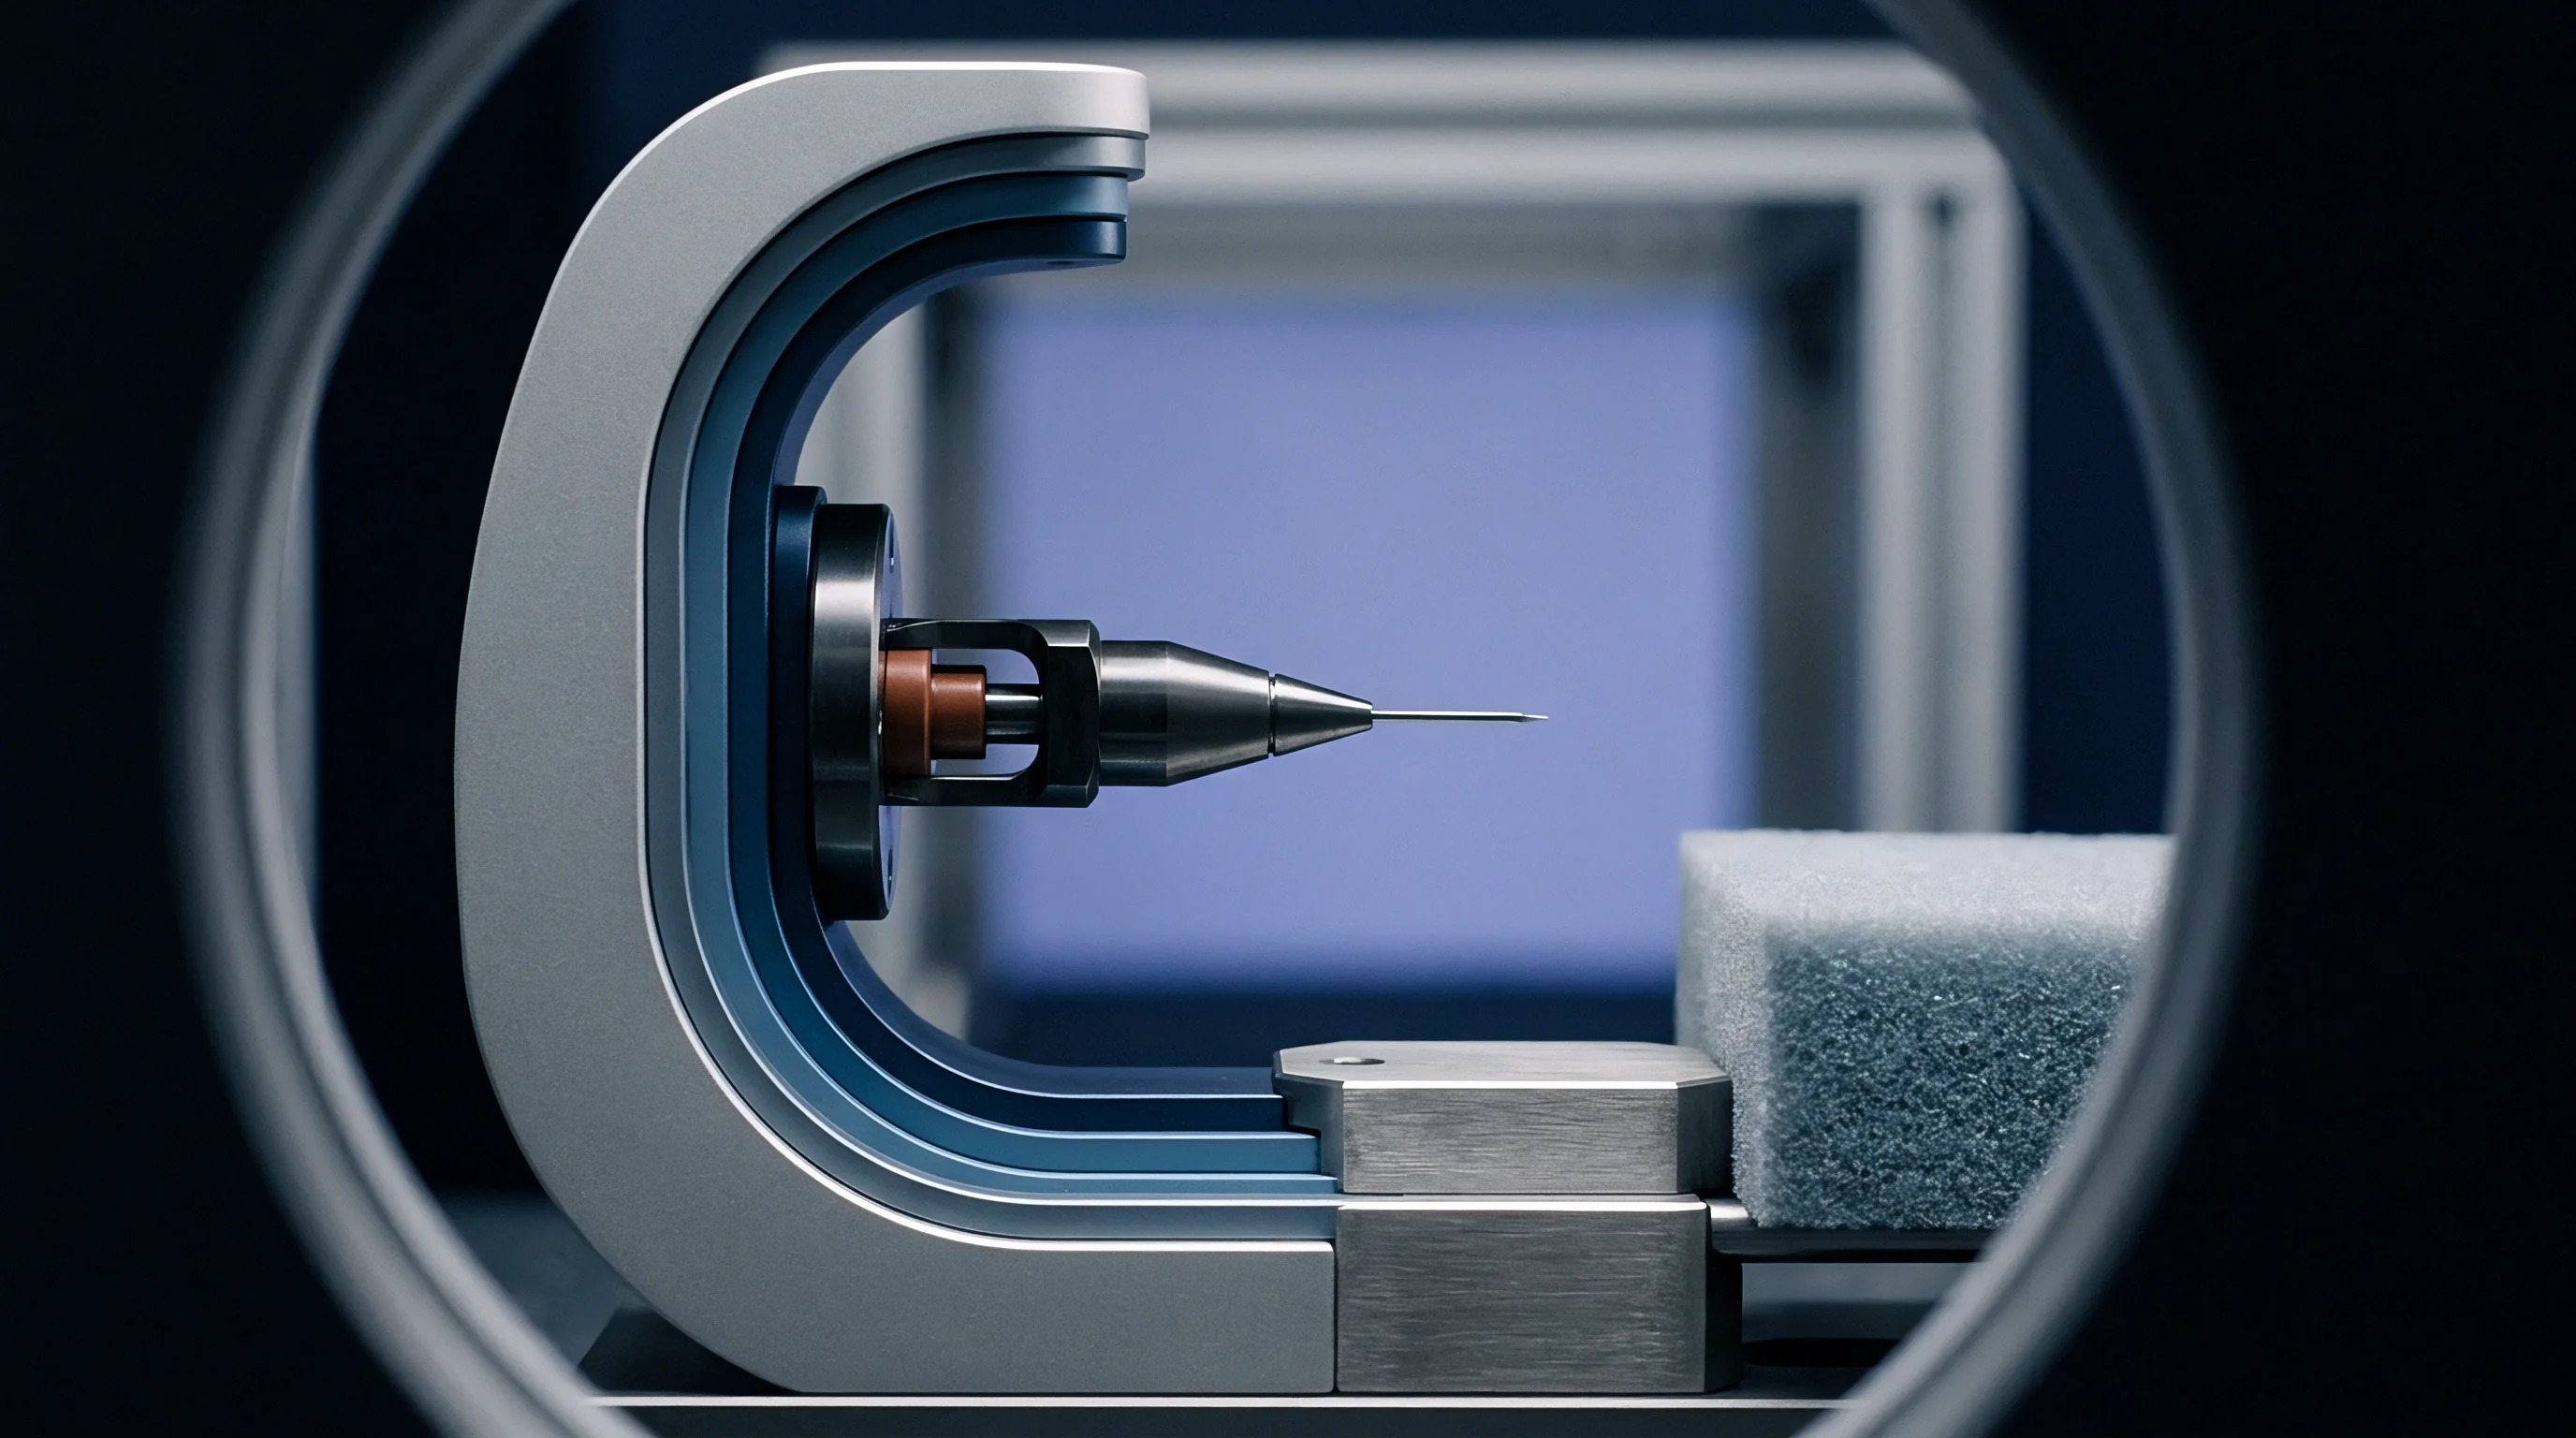
Grit
Physical diamond tips trailing across micro-moulded features face structural constraints imposed by mechanics and geometry. Contact instruments exert high local stress right at the interface, often exceeding the elastic limit of micro-moulded thermoplastic channels, micro-fluidic substrates, or diffractive optical ribs.
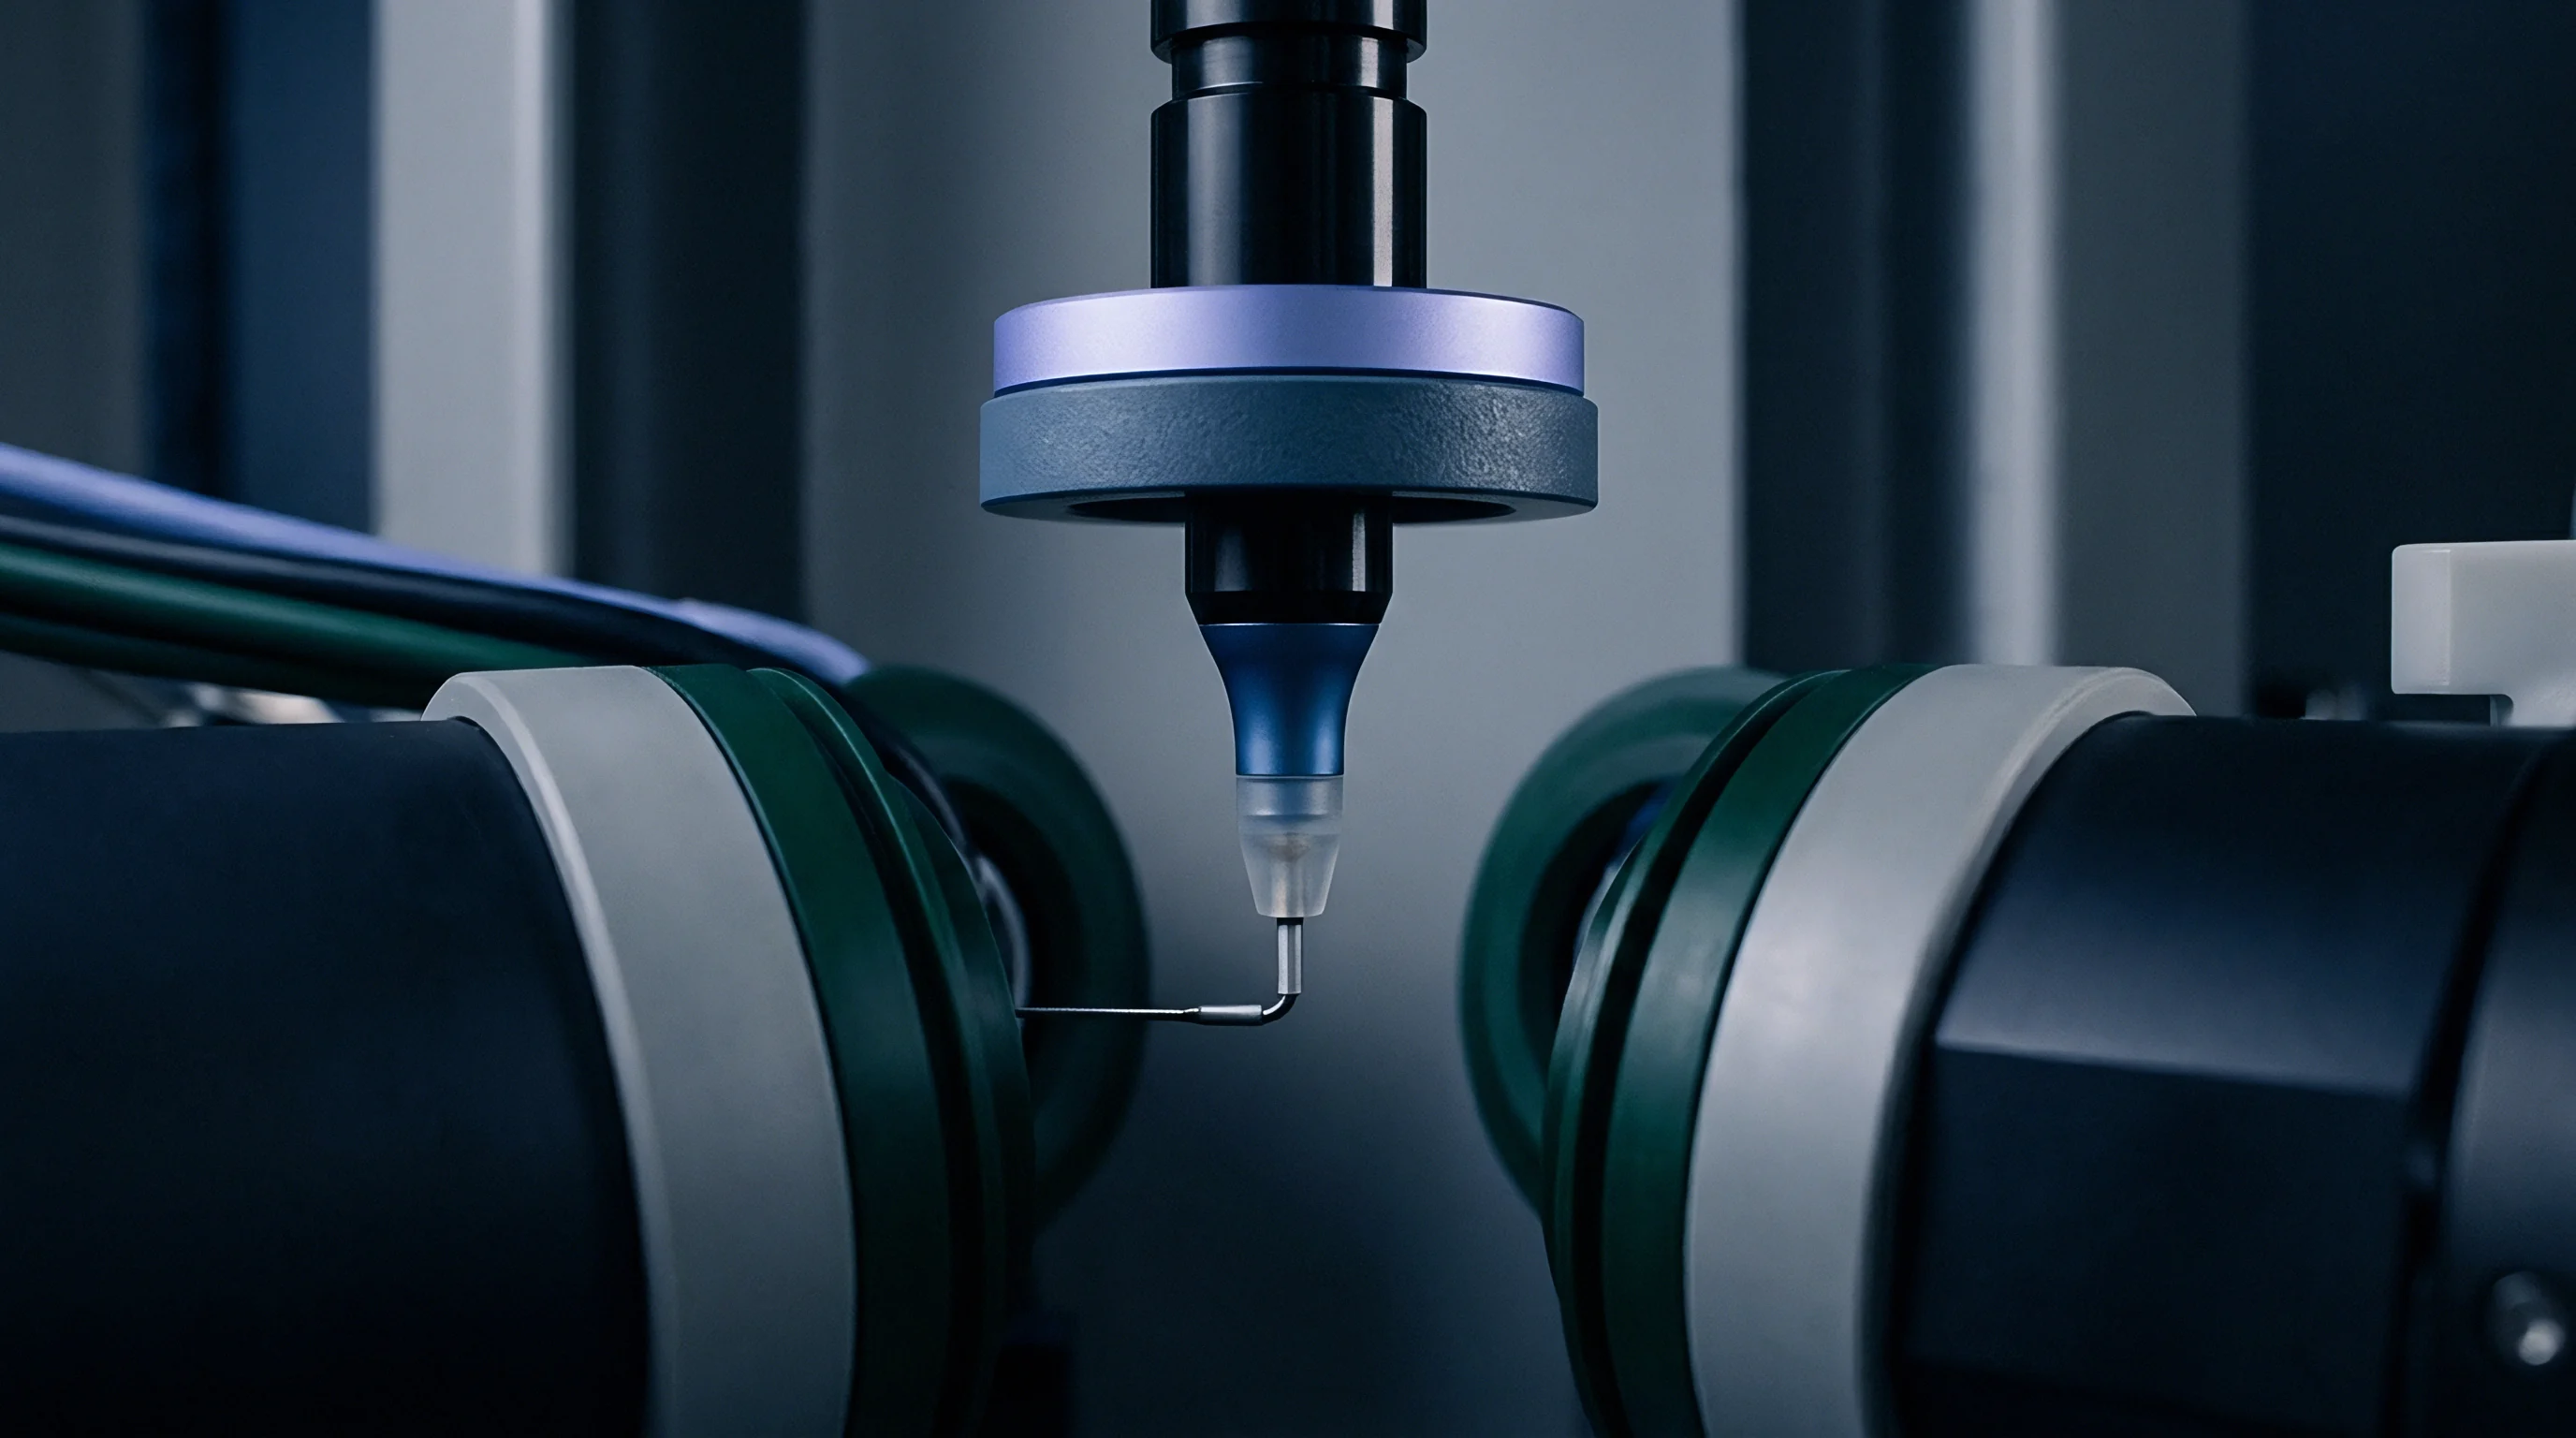
Stylus Mechanics on Soft Micro Surfaces
Contact forces down to 0.75 millinewtons exert substantial local pressure on low-modulus polymers. Polypropylene, flexible polyurethane, and thermoplastic elastomers yield plastically under a standard two-micrometre diamond tip, which plows through high-frequency roughness peaks during measurement to leave an artificially smooth trace.
Hertzian contact stress calculations for a spherical tip on flat polymer highlight the scale of this deformation. A two-micrometre tip radius carrying a static load of 0.75 millinewtons generates peak contact stresses above 45 megapascals on polymethyl methacrylate. On softer polymers like micro-moulded high-density polyethylene with a flexural modulus of 1.1 gigapascals, penetration depth reaches 120 nanometres ~ meaning the instrument logs its own penetration path rather than the pristine tool replication profile.
Measuring a 1.1 gigapascal polyethylene micro-part with a 0.75 millinewton load causes a 120 nanometre stylus penetration depth that truncates measured peak heights.
Dropping the static force to 0.05 millinewtons limits penetration but introduces tracking problems. At higher traverse speeds across steep micro-features, low contact force allows the stylus tip to bounce off sample slopes steeper than 15 degrees, leaving artificial air gaps and false valleys in the trace.

Tip Radius Truncation Effects
Sub-micron asperities disappear when the physical probe radius exceeds the spatial frequency of the surface feature. A standard five-micrometre or two-micrometre stylus tip cannot drop into micro-cavity grooves narrower than its own radius.
- Tip Geometry Verification confirms the actual tip radius under an optical comparator or electron microscope to establish the spatial cutoff boundary prior to data collection.
- Load Calibration Check verifies static stylus force using an electronic micro-balance, ensuring contact force remains below 0.10 millinewtons for soft polymers.
- Speed Profile Setting restricts drive unit speed below 0.1 millimetres per second to prevent stylus levitation on steep micro-structure sidewalls.
- Baseline Zeroing establishes profile levelling across flat reference datum surfaces before capturing texture parameters across micro-cavity arrays.
When the stylus radius is larger than the valley radius, the tip bridges the floor. The recorded Ra drops below true surface roughness while peak height Rp remains unchanged. This selective filtering skews skewness (Rsk) positive, painting an inaccurate picture of a peak-dominated surface.
Micro-injection mouldings built for liquid sealing or friction control can easily fail in the field after passing standard stylus inspection.
Running stylus profilometers near physical resolution limits accelerates tip wear. High-speed runs over abrasive ceramic- or glass-filled polymer parts flatten the diamond tip across repeated cycles. A stylus worn from two micrometres to four micrometres attenuates high-frequency roughness data by more than 35 percent, drifting out of calibration without raising any error code.
Continuous stylus operation across glass-filled micro-mouldings degrades probe tip accuracy within a single production shift.


Optics
Non-contact surface profiling bypasses mechanical deformation on soft polymers, but brings its own optical limits. Coherence scanning interferometry, focus variation, and laser confocal microscopy capture topography without touching the part, yet light interaction with transparent micro-moulded polymers introduces distinct errors.
Translucency and Subsurface Scattering
Transparent and semi-crystalline polymers allow light to pass beyond the physical surface. Micro-injected lenses, micro-fluidic chips, and light guides moulded from polycarbonate, cyclic olefin copolymer, or polymethyl methacrylate let incoming illumination enter the bulk layer. Internal material interfaces, stress birefringence, and micro-voids then reflect light straight back into the objective lens.
Coherence scanning interferometry relies on pinpointing peak fringe contrast. When light reflects from both the top surface and internal features, multiple fringe envelopes overlap and the interferometer calculates false height peaks, producing noise spikes that inflate the areal roughness parameter Sa by 40 to 300 percent. Focus variation instruments face similar issues in semi-crystalline resins like polyoxymethylene or polybutylene terephthalate, where internal crystalline spherulites scatter light unpredictably.
| Polymer Family | Optical Clarity | Measurement Method | Dominant Error Mechanism | Roughness Deviation Range |
|---|---|---|---|---|
| Cyclic Olefin Copolymer (COC) | Amorphous / Transparent | Coherence Scanning Interferometry | Subsurface reflection envelope overlap | +50% to +220% Sa inflation |
| Polycarbonate (PC) | Amorphous / Transparent | Laser Confocal Microscopy | Birefringence-induced focal shift | +15% to +45% Sz error |
| Polyoxymethylene (POM) | Semi-crystalline / Opaque | Focus Variation | Internal spherulite light scattering | +30% to +80% Ra inflation |
| Polyether Ether Ketone (PEEK) | Semi-crystalline / Opaque | Coherence Scanning Interferometry | High aspect ratio slope reflection loss | -25% to -60% feature dropout |

Numerical Aperture and Slope Limits
High-aspect micro-cavity sidewalls reflect incident light away from the collection optics. Objective lenses carry strict maximum slope limits dictated by numerical aperture (NA) ~ an objective with an NA of 0.55 captures surface slopes only up to 33 degrees on specular surfaces. Micro-injection moulded features with vertical walls, draft angles below two degrees, or deep channels easily exceed this threshold.
Rays falling outside the acceptance cone fail to reach the detector, leaving missing data points across steep feature sidewalls. Interpolation algorithms frequently bridge these gaps using straight lines or splines, introducing artificial smoothness into spatial parameters like Sdq (root-mean-square slope) and Sal (autocorrelation length) and obscuring tool erosion or cavity filling defects on critical draft areas.
- Fringe Dispersion Loss occurs when high local surface slopes divert reflected interference beams away from the camera sensor, leaving zero-data holes in the height map.
- Refractive Subsurface Penetration shifts the apparent focal plane beneath the physical boundary in unpigmented micro-injection polymers, producing artificial height peaks.
- Numerical Aperture Truncation cuts off high-frequency surface spatial wavelengths that exceed the optical collection angle of the objective lens.
- Phase Slope Discontinuity causes 2-pi phase unwrapping errors in monochromatic interferometry when measuring micro-steps higher than half the illumination wavelength.
Thin-film interference adds another layer of complexity when mouldings carry processing oils, release agents, or condensed moisture. A fluid film as thin as 80 nanometres alters the optical path length, shifting calculated height values by tens of nanometres across localized zones.
Non-contact optical instruments measure optical path length rather than physical mechanical boundaries on translucent substrates.


Curvature
Micro-moulded components present tight radii of form that dwarf the amplitude of high-frequency surface roughness. Spherical micro-lenses with radii under 500 micrometres, parabolic micro-reflectors, and cylindrical micro-channels possess underlying macro-geometry that must be stripped out before calculating roughness parameters.
Form Removal Filtering Criteria
Polynomial baseline fitting algorithms remove macro-geometry prior to parameter calculation. Standard Gaussian filters defined in ISO 16610-21 apply a spatial frequency cutoff wavelength (λc) to separate roughness from waviness and form, but choosing an ill-suited filter algorithm distorts surface roughness data on micro-curved geometries.
Applying a linear Gaussian filter to a highly curved micro-lens profile introduces edge distortion known as filter end-effects. The algorithm skews data at profile extremities, creating false upturns or downturns across the outer 15 percent of the evaluation length. Robust Gaussian filters or spline filters mitigate these edge artifacts, though they require evaluation lengths that micro-moulded features rarely provide.
Applying linear Gaussian filtering to micro-curved optics without robust edge treatment distorts up to 15 percent of profile boundary data.

Short Cut off Transmission Limits
Standard evaluation lengths under ISO 21920-3 exceed the physical dimensions of micro-features. A standard cutoff wavelength λc of 0.8 millimetres calls for a total evaluation length of 4.0 millimetres, yet micro-injection moulded parts often measure under 1.0 millimetre in total length, making standard evaluation protocols impossible.
- Select a short cutoff filter wavelength λc equal to 0.08 millimetres to fit the entire evaluation trace within the micro-feature geometry.
- Execute form suppression using a second-order or higher polynomial fitting routine matched to the nominal CAD geometry.
- Apply a robust Gaussian filter under ISO 16610-31 to remove residual form distortion without introducing end-effect boundary spikes.
- Verify that the ratio of sampling point spacing to cutoff wavelength λs remains below 1:5 to preserve high-frequency spatial resolution.
Shortening the cutoff wavelength λc from 0.8 millimetres to 0.08 millimetres truncates long-wavelength roughness features. Parameters like Ra and Sa drop significantly because spatial wavelengths between 0.08 millimetres and 0.8 millimetres shift into the waviness domain. Comparing micro-moulded component roughness against macro-moulded tooling specifications measured under standard cutoffs yields misleading quality assessments.
When the evaluation length drops below five times the cutoff wavelength, parameter scatter increases exponentially.

Transfer
Melt rheology and wall heat exchange establish how accurately a polymer replicates micro-structured tool cavities. Cavity surface texture replication depends on melt pressure, mold wall temperature, injection velocity, and polymer viscoelastic properties during filling.
Viscosity and Wall Temperature Interplay
Rapid skin freezing at the steel interface prevents liquid polymer from entering sub-micron cavity features. When hot polymer melt contacts cool tool steel, a frozen skin layer forms instantly.
High-viscosity engineering polymers like PEEK or LCP cannot fill ultra-fine micro-grating cavities before skin freezing occurs unless tool temperatures approach or exceed the polymer glass transition temperature (Tg) or crystalline melting point (Tm). Variothermal or dynamic mold temperature control maintains steel surface temperatures above Tg during injection, keeping frozen layer thickness below feature dimensions and enabling surface texture replication fidelity approaching 95 percent.
| Polymer Grade | Tool Temperature Profile | Peak Cavity Pressure | Tool Cavity Ra | Moulded Part Ra | Replication Ratio |
|---|---|---|---|---|---|
| PEEK (Unfilled) | Standard (180 °C) | 60 MPa | 0.20 µm | 0.08 µm | 40.0% |
| PEEK (Unfilled) | Variothermal (340 °C peak) | 110 MPa | 0.20 µm | 0.19 µm | 95.0% |
| COC (Optical Grade) | Standard (90 °C) | 45 MPa | 0.05 µm | 0.02 µm | 40.0% |
| COC (Optical Grade) | Variothermal (140 °C peak) | 85 MPa | 0.05 µm | 0.048 µm | 96.0% |
| PMMA (Medium Melt Flow) | Standard (70 °C) | 40 MPa | 0.12 µm | 0.06 µm | 50.0% |
| PMMA (Medium Melt Flow) | Variothermal (115 °C peak) | 75 MPa | 0.12 µm | 0.115 µm | 95.8% |
Worked Calculation of Pressure Driven Cavity Filling
Evaluating the capillary pressure required to fill a V-shaped micro-rib reveals the operational window. Consider a micro-rib with a width (w) of 500 nanometres and a depth (h) of 2.0 micrometres cut into tool steel. The polymer melt possesses a surface tension (γ) of 0.035 Newtons per metre and a contact angle (θ) against the tool steel of 60 degrees.
Capillary pressure opposing melt penetration into the micro-cavity follows the Young-Laplace relation:
P_capillary = (2 γ cos(θ)) / w
Substituting the values gives:
P_capillary = (2 0.035 N/m cos(60°)) / (500 10^-9 m)
P_capillary = (0.035 N/m) / (500 10^-9 m) = 70,000 Pascals = 0.07 Megapascals
While capillary resistance appears modest at 0.07 megapascals, non-isothermal solidification dramatically escalates force requirements. As melt enters the micro-channel, heat conducts into the mold wall. The effective channel width shrinks according to thermal diffusivity and cooling time:
w_effective = w – 2 delta_frozen
Where delta_frozen represents frozen layer thickness as a function of time (t), thermal diffusivity (alpha), and wall temperature differential:
delta_frozen = 2 C_thermal sqrt(alpha t)
Assuming a polymer thermal diffusivity alpha of 1.0 x 10^-7 square metres per second and a cooling constant C_thermal of 0.45, at a flow time of 0.001 seconds, frozen layer thickness delta_frozen reaches 89 nanometres per side. The effective channel width w_effective narrows from 500 nanometres to 322 nanometres.
Re-calculating capillary pressure with w_effective yields 0.108 megapascals. Viscous flow resistance through the narrowing channel scales inversely with the cube of w_effective, causing local injection pressure requirements to spike from 12 megapascals to over 43 megapascals. If peak cavity pressure reaches only 35 megapascals before gate freeze-off, the polymer fails to fill the bottom 350 nanometres of the micro-rib, rounding off sharp tool peaks.
The tool roughness transfers incompletely, resulting in lower measured Ra and Sz on the moulded part than on the steel mold cavity.
Tooling wear and polymer shear degradation introduce further replication variance over extended production runs. Continuous high-shear injection of glass-filled resins polishes high-frequency tool marks while eroding sharp micro-cavity corners, causing part surface texture to drift across 50,000 shot moulding cycles.
DIN 16742 Clause 5.2 establishes that surface texture replication tolerances must account for thermal shrinkage and skin freezing variations independent of mold dimensional tolerances.
Under ISO 20753 mold specification standards, cavity surface roughness requirements enforce mandatory variothermal process validation whenever replication ratios above 80 percent are designated for micro-features under 10 micrometres.
Scatter
Roughness readings on micro-injection mouldings show wide statistical dispersion across tool cavities and production runs. A single Ra value fails to capture spatial surface variations across multi-cavity micro-tools.

Can Areal Parameters Replace Linear Profilometry on Micro Features?
Single-line traces fail to represent anisotropic surface structures left by micro-milling or ultra-precision diamond turning. A 2D profile line running parallel to machining grooves reports an Ra value of 0.02 micrometres, while a perpendicular trace across the same feature reports an Ra of 0.18 micrometres. Areal parameters defined under ISO 25178 capture three-dimensional surface topography across complete functional zones.
Areal parameter measurement introduces new measurement limits on micro-mouldings. Parameter calculation sensitivity to instrument noise floors, spatial resolution, and missing pixels creates substantial scatter between different metrology platforms measuring the exact same micro-part.
| Areal Parameter | Physical Meaning | Sensitivity to Optical Noise | Sensitivity to Spatial Resolution | Typical Gauge R&R Contribution |
|---|---|---|---|---|
| Sa (Arithmetical Mean Height) | Average height deviation across area | Low | Moderate | 12% to 18% |
| Sz (Maximum Height) | Distance between highest peak and deepest pit | Extreme | High | 35% to 65% |
| Sdq (Root Mean Square Slope) | Average surface slope magnitude | High | Extreme | 40% to 80% |
| Sdr (Developed Interfacial Area Ratio) | Additional surface area contributed by texture | Extreme | Extreme | 50% to 90% |

Gauge Repeatability on Micro Texture Parameters
Measurement variance split between instrument repeatability and part placement error dictates quality limits. Achieving an acceptable Gauge Repeatability and Reproducibility (GR&R) threshold below 10 percent requires tight control of part fixturing and thermal expansion during inspection.
Evaluating an Sz parameter on a 200-micrometre micro-fluidic channel wall highlights this difficulty. A single stray dust particle, static charge drop, or single optical pixel spike instantly increases Sz by several hundred nanometres. Instrument software that lacks robust spike filtering converts random optical noise into out-of-spec production rejections.
Thermal expansion during inspection presents another hidden variable. Thermoplastic resins carry high coefficients of thermal expansion (CTE), typically between 60 x 10^-6 and 120 x 10^-6 per Kelvin. An ambient temperature rise of 3 degrees Celsius in the quality laboratory expands a 1.0-millimetre micro-part by 360 nanometres, exceeding the vertical amplitude of the surface roughness being evaluated.
How can quality engineers decouple true polymer shrinkage texture changes from temperature-induced fixture drift during high-speed batch sampling?
Contract
Procurement specifications for micro-moulded tooling state measurement methods alongside target values. Specifying a surface roughness value like Ra 0.05 micrometres on an engineering drawing without naming instrument type, stylus tip radius, optical objective, cutoff wavelength, and evaluation length leads directly to commercial disputes between component buyers and molders.

Drawing Callouts and Parameter Selection
Specifying Ra without instrument cutoff limits creates contractual ambiguity between toolmaker and moulder. Engineering drawings must adhere to ISO 21920-1 surface texture indication standards. Complete callouts designate the measurement method, spatial bandwidth, cutoff filter type, and evaluation grid.
For micro-moulded optics or micro-fluidics, replacing 2D profile line callouts with ISO 25178 areal callouts ensures quality inspection matches performance requirements. An areal specification defines the evaluated area size, field of view, spatial sampling interval, and exact filtering protocols.
Acceptance Criteria and Quality Verification
Batch verification relies on structured sampling protocols aligned with cavity layout and press stability. Micro-injection moulding machines operating with shot weights below 0.5 grams exhibit thermal and shot-volume fluctuations across extended production runs. Inspecting parts solely from T1 initial sampling shots fails to guarantee long-term process capability.
- Parameter Definition Matrix specifies designated parameters, physical units, target ranges, and upper specification limits for all functional surfaces.
- Instrument Bandwidth Boundary establishes approved metrology equipment types, objective numerical aperture, light source wavelength, and physical probe tip geometry.
- Form Filter Specification details exact mathematical algorithms, cutoff values, spline constraints, and boundary truncation methods used during data extraction.
- Sampling Density Standard defines spatial point spacing, field of view area, evaluation trace lengths, and minimum statistical sample sizes per cavity.
Establishing clear measurement protocol bounds inside tooling supply contracts protects both buyer and toolmaker. When inspecting micro-injection components, landed quality costs depend on eliminating metrology ambiguity before steel is cut. Specifying non-contact optical profilometry methods with defined numerical aperture and noise-filtering limits provides an unambiguous baseline for tool sign-off and production batch release.