ATR FTIR Spectroscopy Calibration for Slip Additive Surface Concentration Measurement
ATR FTIR spectroscopy quantifies polyolefin slip bloom within the evanescent zone, linking surface migration to friction without solvent extraction delays.

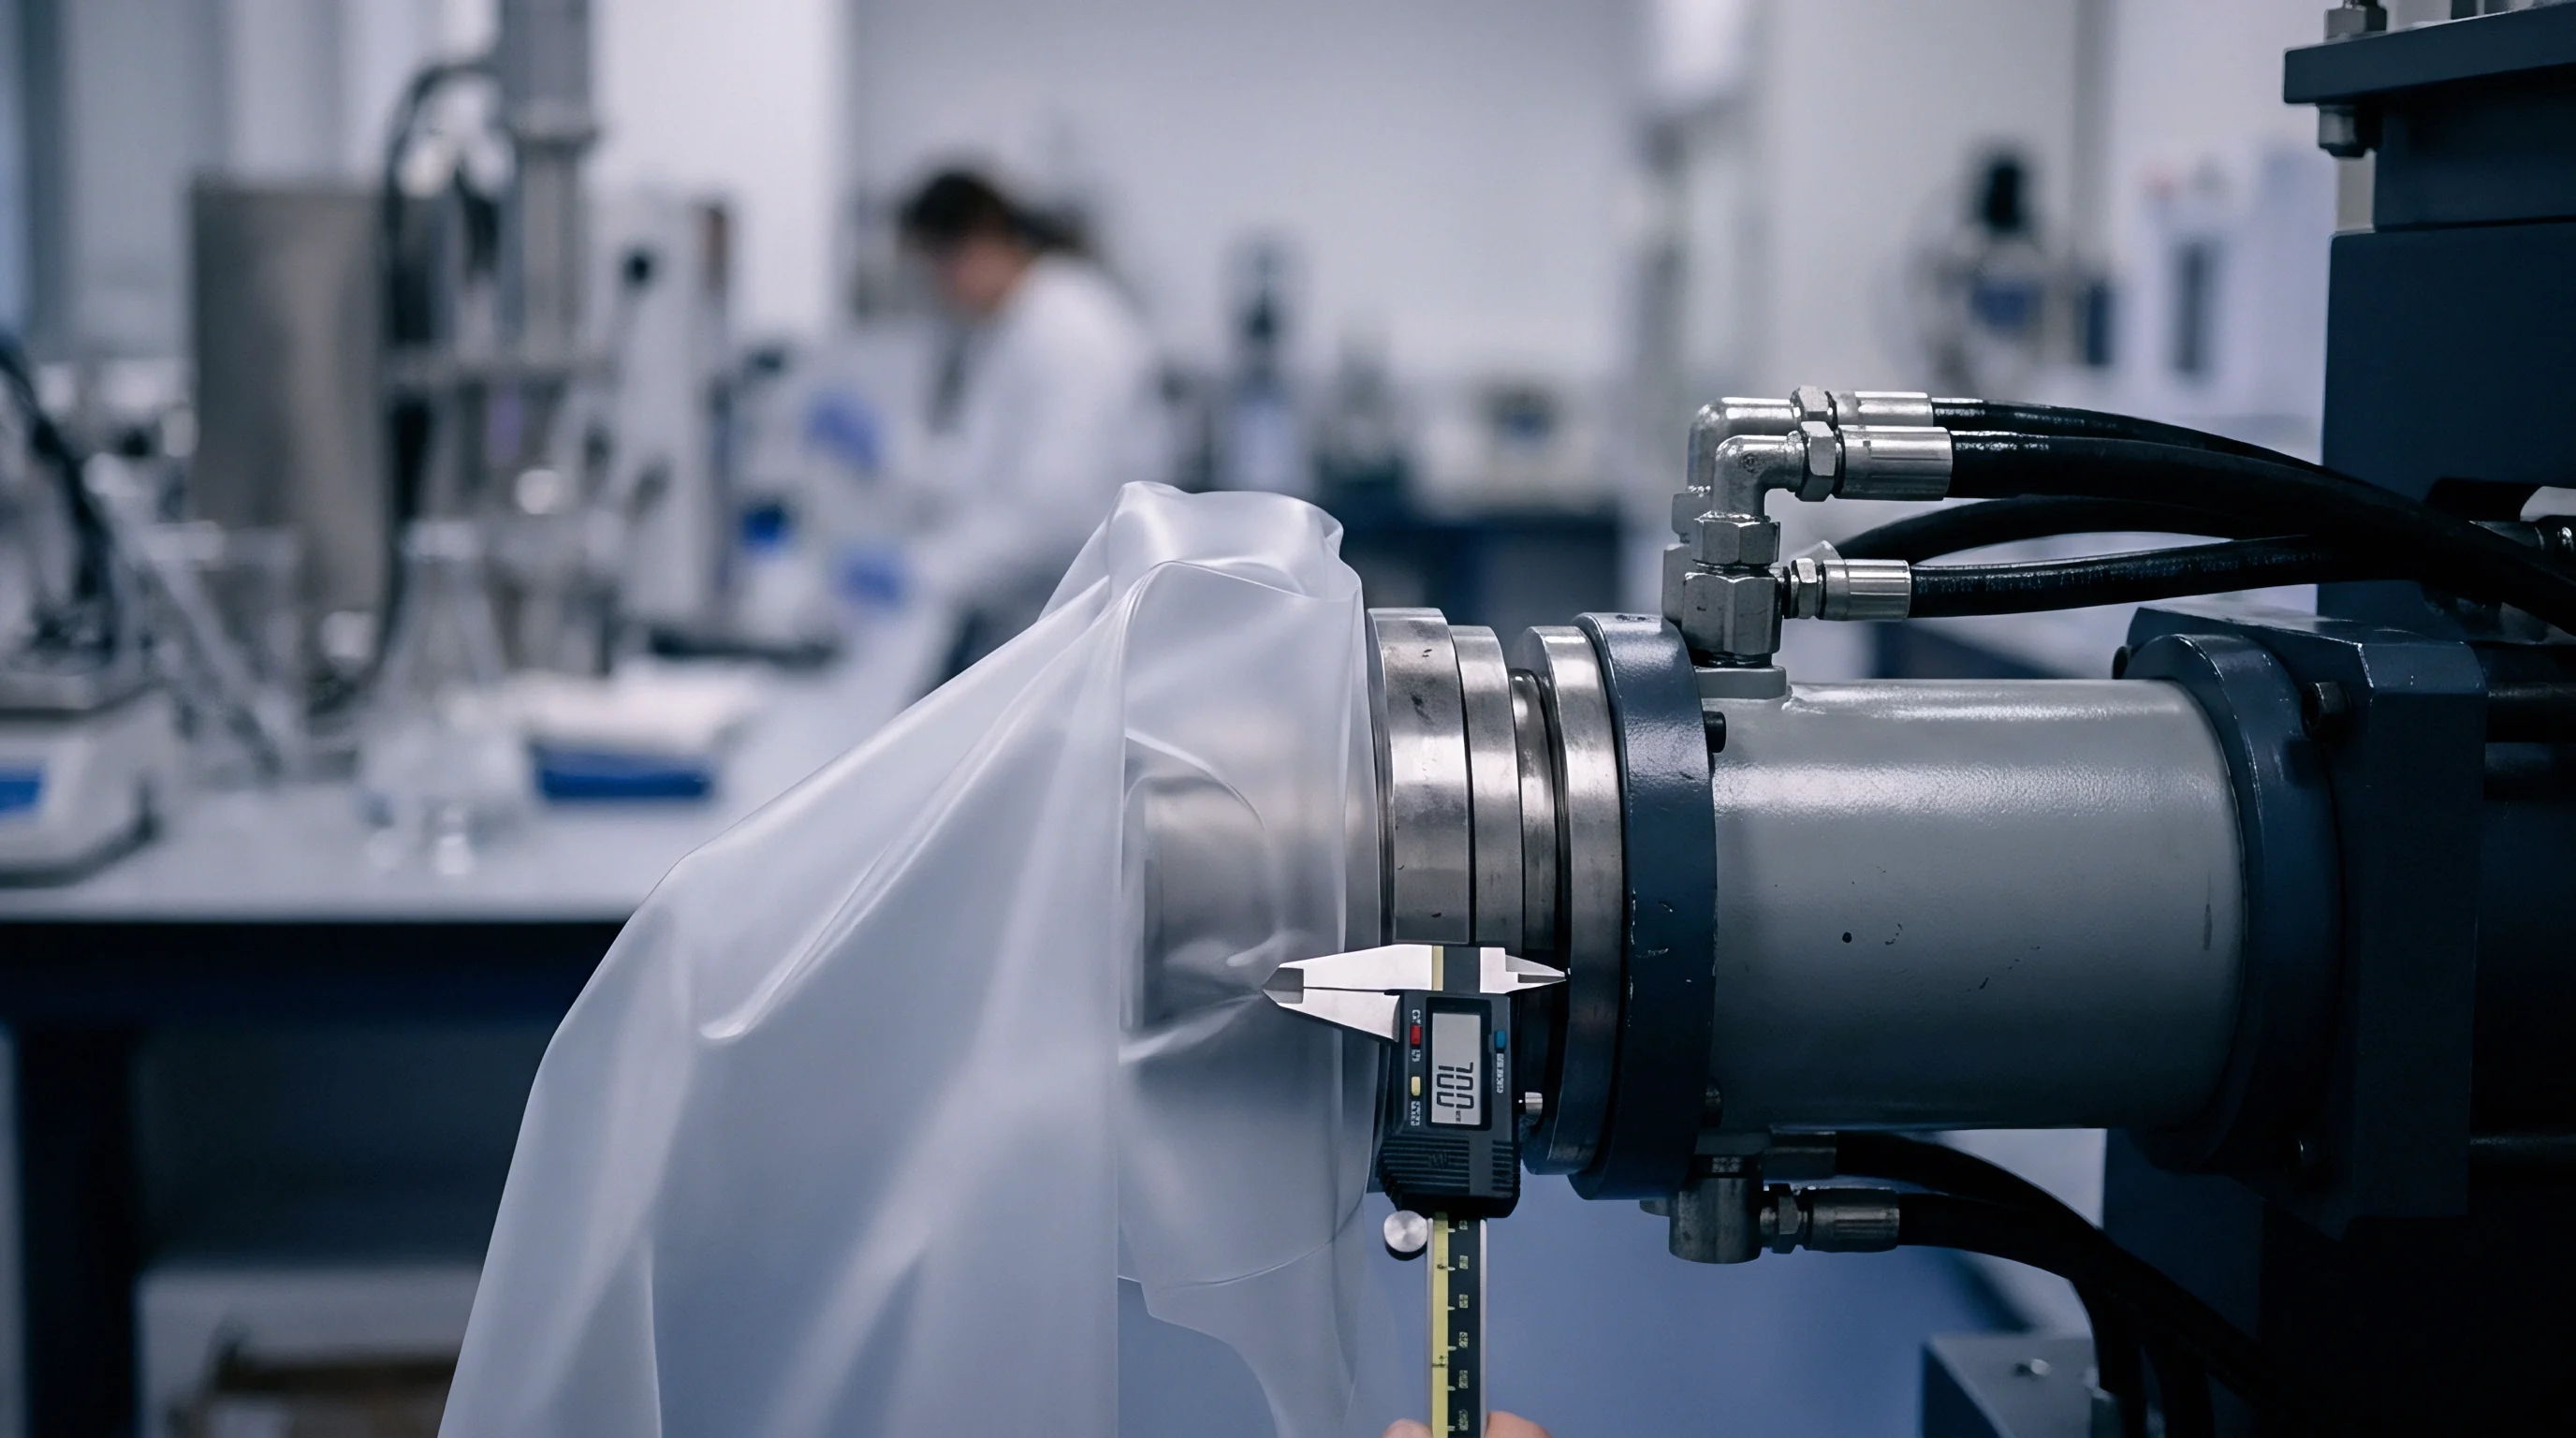
Prism
Incoming blown film lots exhibiting coefficient of friction values above 0.35 frequently reveal zero formulation errors in bulk ash testing. Extracting the total fatty acid amide content through reflux extraction isolates the resin compound recipe, yet web handling performance depends entirely on the additive molecules residing within the outermost two hundred nanometers of the polyethylene envelope. Attenuated total reflectance Fourier-transform infrared spectroscopy resolves this surface layer by pressing the polymer web against an internal reflection element, capturing the evanescent wave interaction without solvent extraction delays.
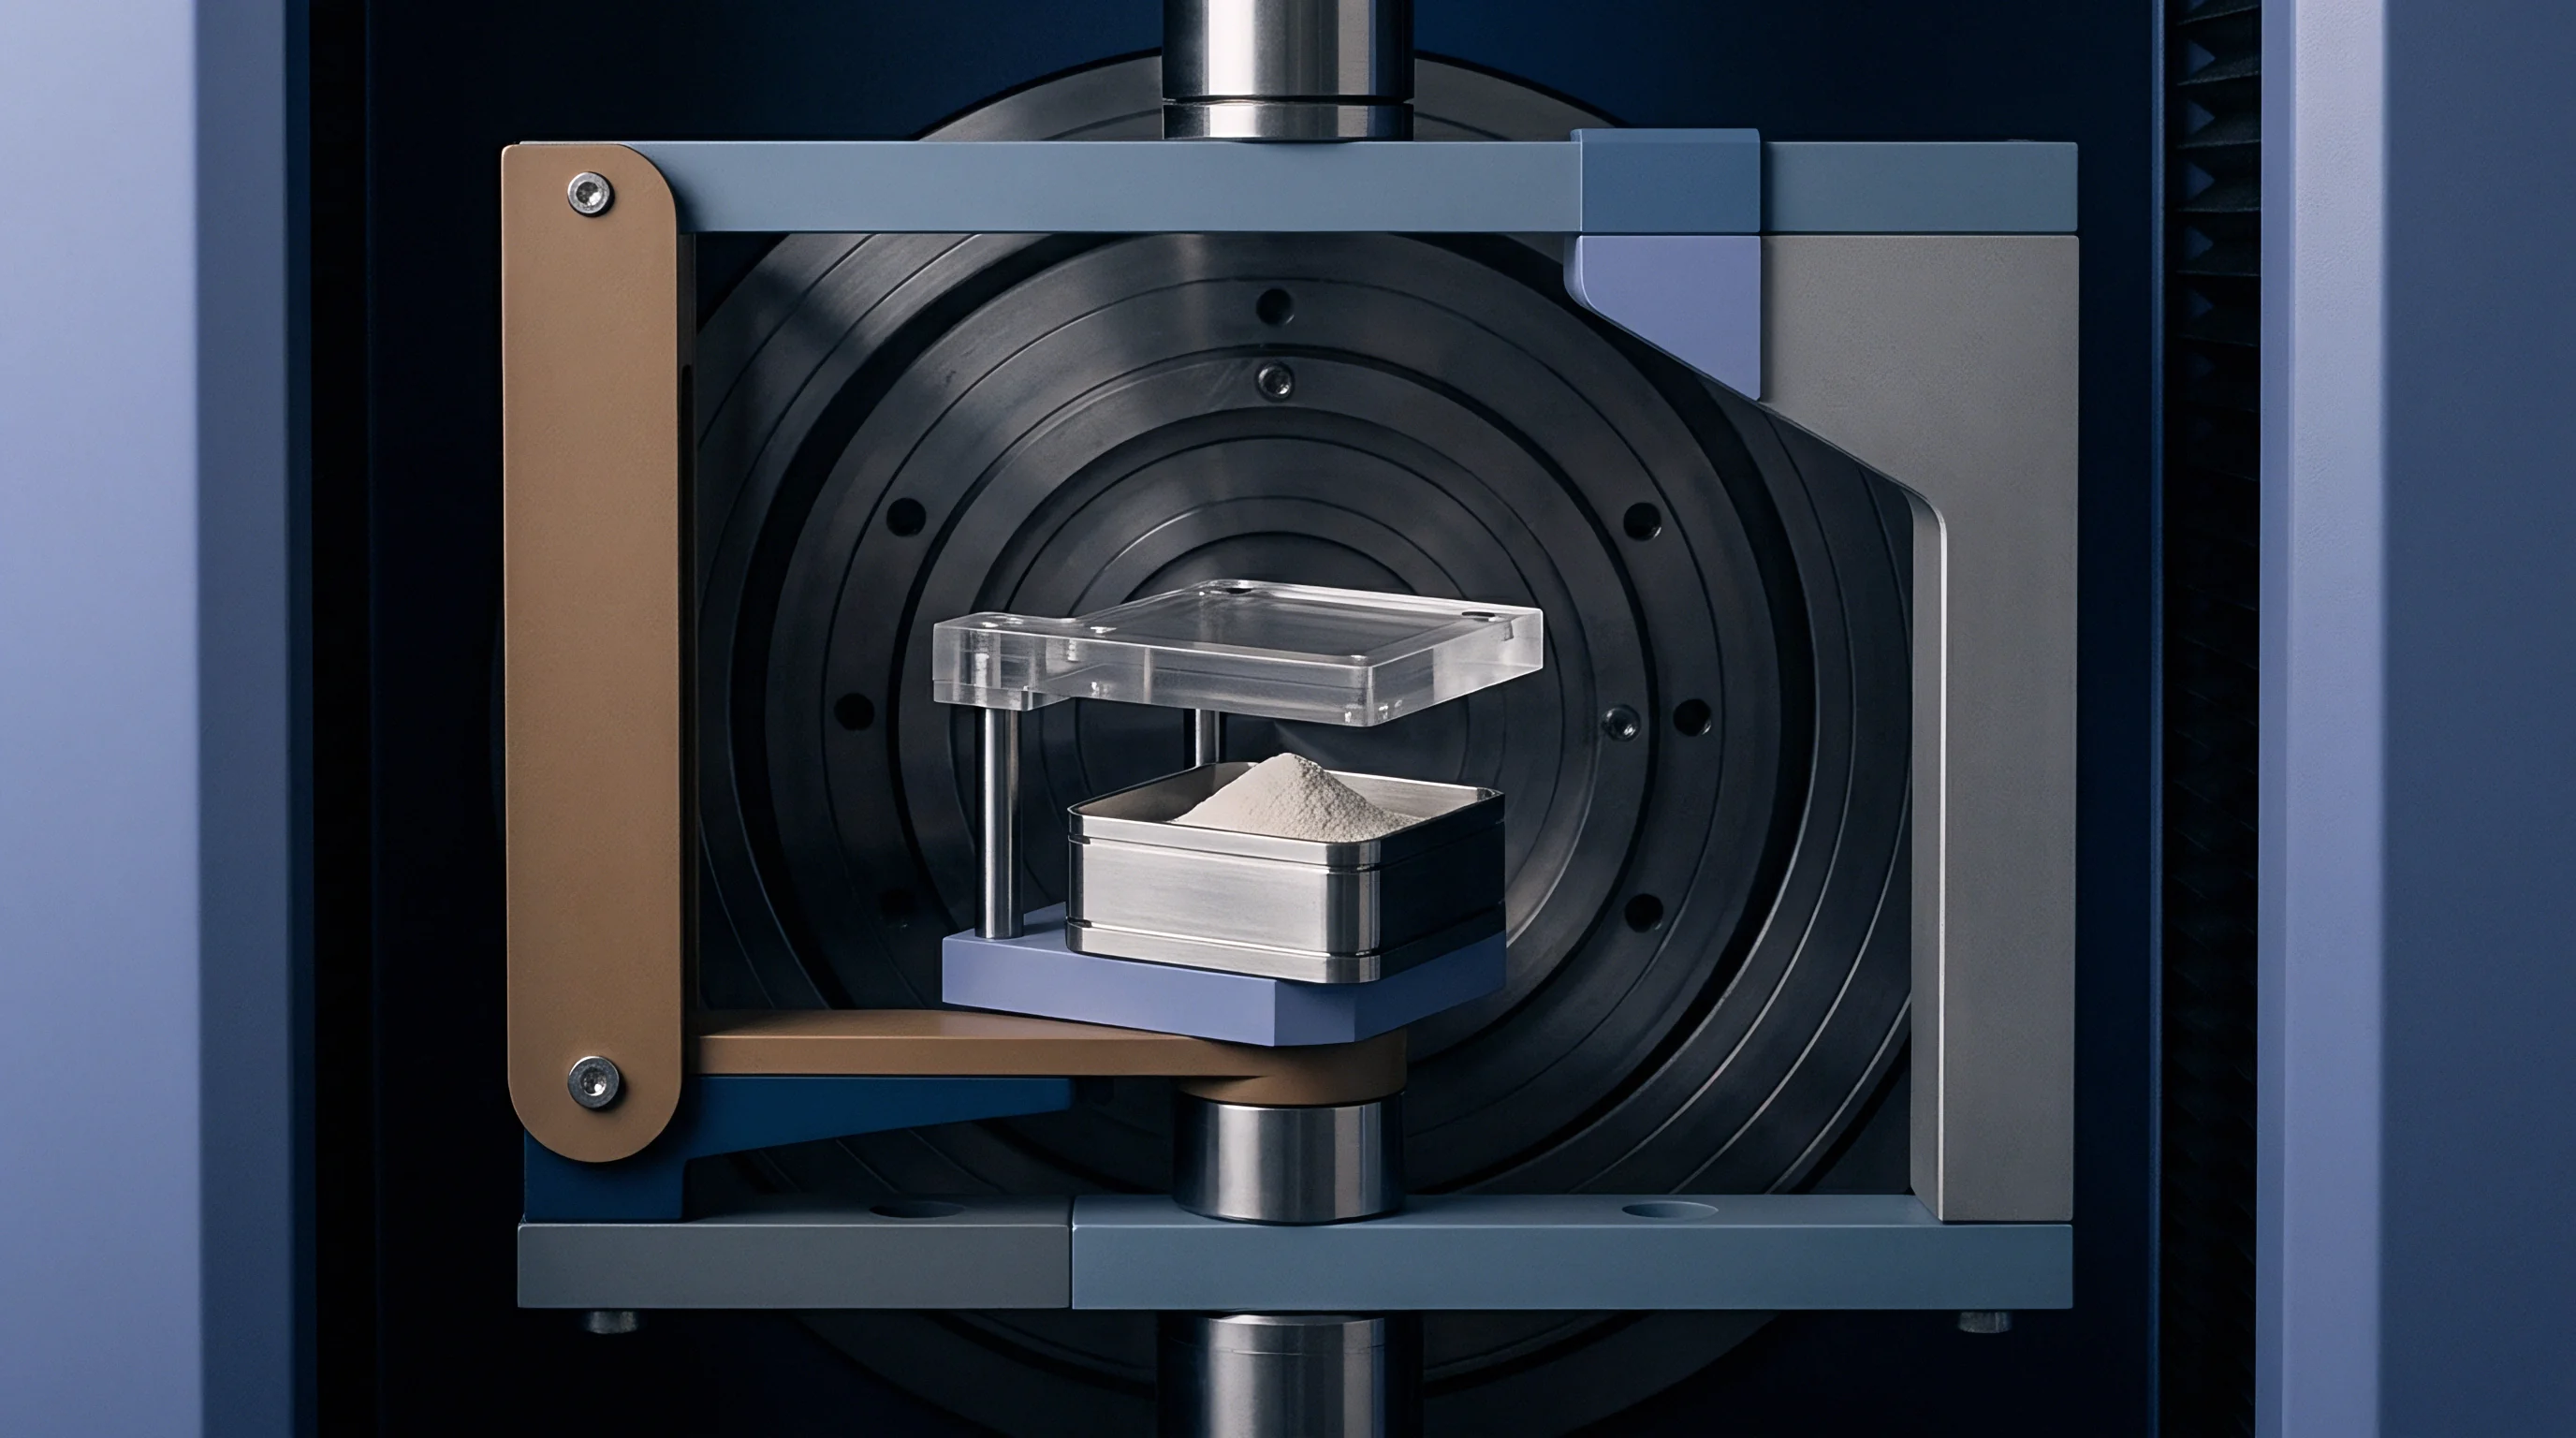
Torque applied to the sampling press dictates the optical contact area. Unfilled linear low-density polyethylene features an elastic modulus near two hundred megapascals at room temperature. Insufficient clamping load leaves micro-voids between the crystal facet and the extruded film, reducing the measured absorbance of both the polymer matrix and the migrating additive.
Consistent crystal pressure matters far more than extended scan averaging.
A diamond internal reflection element withstands harsh mechanical loading, permitting clamping pressures exceeding eighty megapascals. Zinc selenide fractures under uneven loads, while germanium limits the penetration volume owing to its elevated refractive index of 4.0. When an inspector switches between optical materials without adjusting the calibration curve, the apparent concentration shifts dramatically.
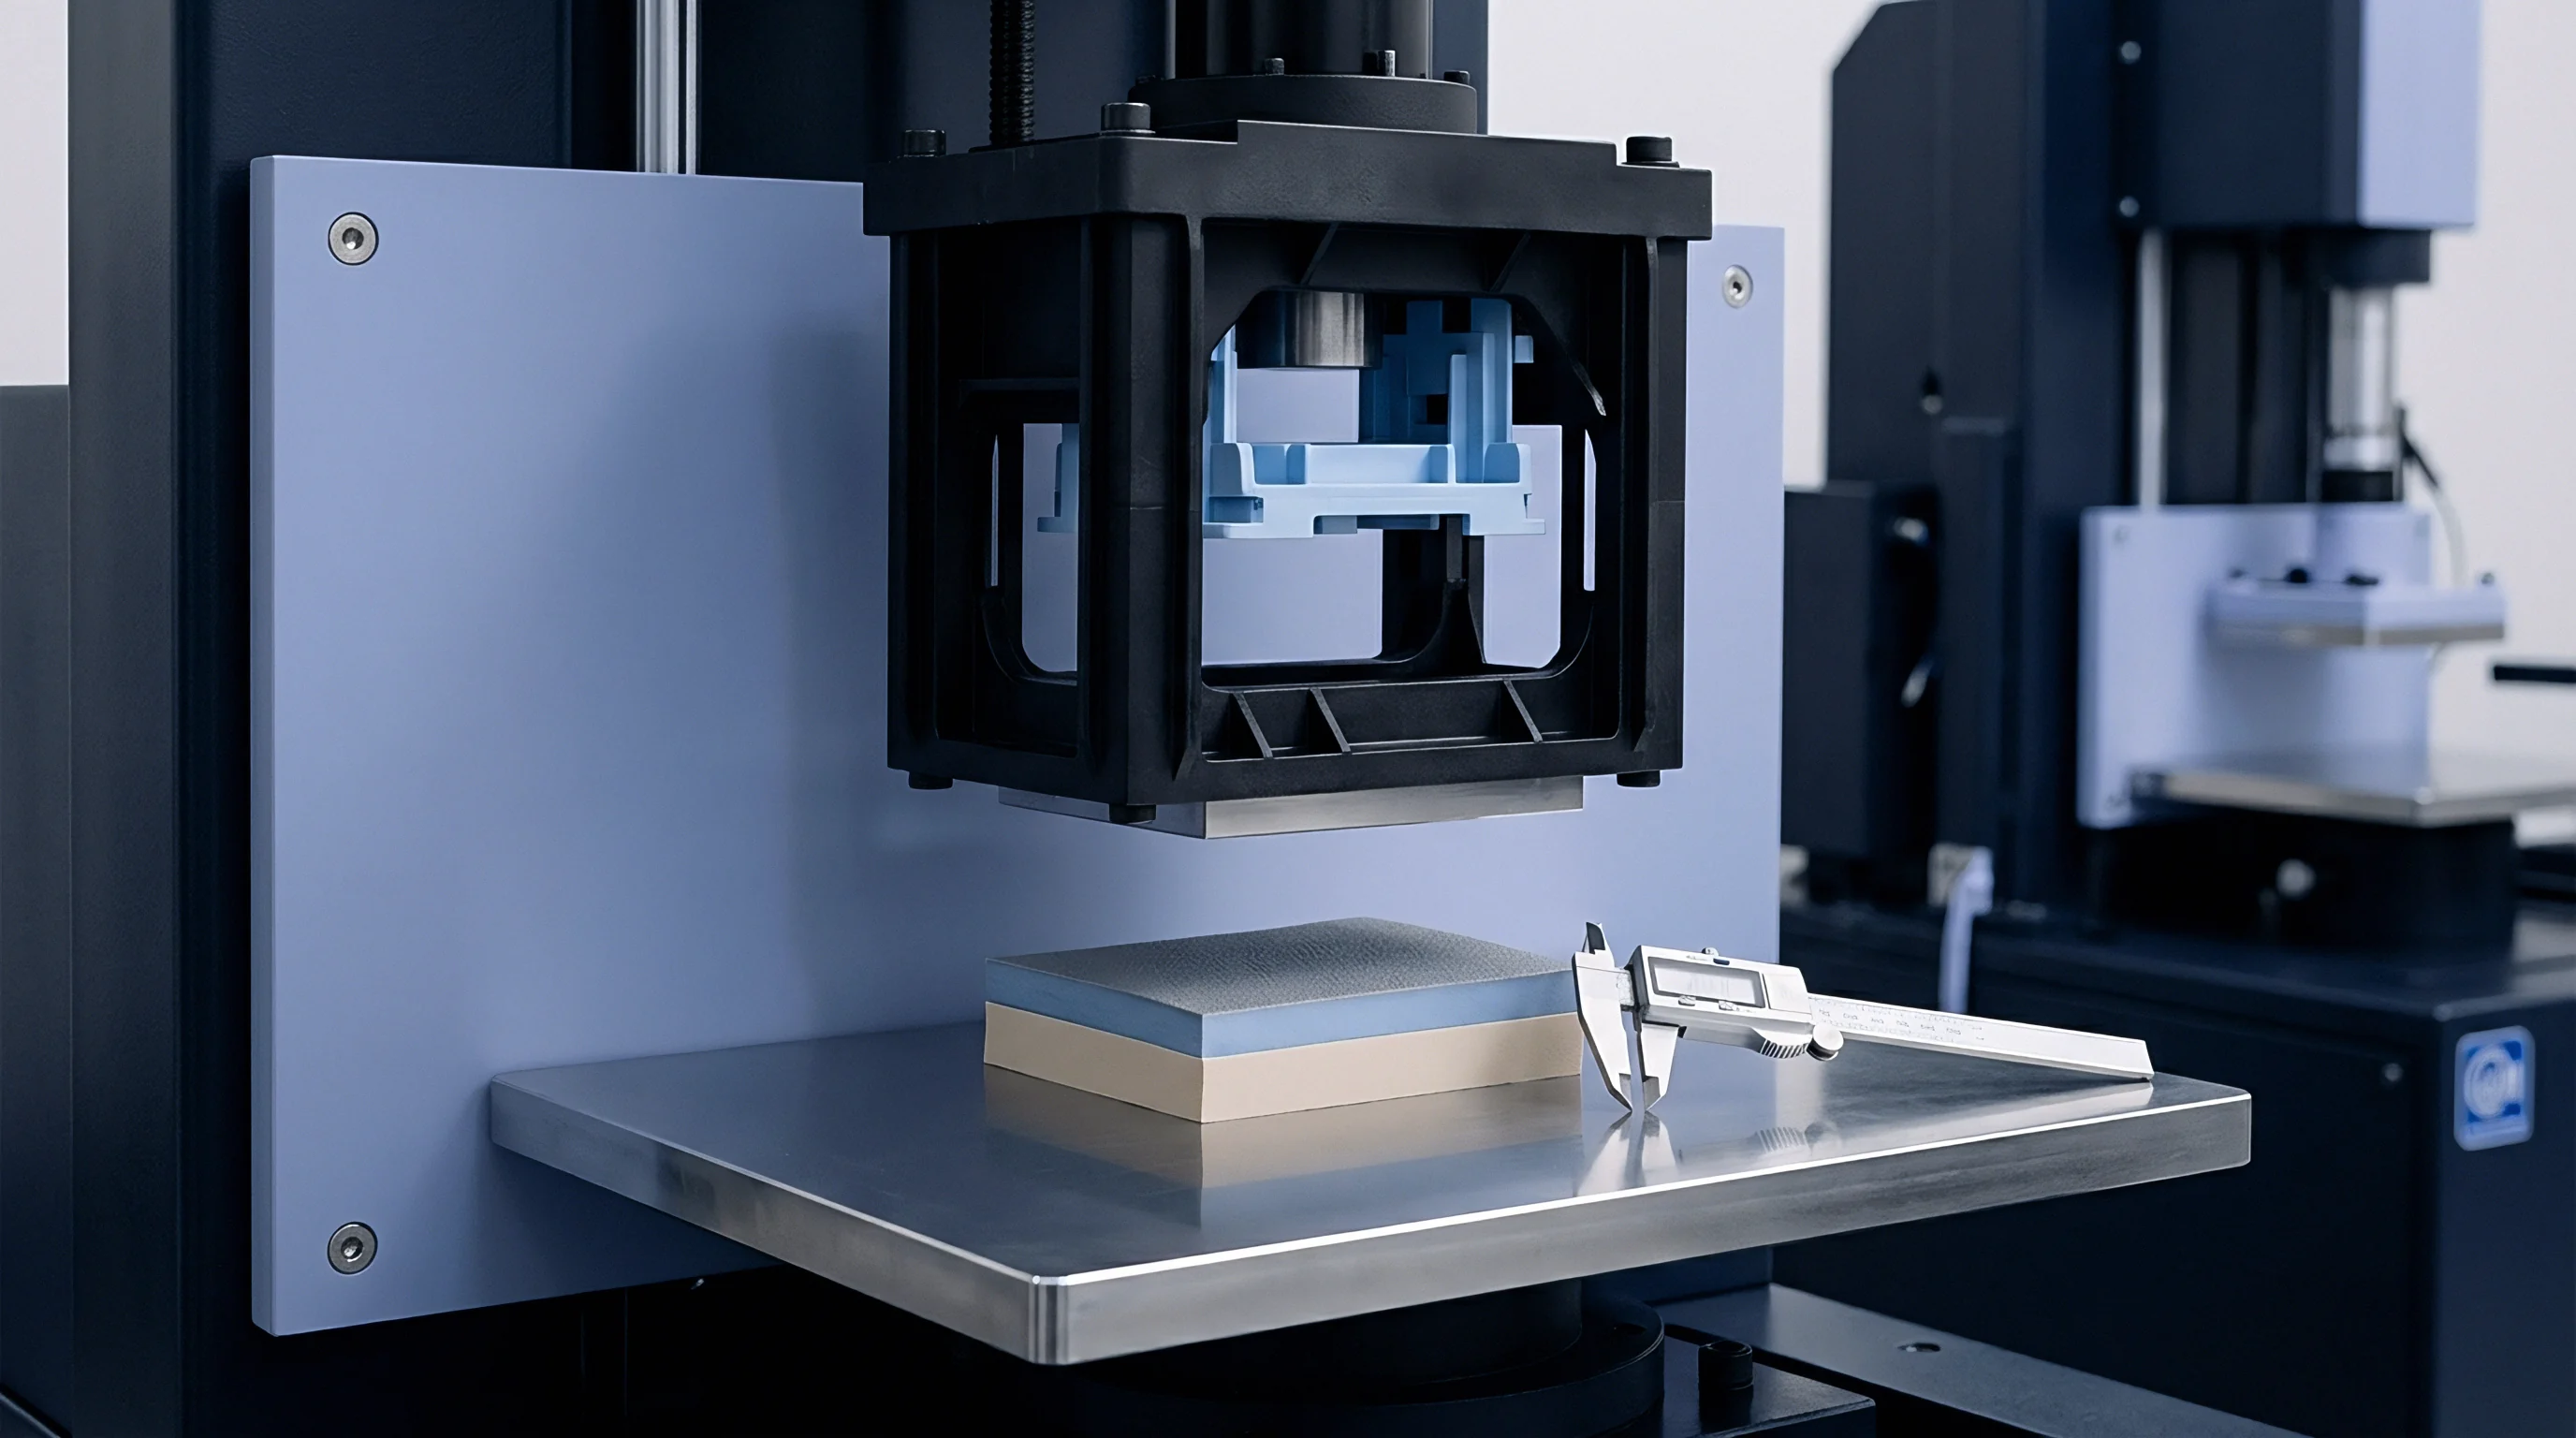
Optical Coupling Mechanics
Direct mechanical contact between the sample and the internal reflection element governs total absorbance intensity. Air gaps between rough film surfaces and the crystal face drop the evanescent energy transfer by ninety percent. Calibrating the torque wrench to forty Newton-centimeters stabilizes the contact area on low-density packaging substrates.
Higher clamping forces induce local yielding, altering the crystalline orientation of the skin layer and modifying the dichroic ratio of the infrared absorption bands.
- Mechanical crystal cleaning strips residual migrant films using lint-free optical wipes dampened with spectroscopic grade hexane.
- Background spectrum acquisition captures ambient atmospheric moisture and carbon dioxide vapor levels through sixty-four co-added scans.
- Specimen positioning centers the primary extrusion bubble skin directly across the optical aperture without touching the active face with bare gloves.
- Controlled clamp torquing compresses the polyolefin web against the diamond face until the gauge registers thirty-five Newton-centimeters.
- Interferogram transformation computes the single-beam ratio before inspecting the baseline between two thousand and eighteen hundred wavenumbers.
Crystal Geometry Selection
Internal reflection substrates impose optical boundaries on the measurement path. Germanium elements confine the probe depth to shallow zones, useful for heavily bloomed slip cakes that would otherwise saturate the detector on diamond plates. Single-reflection horizontal ATR accessories simplify routine plant floor workflows.
Multi-reflection trapezoidal plates amplify faint signals from freshly extruded webs containing under two hundred parts per million of slip additive, but complicate cleaning cycles when sticky oligomers adhere to the optics.
Polymer processors often complain that rapid testing benches report shifting values because film rolls cool unevenly across the master spool.


Depth
Radiation penetrating an optical boundary undergoing total internal reflection generates an electromagnetic field that decays exponentially into the rarer medium. The effective penetration depth defines the distance where the electric field amplitude drops to thirty-seven percent of its interfacial value. This value depends directly on the interrogation wavelength, the incident angle of the infrared beam, and the refractive indices of both the internal reflection crystal and the polyolefin matrix.
Longer wavelengths probe significantly deeper into the polymer substrate. The carbon-hydrogen bending vibration of polyethylene near 1463 wavenumbers probes twenty percent deeper than the amide carbonyl absorption band at 1640 wavenumbers. Quantifying additives without correcting for this chromatic depth distortion yields erroneous concentration ratios whenever films exhibit steep concentration gradients through their cross-section.
A diamond prism operating at forty-five degrees yields a penetration depth of 1.66 micrometers at 1640 wavenumbers in low-density polyethylene.
Incident angles close to the critical angle expand the sampling depth. Raising the incidence angle from forty-five degrees to sixty degrees compresses the interrogation zone, isolating the immediate surface skin from the bulk reservoir beneath.
Evanescent Field Attenuation Physics
Maxwell equations describe the continuous boundary conditions of light passing from a high refractive index medium into an absorbing dielectric. When the angle of incidence exceeds the critical angle defined by Snell law, no net energy propagates normal to the interface in a non-absorbing medium. The electric field vector forms an evanescent wave decaying along the z-axis perpendicular to the crystal surface.
Refractive index shifts within the polymer sample alter this decay constant. Unstabilized polyethylene exhibits a refractive index of 1.51 across the mid-infrared region. Adding twenty percent inorganic talc anti-block increases the composite refractive index to 1.56, compressing the evanescent decay profile and reducing the sampling volume by eight percent.
| Optical Crystal | Refractive Index | Wavenumber (cm-1) | Penetration Depth (um) | Primary Target Mode |
|---|---|---|---|---|
| Diamond | 2.40 | 1640 | 1.66 | Amide I Carbonyl Stretch |
| Diamond | 2.40 | 1550 | 1.76 | Amide II Nitrogen-Hydrogen Bend |
| Diamond | 2.40 | 1463 | 1.86 | Polyethylene Methylene Bend |
| Diamond | 2.40 | 720 | 3.78 | Polyethylene Skeletal Rock |
| Zinc Selenide | 2.42 | 1640 | 1.63 | Amide I Carbonyl Stretch |
| Germanium | 4.00 | 1640 | 0.66 | Amide I Carbonyl Stretch |
| Germanium | 4.00 | 1463 | 0.74 | Polyethylene Methylene Bend |

Penetration Disparity across Frequencies
Quantitative analysis relies on comparing analyte peak areas against internal reference bands of the host resin matrix. Analysts commonly choose the 1463 wavenumber methylene bending doublet or the weak combination band at 2019 wavenumbers to correct for sample contact area variations. The 2019 wavenumber band samples a shallower slice of the film than the 1463 wavenumber fundamental band.
Choosing an inappropriate internal reference band introduces artificial concentration drift. When slip additive molecules accumulate within the top two hundred nanometers, an internal standard that probes two micrometers deep understates the actual surface concentration. Normalizing the 1640 wavenumber Amide I band against the 2019 wavenumber polyethylene reference reduces this depth mismatch by fifty-five percent compared to normalization against the 720 wavenumber skeletal rocking vibration.
The unresolved physical question remains whether the transition layer between the pure crystalline erucamide bloom and the amorphous polyethylene matrix exhibits a stepped or a continuously variable refractive index.
Band
Spectral signatures of primary fatty acid amides depend heavily on molecular conformation and hydrogen bonding states. Erucamide and oleamide exhibit an intense Amide I band near 1640 wavenumbers, dominated by the carbonyl stretching vibration. Secondary absorption emerges near 1550 wavenumbers as the Amide II band, arising from coupled carbon-nitrogen stretching and nitrogen-hydrogen in-plane bending modes.
Amorphous and crystalline slip phases display shifted band centers. Dissolved erucamide dispersed within the amorphous polyethylene matrix absorbs near 1655 wavenumbers. When the additive blooms to the surface and organizes into crystalline domains, intermolecular hydrogen bonding shifts the carbonyl absorption peak downward to 1638 wavenumbers while narrowing the full width at half maximum.
Calibration protocols must track this peak shift during sample aging. Integrating across a fixed, narrow window between 1645 and 1635 wavenumbers misses the dissolved fraction entirely. Setting the integration boundaries from 1690 to 1620 wavenumbers captures both phases, delivering true total mass balances across the evanescent interrogation zone.

Carbonyl Vibrational Deconvolution
Overlapping spectral features from secondary additives obscure the primary slip signal. Hindered amine light stabilizers, acid scavengers, and oxidized species introduce carbonyl absorption within the 1740 to 1600 wavenumber region. Calcium stearate, added at five hundred parts per million as an acid neutralizer in prime polyolefin resins, displays strong carboxylate asymmetric stretching bands at 1577 and 1540 wavenumbers.
Carboxylate peaks overlap the Amide II band directly. Calibration curves constructed using the 1550 wavenumber Amide II absorption without baseline deconvolution read artificially high whenever the calcium stearate dosing drifts. Analysts avoid this interference by targeting the 1640 wavenumber Amide I peak, using a two-point linear baseline drawn between 1710 and 1590 wavenumbers.
| Additive Chemistry | Chemical Formula | Amide I Peak (cm-1) | Amide II Peak (cm-1) | Baseline Window (cm-1) | Typical Dosing (ppm) |
|---|---|---|---|---|---|
| Erucamide | C22H43NO | 1640 | 1552 | 1710 to 1590 | 500 to 1500 |
| Oleamide | C18H35NO | 1642 | 1554 | 1710 to 1590 | 400 to 1000 |
| Stearamide | C18H37NO | 1644 | 1550 | 1710 to 1590 | 200 to 600 |
| Behenamide | C22H45NO | 1639 | 1551 | 1710 to 1590 | 500 to 1200 |
| Integration uses linear two-point baseline correction; target bands reference unoriented blown film matrices. | |||||

Baseline Correction Protocols
Interference fringes generate sinusoidal baseline undulations in thin polyolefin films. When inspecting five-micrometer biaxially oriented polypropylene or ten-micrometer cast films, reflections between the front and rear film interfaces create optical fringes that distort weak absorption peaks. Pressing the film firmly against the internal reflection crystal eliminates front-face reflections, but the rear interface continues to generate interference unless coated with a refractive-index-matching fluid.
- Interference fringe artifacts appear when specimen thickness matches the optical coherence length of the infrared source.
- Carbon black attenuation causes sloping baselines across the mid-infrared spectrum through non-resonant scattering.
- Anti-block particle scattering broadens baseline profiles around one thousand wavenumbers near silica stretching modes.
- Moisture vapor rotational bands introduce high-frequency noise between seventeen hundred and fifteen hundred wavenumbers.
Peak area ratios always outperform absolute peak heights on solid polymer films.


Gradient
Additive distribution through the thickness of a blown film bubble develops continuously over time. Fatty acid amides exhibit limited thermodynamic solubility in solid semi-crystalline polyolefins. At ambient warehouse temperatures, low-density polyethylene accommodates less than three hundred parts per million of erucamide within its amorphous interlamellar galleries.
Masterbatch additions typically introduce between eight hundred and fifteen hundred parts per million into the melt. Upon cooling below the polymer crystallization temperature, the excess additive enters a supersaturated state. This chemical potential gradient drives molecule diffusion toward the film boundaries, forming a segregated surface layer.
A twenty-four-hour conditioning interval at twenty-three degrees Celsius stabilizes ninety percent of the blooming equilibrium in seventy-micrometer polyethylene film.
Surface migration rates depend on molecular weight and chain saturation. Oleamide features an eighteen-carbon chain with one cis-double bond, diffusing outward faster than erucamide with its twenty-two-carbon backbone. Cast film lines operating at high wind-up speeds rely on oleamide for rapid friction reduction, while blown agricultural films demand erucamide to ensure prolonged slip retention over months of outdoor exposure.
Surface Bloom Morphology
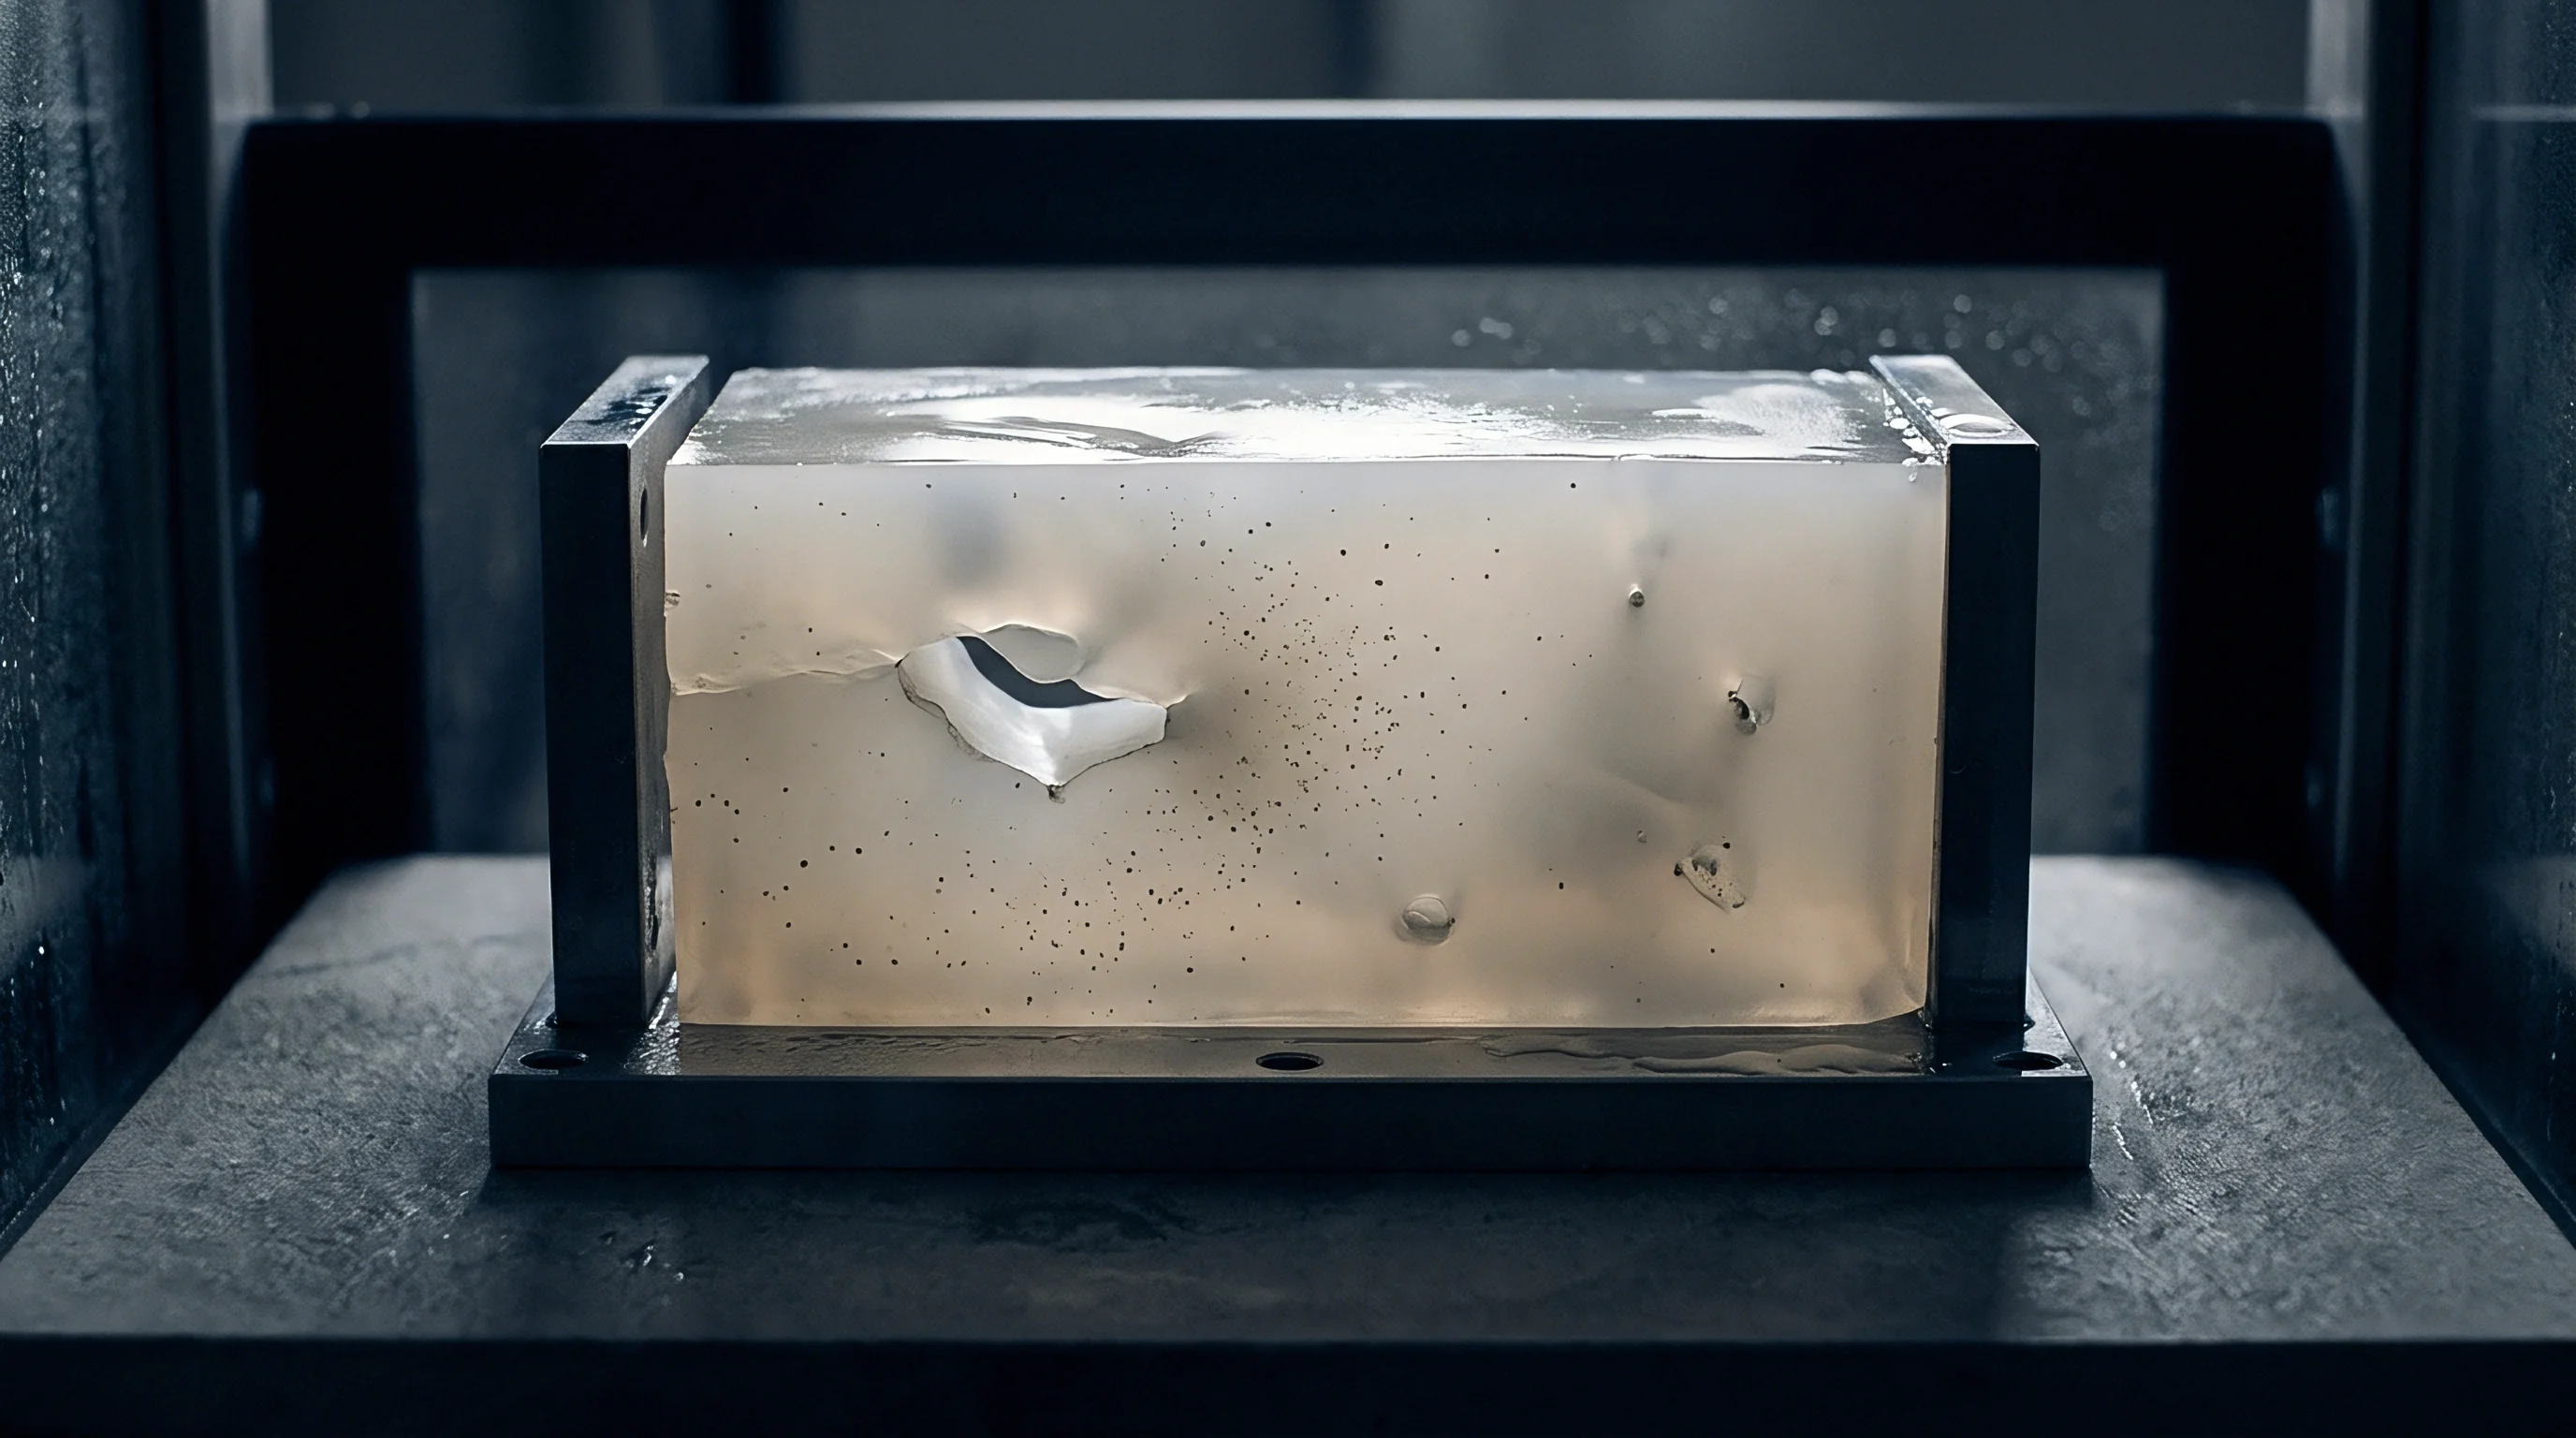
Segregated slip molecules do not form uniform monolithic coatings across the extrusion envelope. Optical profilometry reveals discrete crystalline patches that nucleate and spread laterally across the polyolefin surface. The local thickness of these slip domains ranges from twenty nanometers during initial migration to over three hundred nanometers after several weeks of warehouse storage.
Container shipping routes crossing maritime equatorial zones expose palletized resin goods to ambient temperatures above forty-five degrees Celsius. These conditions drive significant physical transitions. Heated storage re-dissolves surface slip crystals back into the bulk polymer matrix, resetting the bloomed layer and causing packaging film rolls to weld together on the pallet core through blocking.
The evanescent wave integrates whatever mass exists within its penetration envelope. Because the penetration depth ranges between one and two micrometers, the spectrometer records the bloomed surface crystals and the immediate sub-surface depletion zone simultaneously. A calibration curve generated from solvent-cast standards with uniform bulk distributions will miscalculate this segregated surface mass unless mathematically corrected.
- Thermal equilibration monitoring tracks warehouse temperatures to ensure specimens remain between twenty and twenty-five degrees Celsius prior to testing.
- Aging duration verification confirms the film aged at least forty-eight hours post-extrusion to avoid capturing dynamic non-equilibrium bloom rates.
- Dual-face sampling tests both the inner and outer surfaces of blown film bubbles to detect corona treatment migration bias.
- Solvent swab quantification compares the ATR peak ratio against gravimetric mass obtained from gentle surface ethanol rinses.

Fickian Diffusion Limits
Mathematical modeling of additive segregation treats the polymer web as a finite planar sheet with partially reflective boundaries. The diffusion coefficient of erucamide in linear low-density polyethylene hovers around 3.5 multiplied by ten to the power of minus ten square centimeters per second at twenty-three degrees Celsius. This value rests on published desorption trials and moves upward by forty percent if the host resin density drops from 0.922 to 0.915 grams per cubic centimeter.
Film orientation alters the migration pathway. Biaxial stretching in BOPP lines aligns the crystalline lamellae parallel to the film face, forcing diffusing slip molecules to navigate tortuous amorphous channels. This structural barrier reduces the apparent diffusion coefficient by an order of magnitude, delaying bloom equilibrium from two days to three weeks.
Misinterpreting these non-equilibrium migration states leads converters to over-dose slip masterbatch, producing catastrophic label adhesion failures downstream.
Ledger
Slip masterbatch represents an expensive operational specialty line item on the extrusion hall balance sheet. Prime erucamide masterbatch containing five percent active slip additive trades at approximately 3.20 dollars per kilogram, compared to base film-grade linear low-density polyethylene at 1.15 dollars per kilogram. Formulators attempting to cure intermittent high-friction incidents often increase masterbatch let-down ratios from two percent to four percent.
Over-dosing additive packages burns working capital. Adding two thousand parts per million of slip additive where one thousand parts per million satisfies functional packaging specifications adds roughly twenty-four dollars of unnecessary cost per metric ton of extruded web. On a high-output film extrusion asset producing twenty thousand tons annually, this unmetered drift wastes nearly half a million dollars each year.
The downstream consequences carry larger financial liabilities. Excess fatty acid amides migrate onto laminating adhesives, reducing peel strength below critical bond thresholds. Surface slip crystals also contaminate heat seal layers, broadening the required sealing temperature window and creating pinhole leaks in food pouches on automated form-fill-seal packaging equipment.

Extrusion Waste from Dosing Drift
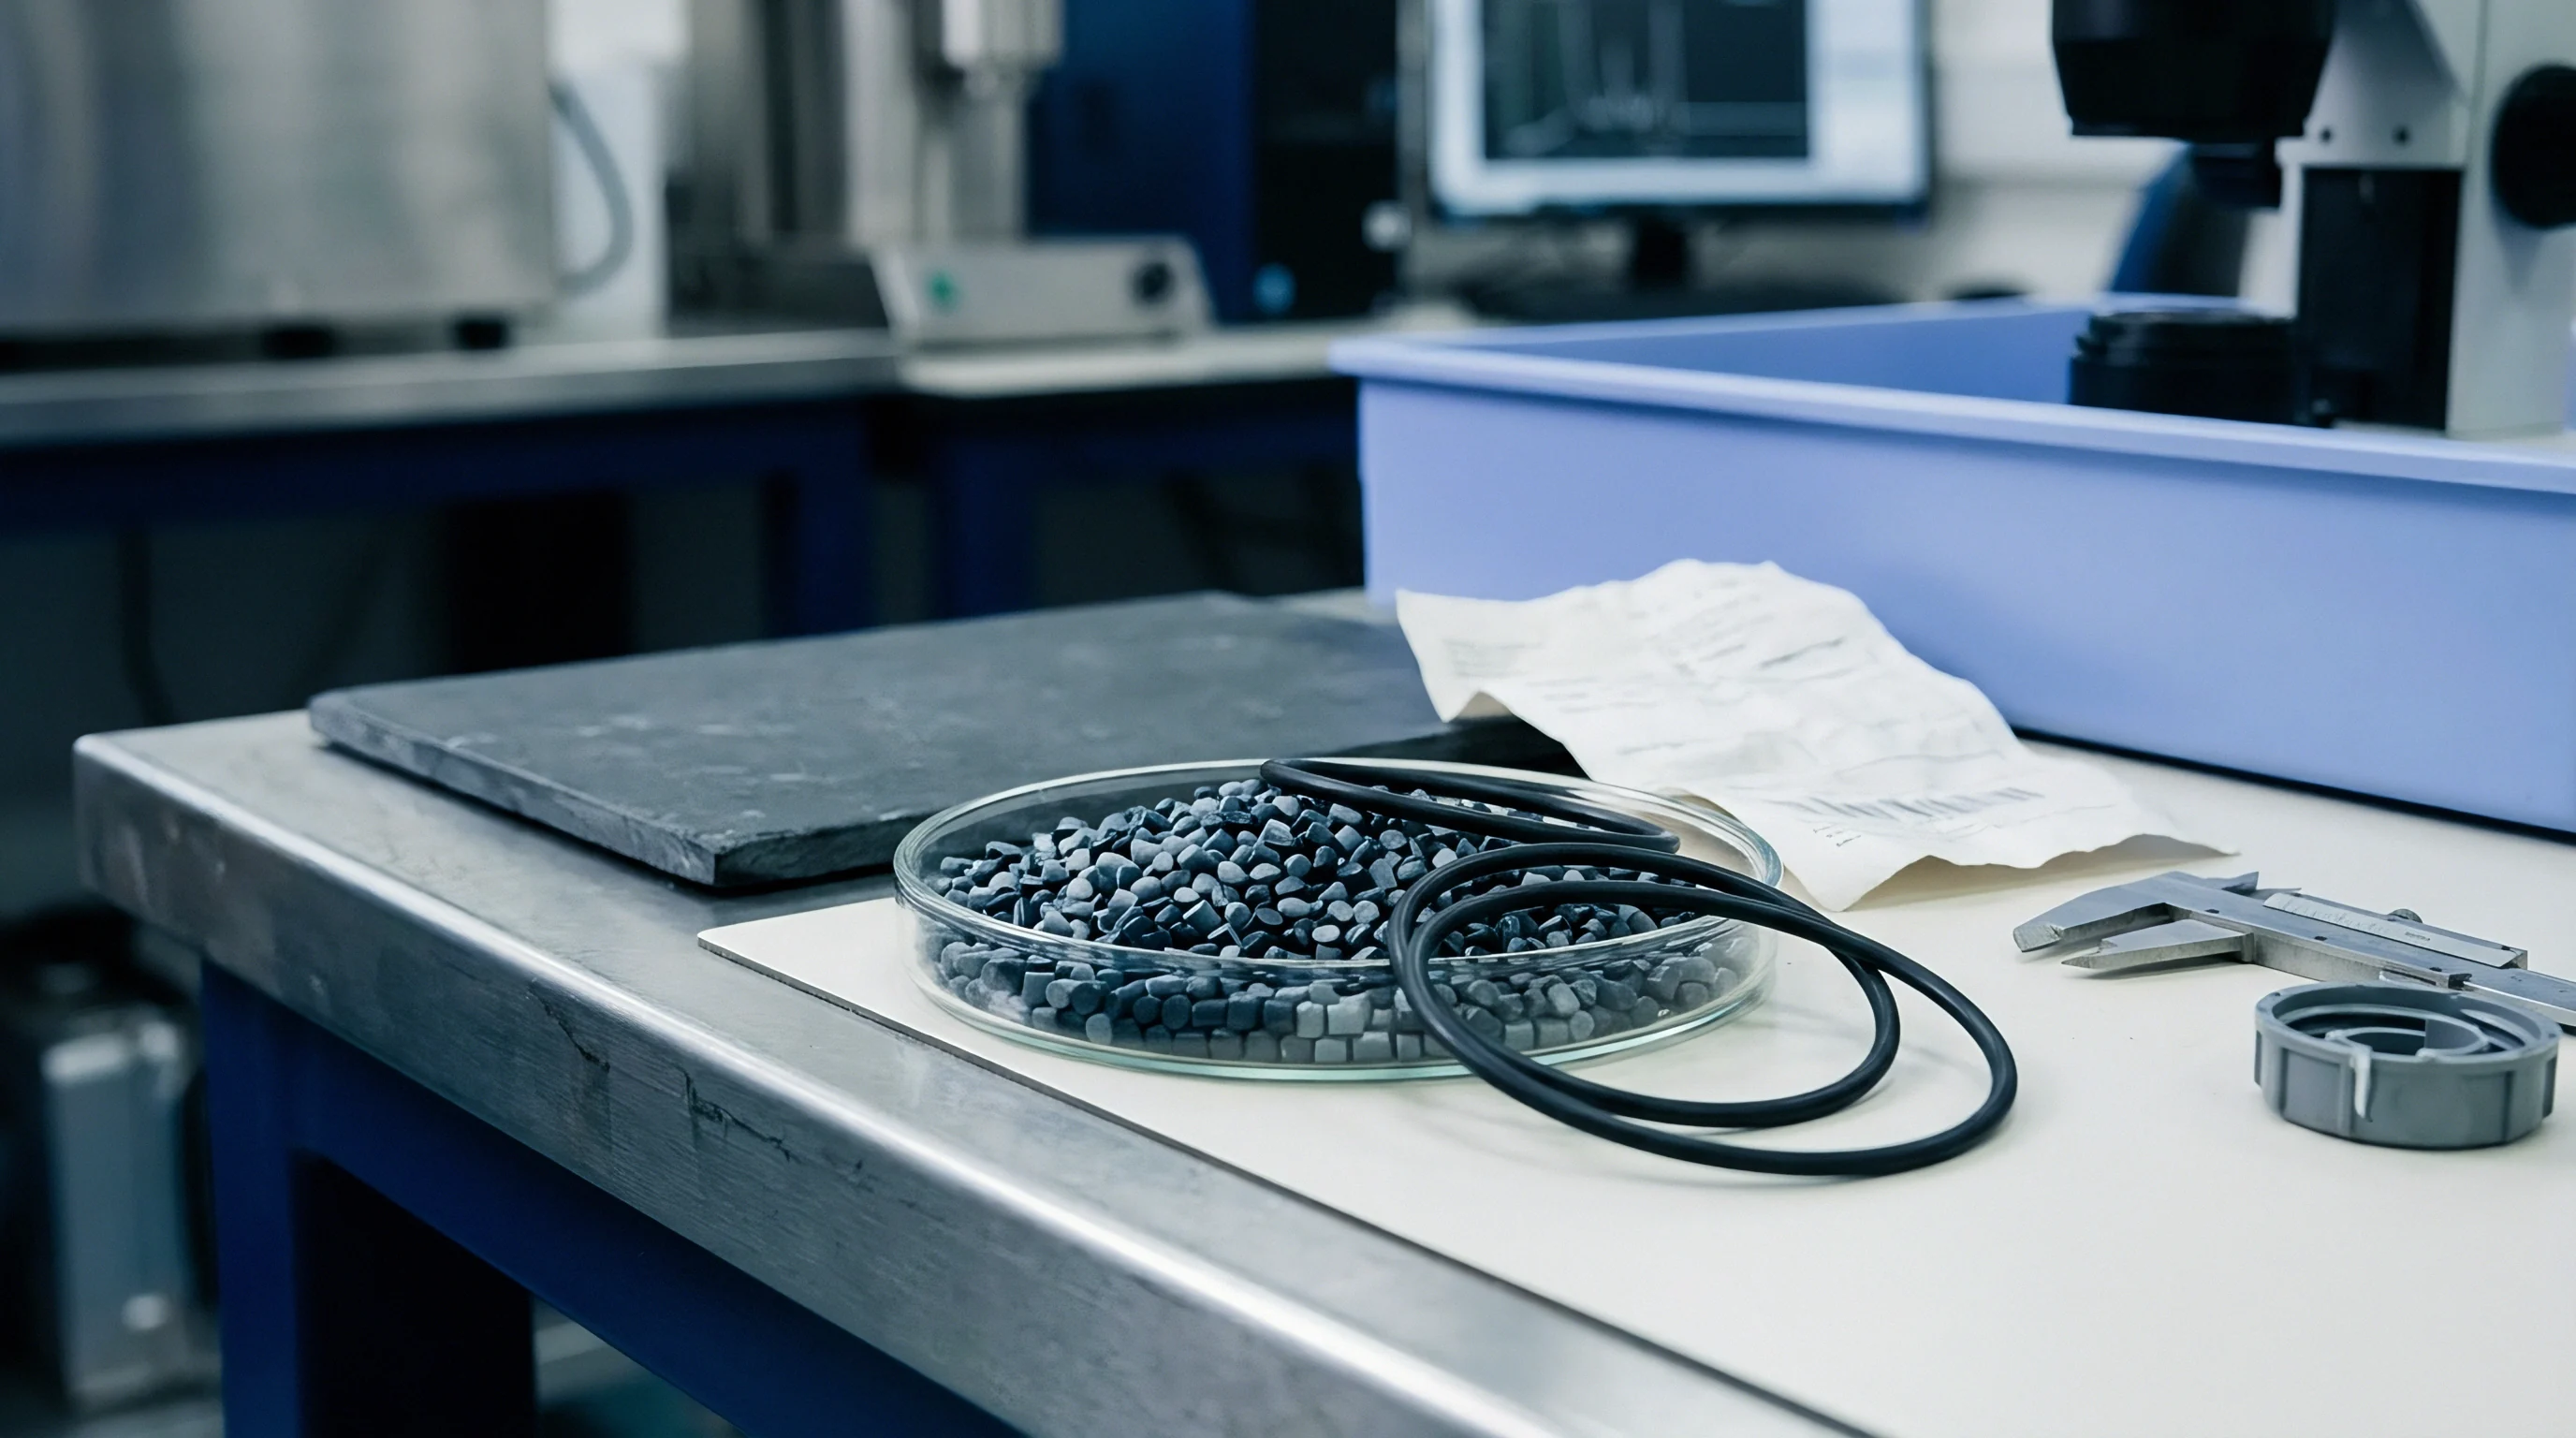
Automated gravimetric blenders drift when masterbatch pellet geometry diverges from the virgin base resin. Virgin pellets often arrive as spherical micro-pellets, whereas slip masterbatch frequently ships as cylindrical strands. Bulk density mismatches between these two feed streams cause auger metering fluctuations exceeding fifteen percent when hopper throat pressures change.
Real-time ATR FTIR testing catches feeding drift within fifteen minutes of startup. Traditional solvent extraction methods take six hours, during which an extrusion line operating at six hundred kilograms per hour produces thirty-six hundred kilograms of non-compliant film. Scrapping that startup material wastes raw resin value and ties up regrind re-pelletizing capacity.
| Operational Parameter | Nominal Target | Dosing Drift (+500 ppm) | Critical Failure (+1000 ppm) | Commercial Unit Metric |
|---|---|---|---|---|
| Active Erucamide Level | 1000 | 1500 | 2000 | Parts Per Million |
| 5% Masterbatch Let-Down | 2.0 | 3.0 | 4.0 | Percent of Extruder Feed |
| Incremental Additive Cost | 0.00 | 10.25 | 20.50 | USD per Metric Ton Film |
| Static Coefficient of Friction | 0.20 | 0.14 | 0.11 | ASTM D1894 Value |
| Web Tracking Stability | Stable | Intermittent Telescope | Severe Roll Wandering | Slitter Rewind Observation |
| Heat Seal Pouch Failure Rate | 0.02 | 0.15 | 1.85 | Percent of Sealed Units |
| Annual Line Material Loss | Base Cost | 123000 | 246000 | USD per 12000-Ton Line |

Friction Coefficient Specification Failure
A packaging converter buying sixty-gauge barrier web contracts for a static coefficient of friction between 0.18 and 0.22 under ASTM D1894. A lot measuring 0.32 causes bag-forming machines to chatter, jam feed tubes, and tear registration marks. Conversely, a lot testing at 0.12 causes winding rolls to telescope during transit, damaging edge profiles and rendering master rolls useless for automated converting.
FTIR calibration dossiers provide verifiable evidence when resolving these supply disputes. Sled friction testing measures mechanical friction, but ambient humidity, temperature, and surface roughness alter the result independently of chemical additive levels. Surface ATR measurement isolates the chemical concentration from mechanical testing artifacts, proving whether a handling failure stems from compounding errors or environmental temperature spikes.
Commercial contracts enforcing ASTM D6953 for additive content require supplier Certificates of Analysis to state surface concentration bounds alongside bulk extraction figures, rejecting lots that miss the calibrated infrared envelope.