Evaluating Melt Flow Rate Limitations in Recycled Polypropylene Testing
Single point melt flow index testing fails to predict recycled polypropylene processing behavior due to shear thinning and contaminant induced melt instability.


Bore
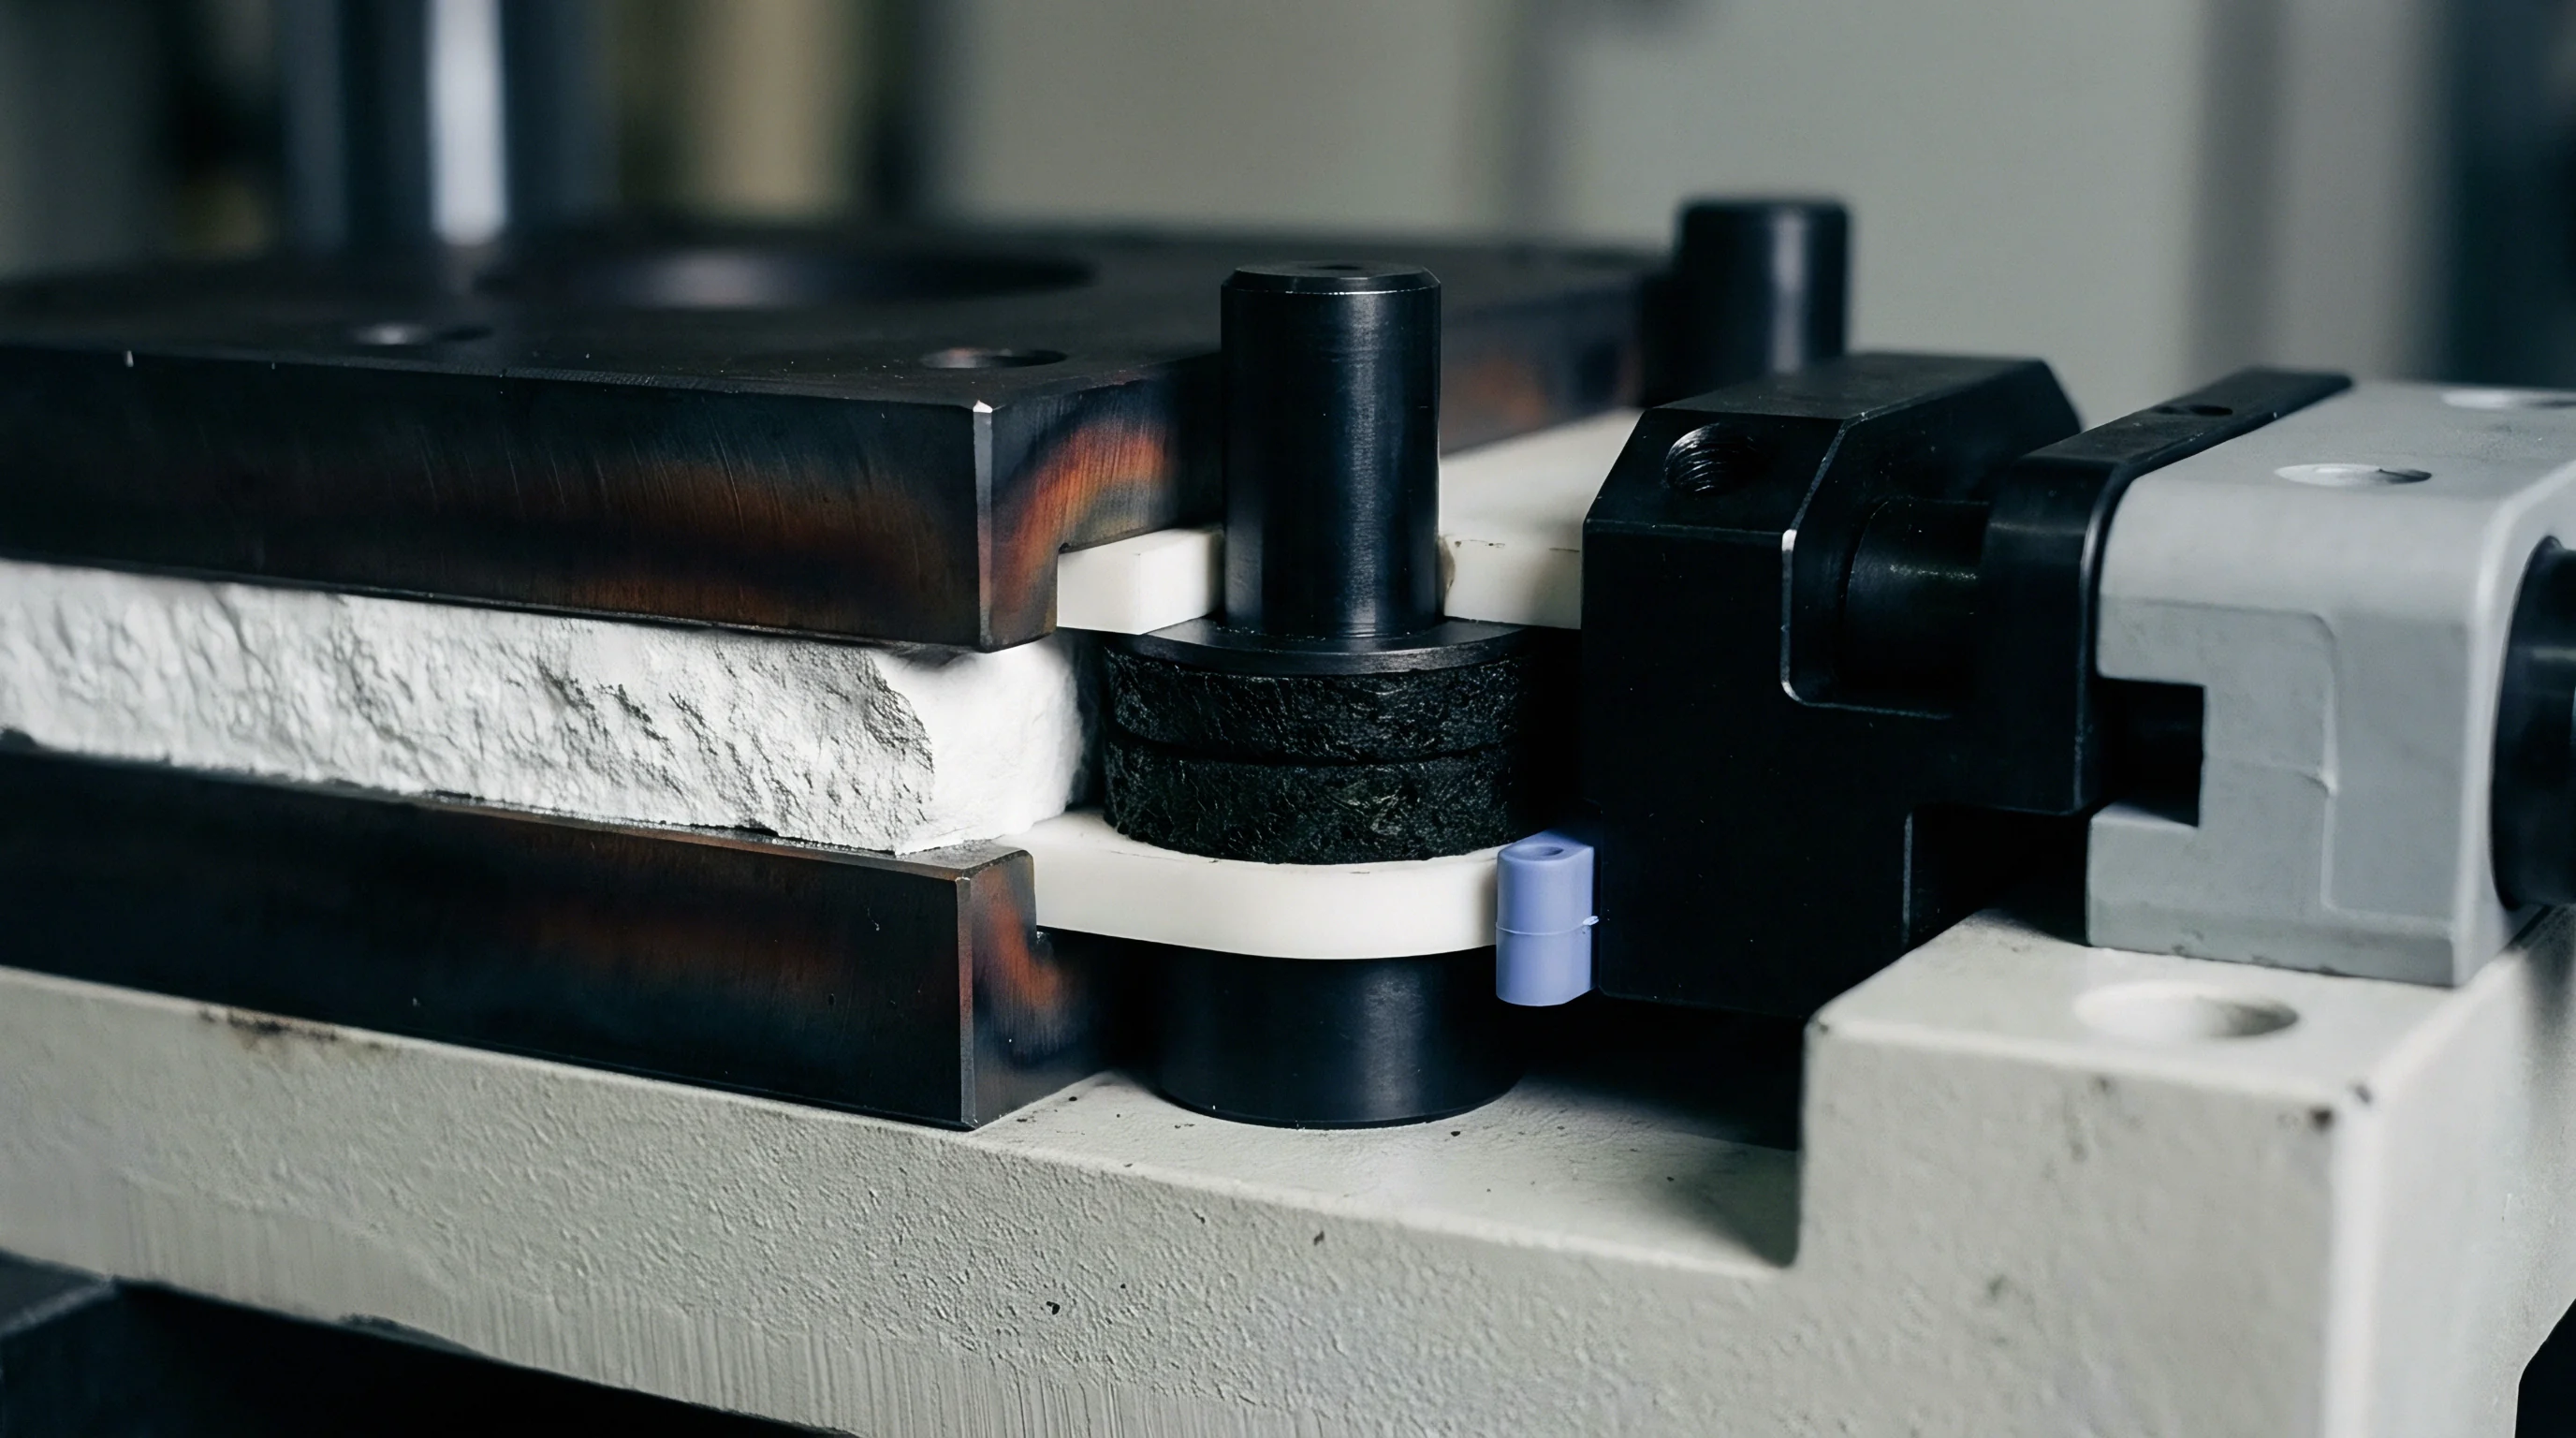
Standard extrusion plastometers measure mass discharge of molten resin through a standardized tungsten carbide die under fixed thermal and static loading. Testing governed by ISO 1133-1 and ASTM D1238 Procedure A specifies a barrel diameter of 9.550 millimeters, an orifice length of 8.000 millimeters, and an internal capillary die bore of 2.095 millimeters. For polypropylene grades, standard measurements apply a nominal temperature of 230 degrees Celsius and a dead-weight mass of 2.16 kilograms.
This setup generates a static head pressure of approximately 298 kilopascals at the die entrance. The resulting metric, expressed in grams per 10 minutes, reflects a single point on the steady-state flow curve of the polymer.
Melt flow rate indexers operate under minimal deformation rates. Bench indexers evaluate resin movement under gravitational and static mechanical loading, generating nominal shear rates between 1 and 50 reciprocal seconds. Commercial processing equipment subjects molten polypropylene to far higher physical forces during part fabrication.
High-speed injection moulding tools force material through thin runners, gates, and thin-walled cavity geometries at shear rates spanning 1,000 to 100,000 reciprocal seconds. Sheet and film extrusion lines process material across shear ranges of 100 to 1,000 reciprocal seconds, while blow moulding extrusion operates between 10 to 500 reciprocal seconds.
Single-point bench tests fail to predict behavior at commercial processing speeds because polypropylene is a non-Newtonian, shear-thinning fluid. Shear thinners flow faster. Under increasing deformation rates, entangled polymer chains align along the flow field, reducing molecular friction and lowering apparent melt viscosity.
Two polypropylene lots displaying an identical melt flow rate of 12.0 grams per 10 minutes at 230 degrees Celsius under 2.16 kilograms can exhibit divergent viscosity profiles when accelerated to 10,000 reciprocal seconds inside an injection mold runner.

Plastometer Mechanics and Single Point Constraints
Extrusion barrel geometry imposes physical boundaries on testing precision. Temperature gradients within the heating cylinder can distort flow figures if heater bands vary by more than 0.2 degrees Celsius along the test section. Thermal history alters viscosity.
In virgin resin production, linear molecular structures produce predictable velocity profiles through the standard 2.095 millimeter capillary die. Melt flow rate calculations rely on measuring the extruded mass over a timed interval or recording piston displacement distance using automated optical encoders specified in ISO 1133-2.
Automated displacement logging reduces manual operator cutting errors, yet the underlying hydraulic limitation remains unchanged. A single load indexer cannot alter shear rate during a test run. The test captures fluid performance solely under creeping flow conditions.
When evaluating post-consumer or post-industrial recycled polypropylene, low-shear data points obscure structural variations in molecular weight distribution, thermal history degradation, and cross-phase blending.
| Process Equipment | Test Standard / Mode | Applied Shear Rate Range (s⁻¹) | Primary Flow Regime |
|---|---|---|---|
| Extrusion Plastometer | ISO 1133-1 / ASTM D1238 | 1 to 50 | Zero-shear Newtonian plateau |
| Profile Extrusion | Single / Twin Screw | 10 to 200 | Low shear transition zone |
| Film Blowing | Annular Die Extrusion | 100 to 1,000 | Intermediate power-law zone |
| Injection Moulding | High-Pressure Cavity Gate | 1,000 to 50,000 | High shear power-law regime |
| Thin-Wall Moulding | High-Speed Hydraulic Tooling | 10,000 to 100,000 | Extreme high shear thinning limit |

Shear Rate Discrepancy across Processing Equipment
Commercial conversion machinery subjects polymer melts to velocity gradients exceeding three orders of magnitude above bench viscometer conditions. The apparent viscosity of polypropylene decreases non-linearly as shear rate climbs, governed by the power-law index in the Carreau-Yasuda model. Virgin polypropylenes typically possess a power-law index between 0.35 and 0.45.
Recycled polypropylene lots often display index shifts between 0.25 and 0.55 due to main-chain scission, variable polydispersity, and contaminant inclusion.
Pressure drops alter output. A recycled polypropylene batch exhibiting an identical bench index to a virgin control lot often displays lower melt strength and reduced viscosity under tool gate conditions. High shear rates break intermolecular physical entanglements, causing the recycled material to thin rapidly.
Excess flow velocity causes tool flashing, cavity over-packing, and severe part warping. Conversely, recycled lots containing cross-linked gel fractions or high molecular weight fractions exhibit unexpected resistance to flow at high shear rates, causing short shots in multi-cavity tooling. Resin suppliers frequently attribute observed flow discrepancies to ambient laboratory humidity or minor barrel temperature calibration offsets rather than structural resin changes.


Scission
Reprocessing post-consumer polyolefins subjects the matrix to cumulative thermal-mechanical stress that cleaves high molecular weight backbone polymer chains. Polypropylene degrades primarily through tertiary carbon radical formation caused by heat, mechanical shear, and trace oxygen during conversion cycles. The free radicals undergo beta-scission, shortening the average chain length and shifting the overall molecular weight distribution to lower mass thresholds.
Polymer chain length dictates viscosity.
Chain scission alters the fundamental relationship between zero-shear melt viscosity and weight-average molecular weight. For linear polypropylene, zero-shear viscosity scales with weight-average molecular weight raised to the 3.4 power. Small reductions in high molecular weight fractions cause significant drops in melt resistance under low-shear conditions.
A 10 percent reduction in weight-average molecular weight can produce a 40 percent increase in measured melt flow rate on a bench indexer.

Thermal Degradation and Molecular Weight Shifts
Peroxide residues, legacy catalysts, and repeated extrusion passes accelerate chemical cleavage along tertiary carbon sites within the polymer backbone. Controlled degradation, or visbreaking, is widely used in virgin polypropylene manufacturing to narrow molecular weight distribution and boost flow performance. Uncontrolled thermal-mechanical degradation in recycled streams lacks this chemical uniformity.
Recycled lots undergo stochastic chain scission during recycling, producing an asymmetric broadening or narrowing of the molecular weight distribution depending on the history of the feedstock.
Melt flow numbers drift. Reprocessing packaging scrap through multiple melt cycles yields escalating flow indices accompanied by deteriorating mechanical strength. Tensile strength at yield drops as molecular weight decreases, while notched Izod impact resistance falls precipitously due to loss of tie-molecules bridging amorphous and crystalline domains.
Standard melt flow rate testing detects the increased flow velocity caused by chain shortening. The measurement cannot distinguish between uniform chain-length reduction and severe degradation hidden by high molecular weight tail fractions.
An melt flow rate increase exceeding 2.5 grams per 10 minutes at 230 degrees Celsius under a 2.16 kilogram load indicates severe main-chain cleavage during compounding.

Polydispersity Variance in Post Consumer Fractions
Heterogeneous collection streams combine virgin feedstocks, post-industrial scrap, and reclaimed packaging grades featuring vastly disparate initial chain lengths. The ratio of weight-average molecular weight to number-average molecular weight defines the polydispersity index of the compound. Virgin injection moulding grades maintain a narrow polydispersity index between 3.5 and 5.0.
Post-consumer recycled polypropylene fractions frequently exhibit polydispersity values ranging from 6.0 to 12.0 due to mixed feedstock origin.
A broad polydispersity index creates distinct rheological anomalies. High molecular weight tails provide melt strength and elasticity under low deformation, while low molecular weight fractions act as internal lubricants that accelerate shear thinning under high deformation. Single-point melt flow rate tests fail to capture polydispersity broadness.
Two recycled lots exhibiting an identical flow index of 25 grams per 10 minutes can possess completely different polydispersity profiles. The lot with the broader distribution experiences earlier shear thinning during tool cavity filling, while the narrower lot requires higher injection hydraulic pressures to fill identical wall sections. Whether thermal stabilizer replenishment during compounding can suppress secondary scission without altering non-linear viscoelastic relaxation rates remains an open problem in polyolefin recovery.


Filler
Inorganic particulates and cross-linked rubber domains suspended within reclaimed resins fundamentally disrupt capillary flow dynamics during standard index measurements. Post-consumer polypropylene waste streams frequently contain mineral additives including talc, calcium carbonate, and glass fibers, alongside high-density polyethylene and ethylene-propylene-diene monomer impact modifiers. These secondary phases fail to form a homogeneous solution with the polypropylene matrix, creating a multi-phase suspension in the melt state.
Particulate matter alters internal friction during passage through the standard 2.095 millimeter plastometer die. Talc increases apparent density. Rigid mineral fillers increase apparent melt viscosity under low-shear conditions by displacing polymer volume and restricting chain mobility.
During standard bench index testing, particulate presence reduces extruded mass, yielding a lower melt flow rate figure that suggests a higher molecular weight than the matrix actually possesses.

Why Does Single Load Melt Flow Fail for Recycled Fractions?
Standardized single weight capillary testing assumes uniform Newtonian plateau response across all pellet charges entering the test barrel. Recycled polypropylene blends deviate from this assumption due to phase separation, particulate drag, and wall slip inside the capillary die. When a multi-phase compound enters the narrow die entrance, rigid particulates migrate toward the central flow axis, creating an additive-depleted layer along the die wall.
This wall slip effect artificially accelerates fluid velocity, distorting the mass discharge reading.
Cross-linked polyolefin gels and un-melted high-density polyethylene domains create physical blockages at the capillary entrance. Gel particles clog orifices. Small gel agglomerates transiently restrict the effective cross-sectional area of the die, causing un-predictable flow rate reductions during timed cuts.
Standard test methods specified in ASTM D1238 cannot isolate particle drag from true molecular viscosity, rendering single-load bench values unreliable for multi-phase recyclates.
Standard supply terms under ISO 19069-2 assign full commercial liability to the compounder when non-polyolefin particulate contamination alters barrel discharge velocities by more than fifteen percent.
Multiphase Dynamics and Inorganic Interference
Mineral additives such as talc, calcium carbonate, and glass fibers increase internal flow resistance while altering thermal conductivity inside the heating cylinder. Elevated thermal conductivity speeds up sample melting within the bench plastometer barrel, reducing necessary preheat times compared to unfilled virgin resins. Standard testing specifications require a fixed 420-second preheat period.
If filled recycled resins melt completely within 180 seconds, prolonged exposure to 230 degrees Celsius accelerates thermal degradation prior to measurement, inflating the reported flow index.
- Capillary Entrance Plugging occurs when rubber gels or un-melted contaminants accumulate at the die entry land, restricting volumetric discharge and artificially deflating reported flow rate values.
- Wall Slip Acceleration arises when phase-separated low-viscosity fractions or wax additives migrate to the metal die surface, causing plug flow that inflates calculated melt indices.
- Filler Density Distortions manifest when high-density minerals inflate extruded cut mass, leading to calculated volumetric flow discrepancies if mass-to-volume conversion factors are uncorrected.
- Phase Segregation Deformation happens when dispersed polyethylene domains deform elastically through the die entry, creating transient flow rate spikes during timed sample cuts.
Ignoring inorganic contaminant drag during bench index testing leads to tool flash, short shots, and unplanned mold cleaning cycles that drain plant profitability.


Capillary
Advanced rheological characterization relies on high-pressure extrusion systems capable of generating variable piston speeds and continuous shear rate sweeps. Capillary rheometers employ precision-bored barrels equipped with hydraulic or electromechanical drives capable of applying force across multiple decades of shear. Testing under ISO 11443 provides comprehensive flow curves across shear rates from 10 to 50,000 reciprocal seconds, bridging the measurement gap between bench testing and conversion processing.
Multi-weight extrusion plastometers offer a cost-effective intermediate alternative to full capillary rheometry. ISO 1133-1 Method B enables automated flow rate ratio determinations by sequentially applying varied load masses, such as 2.16 kilograms, 5.0 kilograms, and 21.6 kilograms, during a single barrel charge. The ratio of high-load melt flow to low-load melt flow yields a non-dimensional shear sensitivity index.
This ratio reflects the steepness of the flow curve and provides direct insight into molecular weight distribution broadness without requiring complex rotational rheometers.

Capillary Rheometry and Multi Load Ratio Testing
ISO 1133-1 Method B flow rate ratio determinations employ dual or triple load steps during a single barrel discharge sequence. Applying a 2.16 kilogram weight followed by a 10.0 kilogram weight shifts the effective wall shear stress within the capillary die. The flow rate ratio, calculated by dividing the melt flow rate under heavy load by the melt flow rate under light load, highlights non-Newtonian flow divergence between lots.
Die swelling skews results.
Executing continuous shear rate sweeps via high-pressure capillary rheometers allows compounders to calculate Bagley and Rabinowitsch corrections. The Bagley correction eliminates entry and exit pressure losses caused by melt elasticity at the capillary die land, while the Rabinowitsch correction adjusts apparent shear rates to true shear rates for non-Newtonian fluids. These corrections are essential when characterising recycled polypropylene compounds containing elastomeric modifiers or broad polydispersity distributions.
- Charge the temperature-controlled rheometer barrel with 35 grams of dried recycled polypropylene pellets to prevent moisture-induced voids.
- Compact the pellet bed mechanically using a manual packing rod to eliminate trapped air pockets within the melt column.
- Thermal equilibrium must be maintained for exactly 360 seconds at 230 degrees Celsius prior to initiating piston travel.
- Drive the piston downward at programmed volumetric speeds to generate stepped shear rates from 50 to 10,000 reciprocal seconds.
- Record transducer wall pressure data at each speed step after steady-state pressure profiles achieve stabilization.
- Apply Bagley pressure correction factors derived from dual-die capillary length-to-diameter measurements.

Oscillatory Shear and Zero Shear Viscosity
Rotational rheometers applying small-amplitude oscillatory measurements characterize linear viscoelastic properties without destroying the delicate entanglement network of recycled chains. Parallel plate and cone-and-plate geometries deform molten samples under sinusoidal shear strains within the linear viscoelastic region. Frequency sweeps performed from 0.1 to 500 radians per second yield the storage modulus, loss modulus, and complex viscosity profiles.
Extrapolating complex viscosity to zero frequency yields the zero-shear viscosity, a fundamental molecular parameter directly proportional to weight-average molecular weight. The crossover modulus, where storage and loss moduli intersect, measures polydispersity directly. A lower crossover modulus frequency indicates higher weight-average molecular weight, while a higher crossover modulus elasticity value confirms broader polydispersity.
Dynamic mechanical testing identifies phase-separated polyethylene contaminants in recycled polypropylene through distinct secondary relaxation peaks observed in loss factor loss tangent curves.
Higher polydispersity indices produce steeper viscosity drops as shear rates approach commercial processing speeds.
| Test Methodology | Primary Output Metric | Shear Rate Domain (s⁻¹) | Sensitivity to Recycled Anomalies |
|---|---|---|---|
| Single-Load MFR (ISO 1133) | Melt Flow Index (g/10 min) | 1 to 50 | Low: Blind to shear thinning and polydispersity |
| Multi-Load MFR (ISO 1133-B) | Flow Rate Ratio (Dimensionless) | 10 to 500 | Moderate: Detects molecular weight broadness |
| Capillary Rheometry (ISO 11443) | True Viscosity Curve (Pa·s) | 100 to 50,000 | High: Maps true conversion behavior accurately |
| Oscillatory Shear (ASTM D4440) | Storage/Loss Modulus (Pa) | 0.01 to 100 | Extreme: Isolates elasticity, gels, and cross-linking |
Polymer melts featuring broader molecular weight distributions exhibit lower viscosity under high shear despite showing identical flow rates under static bench weights.


Tolerance
Industrial compounding specification targets establish acceptable limits for batch dispersion to maintain process stability on high-speed conversion lines. Virgin polypropylene specifications maintain tight melt flow rate tolerances, typically within plus or minus 10 percent of the target nominal value. Reclaimed resin streams exhibit wider historical lot-to-lot variation, often spanning plus or minus 25 to 40 percent around target averages when unblended.
Incoming lot qualification requires statistical process control frameworks designed for non-Gaussian batch distributions. Standard Gaussian statistics assume symmetrical distribution around a central mean. Recycled polyolefin lots frequently display skewed or bimodal flow index distributions resulting from mixed post-consumer collecting sources.
Establishing process capability indices based on non-normal statistics prevents incorrect lot approvals or unwarranted rejections.

Statistical Process Limits for Incoming Lot Qualification
Establishing upper and lower control thresholds on receiving dockets prevents processing instability prior to hopper discharge. Control limits calculated from historical running averages set outer boundaries beyond which resin cannot process without tool adjustment. For a nominal 20 gram per 10 minute injection moulding grade recyclate, setting upper control limits at 24 grams per 10 minutes and lower control limits at 16 grams per 10 minutes provides a workable operating envelope for standard hydraulic machinery.
Pellet size varies widely. Physical pellet asymmetry in regrind or re-granulated lots causes variable packing density inside the plastometer barrel. Irregular pellet geometry entraps air bubbles during manual loading, producing prematurely accelerated piston displacement during automated optical tracking.
To mitigate measurement noise, quality assurance procedures require pre-melting pellet samples under mechanical pressure prior to starting official test timing runs.
Incoming pellet lots exhibit wider statistical distribution bounds than virgin virgin homopolymer batches across identical manufacturing shifts.

Certificate Analysis Verification and Sampling Schemes
Discrepancies between supplier test documentation and receiving laboratory measurements frequently stem from unrecorded moisture, thermal history during transit, or non-representative sampling methods. Certificates of analysis provided by recyclers often cite single measurements performed on composite silo samples. Composite sampling masks localized contamination pockets and lot stratification within bulk shipping containers.
- Representative Bulk Sampling calls for extracting thief samples across five vertical zones within bulk railcars or octave boxes to capture lot stratification.
- Moisture Content Verification dictates measuring volatiles via Karl Fischer titration below 0.05 percent prior to barrel loading to prevent steam void creation during index testing.
- Preheat Thermal Control requires setting exact 360 to 420 second thermal equilibration timers to guarantee uniform melt density throughout the capillary cylinder.
- Multi-Cut Mass Averaging involves taking a minimum of three synchronized sample cuts per test run to average out local filler distribution fluctuations.
Incorporating ASTM D1238 Procedure B displacement volume logging into purchasing specifications eliminates manual weighing bias and forces automatic rejection of irregular cut-off pellets.


Contract
Commercial purchase agreements governing reprocessed polyolefin shipments rely on tightly defined physical parameters to hedge financial exposure against off-spec material. Relying solely on single-point melt flow rate numbers in supply schedules leaves buyers vulnerable to processing failures. Sourcing contracts must bind flow index values directly to specific load conditions, test standards, and secondary viscoelastic criteria.
Landed cost calculations must reflect the true performance yield of recycled pellets rather than raw invoice price per metric tonne. Off-spec melt flow rates cause cavity flashing, elevated scrap rates, extended cycle times, and tool damage. An initial raw material cost saving of 200 USD per tonne evaporates immediately if flow instability increases molding scrap rates by 5 percent or extends cycle times by 3 seconds per injection shot.

Specification Clause Construction for Recycled Streams
Precision terminology embedded within supply schedules defines precise testing conditions, standard references, and acceptable variance windows before title transfer occurs. Contracts specify ISO 1133-1 testing at 230 degrees Celsius under 2.16 kilograms as the baseline reference, supplemented by a secondary high-load test at 10.0 kilograms. The resulting flow rate ratio must remain within a stipulated band to guarantee consistent shear-thinning characteristics during part molding.
Testing errors cost money. Including explicit testing protocol clauses prevents legal disputes regarding testing methodology differences between supplier and buyer laboratories. Specifications mandate specimen preparation techniques, sample drying conditions, and calibration intervals for laboratory extrusion plastometers.
Purchase dockets designate an independent certified test laboratory to perform binding arbitral analysis when incoming lot verification contradicts the supplier certificate of analysis.
| Parameter / Condition | Baseline Spec (20 g/10 min) | Minor Deviation (+25% MFR) | Severe Deviation (+50% MFR) |
|---|---|---|---|
| Delivered Pellet Cost (USD/tonne) | $1,400 | $1,400 (Full Invoice) | $1,120 (Reclassed / Discounted) |
| Moulding Cycle Time (seconds) | 22.0 | 23.5 (Cooling Extended) | 26.0 (Flashing Compensated) |
| Part Defect / Scrap Rate (%) | 1.5% | 4.5% | 12.0% |
| Net Conversion Scrap Cost (USD/tonne) | $21 | $63 | $168 |
| Effective Landed Cost Per Good Part | $0.420 | $0.458 (+9.0%) | $0.512 (+21.9%) |

Commercial Penalties and Rejection Frameworks
Financial remedies for non-conforming polymer shipments scale according to the severity of flow deviation and necessary compounding adjustments. Price adjustment matrices established in master service agreements set tiered financial discounts based on incoming test results. Minor deviations within plus or minus 15 to 20 percent of target MFR trigger automatic unit price reductions to offset processing modifications.
Deviations exceeding 30 percent grant the buyer full right of lot rejection at the supplier’s sole expense, including freight and silo handling costs.
Pricing adjustments based on tiered melt flow deviations protect converted margins while providing clear financial boundaries for compounders delivering reprocessed polyolefin grades.