Pressure Dependent Polymer Viscosity Shifts within Sub-Micron Cavity Channels
Pressure-dependent viscosity increases melt resistance in sub-micron channels while wall slip and extreme shear thinning lower dynamic injection requirements.

Gap
Polymer melt driven through flow paths narrower than one thousand nanometers experiences extreme physical constraints. Macro-scale fluid dynamics models assume continuous, homogeneous fluid properties across the entire channel cross section. That assumption fails when channel depth approaches the physical dimension of individual polymer molecules.
In sub-micron channels, spatial boundary effects, wall surface interactions, and localized mechanical shear gradients fundamentally change how molten plastic behaves during injection.

Confinement Mechanics across Sub-Micron Channel Heights
When feature dimensions approach the physical size of coiled polymer macromolecules, standard continuum fluid mechanics principles break down. The radius of gyration for common commercial polymers such as polypropylene, polycarbonate, and polymethyl methacrylate ranges between ten and fifty nanometers. In a channel measuring two hundred nanometers in height, the flow channel accommodates only four to twenty uncoiled molecular chains across its thickness.
Spatial confinement forces these long-chain molecules to orient parallel to the mold walls, reducing intramolecular entanglements and altering the effective mechanical state of the melt.
Melt fills fast. The velocity profile across a sub-micron channel ceases to follow the classical parabolic profile dictated by standard Newtonian or simple power-law fluid models. Instead, an immobilised or highly oriented boundary layer forms immediately adjacent to the cavity surface, while the central core experiences extreme shear rates often exceeding 106 s-1.
This stark velocity gradient creates localized dissipation of thermal energy alongside structural modification of the polymer matrix.
| Channel Scale Range | Dominant Shear Rate Range | Primary Rheological Phenomena | Boundary Layer Impact |
|---|---|---|---|
| Macro (> 1.0 mm) | 102 – 104 s-1 | Shear thinning, thermal cooling non-uniformity | Negligible relative flow area impact |
| Micro (10 to 1000 µm) | 104 – 106 s-1 | High shear rates, viscous dissipation heating | Velocity profile alteration at margins |
| Sub-micron (100 to 1000 nm) | 106 – 108 s-1 | Piezoviscosity, steric exclusion, wall slip | Dominates effective channel cross section |
| Nano (< 100 nm) | > 108 s-1 | Chain disentanglement, molecular filtering | Complete breakdown of continuum models |
Process engineers sizing tooling for micro-fluidic devices or optical nanostructures cannot rely on standard material data sheets. Standard viscosity curves measured via capillary rheometry according to ASTM D3835 or ISO 1133 capture bulk flow properties under moderate shear rates and low hydrostatic pressures. In sub-micron cavities, two competing physical phenomena alter the apparent flow resistance: hydrostatic pressure elevating melt viscosity, and extreme shear thinning coupled with wall slip lowering flow resistance.
- Capillary Freezing occurs when the ratio of surface area to volume accelerates thermal energy transfer, solidifying the polymer skin before cavity filling completes.
- Steric Chain Exclusion reduces the local concentration of macromolecular entanglements near mold walls, forming a low-viscosity wall layer.
- Pressure-Induced Shear Resistance increases the core viscosity of the melt as local cavity pressures rise beyond one hundred megaspascals.
- Molecular Weight Filtering restricts longer polymer chains from entering narrow sub-micron lateral gates, causing compositional segregation within the molded part.
Designing sub-micron flow channels around macro-scale capillary rheometer data guarantees frozen fill paths before the packing phase opens.
Piezoviscosity
Compressibility under severe hydraulic force fundamentally alters how thermoplastic polymers flow inside restricted tooling geometries. High cavity pressures pack polymer chains together, compressing the free volume between molecules. As free volume diminishes, molecular mobility drops, resulting in a exponential rise in dynamic viscosity.
This pressure-dependent viscosity shift, known as piezoviscosity, becomes a governing factor when driving melt into sub-micron channel networks where local injection pressures routinely exceed 150 MPa.
Hydrostatic Compression and Free Volume Reduction
Injecting polymer melt at pressures exceeding one hundred megaspascals forces flexible molecular chains into closer spatial proximity. Free volume theory describes how liquid polymer viscosity correlates directly with the available space between molecular segments. Under atmospheric pressure, thermal energy supplies adequate free volume for chain segments to slide past one another.
Under micro-injection pressures, hydrostatic compaction restricts chain rotation, artificially elevating the effective glass transition temperature of the polymer melt.
Pressure alters free volume. The mathematical description of piezoviscosity widely relies on the Barus equation or the modified Cross-WLF model. The Barus relation states:
η(p) = η0 exp(β p)
Where η(p) represents the dynamic viscosity at hydrostatic pressure p, η0 is the viscosity at zero gauge pressure, and β is the pressure-viscosity coefficient expressed in reciprocal Pascals (Pa-1). For common engineering thermoplastics like polycarbonate, β ranges between 1.5 × 10⁻⁸ Pa-1 and 3.0 × 10⁻⁸ Pa-1. Under a cavity injection pressure of 180 MPa, the mathematical exponent yields a dynamic viscosity increase of twenty to forty times the baseline value measured at atmospheric pressure.
At hydrostatic pressures exceeding 120 MPa, polypropylene melt exhibits a fourfold increase in zero-shear viscosity compared to atmospheric test conditions.
In standard Cross-WLF viscosity calculations, the pressure dependence appears inside the glass transition temperature shift equation, governed by the D3 parameter:
Tk(p) = D2 + D3 p
When tool designers set the D3 coefficient to zero in filling simulations, the software assumes pressure has no impact on viscosity. In conventional wall sections of two millimeters, this oversight introduces minor pressure drop errors under five percent. In sub-micron flow channels, where pressure gradients reach extreme peaks to push melt across high-aspect-ratio features, omitting D3 underestimates the required injection pressure by forty to sixty percent.
Consider a practical rheological comparison inside a sub-micron channel measuring 400 nm in height and 10 mm in length. Assume a high-flow grade of polycarbonate processed at 290 degrees Celsius with a baseline melt viscosity of 50 Pa·s at an extreme shear rate of 105 s-1.
Under Case A, pressure dependence is neglected (D3 = 0). The calculated pressure drop across the 10 mm channel length based purely on viscous dissipation and wall shear stress yields a required cavity injection pressure of 85 MPa.
Under Case B, pressure dependence is included using a measured D3 coefficient of 1.8 × 10⁻⁷ K/Pa. As the melt enters the channel under high force, the local viscosity increases exponentially along the upstream section. The true calculated pressure drop across the 400 nm channel climbs to 142 MPa. Melt viscosity skyrockets instantly.
Flow resistance climbs fast. Without accounting for piezoviscosity, the selected injection moulding press lacks sufficient pressure capability, resulting in premature short shots and incomplete feature replication.
Ignoring hydrostatic compression parameters during tool sizing leads directly to damaged cavity inserts, blown nozzle tips, and unrecoverable capital expenditure.
Microstructure
Macromolecular orientation along sub-micron channel boundaries creates non-uniform physical density profiles across the flow path cross section. While hydrostatic pressure works to compress free volume and increase dynamic viscosity, physical shear forces near the metal boundary act in opposition. Extremely high shear rates align polymer chains parallel to the flow direction, stripping away entanglements and promoting wall slip.
The net viscosity observed within a sub-micron cavity channel represents a dynamic equilibrium between pressure-induced thickening and shear-induced thinning combined with interfacial slippage.
Does Piezoviscosity Dominate over Wall Slip at Sub-Micron Scale?
Decoupling hydrostatic pressure effects from interfacial boundary movement represents one of the most technical challenges in micro-rheology. At macro scales, fluid velocity at the solid tool surface equals zero, satisfying the classic no-slip boundary condition. In sub-micron channels, the shear stress at the wall exceeds the critical shear stress threshold of the polymer melt.
Once wall shear stress passes this critical value, typically between 0.1 MPa and 0.3 MPa depending on polymer architecture, the melt slides directly along the tool surface.
Wall friction drops. Shear thinning acts concurrently. The Navier slip model quantifies this phenomenon by defining a slip velocity us proportional to the wall shear stress τw raised to a power exponent m:
us = k τwm
Where k is the interfacial slip coefficient. Alternatively, the slip length b defines the hypothetical distance inside the tool wall where the extrapolated velocity profile drops to zero. In sub-micron cavities, measured slip lengths range from 50 nm to over 500 nm.
When the slip length approaches or exceeds the channel half-height, fluid transport shifts from shear-dominated Poiseuille flow toward plug flow.
Melt flows faster along highly polished hydrophobic insert walls than along unpassivated tool steel surfaces.
Quantifying wall slip velocity in sub-micron slit dies requires a structured capillary experimental procedure under controlled thermal conditions.
- Mount a high-precision slit die insert with adjustable wall gaps ranging from 200 nm to 2000 nm onto a high-pressure capillary rheometer barrel.
- Heat the assembly to target processing temperature and heat soak for twenty minutes to achieve complete thermal equilibrium.
- Perform pressure-controlled extrusion runs across multiple gap heights while maintaining identical wall shear stress levels.
- Record the volumetric flow rate output for each gap height at specified pressure setpoints.
- Plot apparent shear rate against the reciprocal of channel height for constant shear stress values, generating a Mooney slip plot.
- Extract the wall slip velocity from the slope of the linear fit across the varying channel heights.
- Calculate the true non-slip polymer melt viscosity by subtracting the slip-induced flow rate from total volumetric output.
Polymer chains align. Interfacial slip effectively offsets a portion of the viscosity increase caused by hydrostatic pressure. When polymer molecules slip along the mold surface, the total shear rate inside the bulk fluid drops, which lowers viscous dissipation heating while simultaneously reducing the total pressure required to fill the feature.
However, if the tool temperature drops below the polymer glass transition point, the wall boundary freezes instantly, extinguishing wall slip and allowing piezoviscosity to dominate flow resistance.
Whether macromolecular chain scission at 107 s-1 shear rates permanently alters wall slip dynamics remains an open debate in experimental polymer physics.


Simulation
Predicting melt progression through ultra-small cavity channels requires numerical modeling engines that incorporate non-linear material parameters. Standard commercial injection moulding simulation software defaults to simplified cross-viscosity formulations designed for macro-scale components. These standard solvers often ignore both pressure viscosity dependence (D3 = 0) and wall slip phenomena (us = 0).
To obtain accurate predictions for sub-micron channel filling, process engineers must modify mathematical models to solve coupled conservation equations incorporating pressure, temperature, shear rate, and wall boundary velocity variations.
Coupled Numerical Solvers and Boundary Layer Discretization
Finite element meshes designed for conventional injection moulding parts completely fail to resolve velocity gradients near ultra-small channel walls. Standard automatic meshing protocols place two to three elements across the wall thickness. For a sub-micron feature measuring 500 nm across, resolving the steep shear zone and boundary slip layer demands at least ten to sixteen prismatic boundary layer elements adjacent to the cavity surface.
Viscosity calculations fail otherwise. Short shots result. Numerical simulation accuracy depends directly on how the software handles temperature-pressure-shear coupling inside each element mesh volume.
The modified Cross-WLF model represents the baseline standard for micro-injection flow simulation:
η(T, p, dotγ) = fracη0(T, p)1 + left( fracη0 dotγτ right)1-n
Where τ represents the critical shear stress level marking the transition to shear thinning, n is the power-law index, and η0(T,p) is defined as:
η0(T, p) = D1 exp left
| Model Formulation | Pressure Coefficient (D3) | Wall Slip Boundary | Predicted vs Actual Pressure Error |
|---|---|---|---|
| Standard Cross-WLF | Set to 0 | No-slip (us = 0) | 35% to 55% Underestimation |
| Piezoviscous Cross-WLF | Measured value | No-slip (us = 0) | 20% to 40% Overestimation |
| Full Navier-Slip Cross-WLF | Set to 0 | Navier slip active | 30% to 50% Underestimation |
| Coupled Piezoviscous-Slip | Measured value | Navier slip active | Within 5% to 8% Accuracy |
Friction generates local heat. As polymer melt shear rate climbs within sub-micron channels, viscous dissipation generates significant localized thermal energy. This shear heating lowers melt viscosity in the core flow, partially compensating for pressure-induced viscosity growth.
However, if heat transfer through the highly conductive steel cavity wall exceeds the rate of viscous heat generation, the thermal boundary layer expands rapidly into the core, causing immediate channel freeze-off.
Tooling procurement contracts that omit specified D3 pressure-viscosity coefficient verification leave moulders liable for unfillable cavity geometries.
A structured auditing routine ensures that simulation reports reflect true sub-micron physics before cutting tool steel.
- Verify Material Characterization Data to confirm the D3 pressure dependency coefficient was physically measured using high-pressure capillary rheometry rather than estimated.
- Inspect Mesh Density Profiles to confirm a minimum of twelve node layers span the sub-micron channel gap height.
- Audit Wall Boundary Conditions to ensure slip velocity routines activate when predicted shear stress exceeds the threshold limit for the selected polymer.
- Evaluate Thermal Solver Coupling to check that viscous dissipation calculations run on transient microsecond timesteps during channel filling.
Software vendors frequently claim that default material databases account for non-Newtonian flow without disclosing that pressure coefficients are set to zero.


Tooling
Precision cavity insert manufacturing fixes both the dimensional fidelity and the economic viability of micro-moulded components. Transferring nanometer-scale geometry into durable tool steel or nickel inserts requires advanced machining methods. The resulting cavity surface topography directly influences polymer wall slip, heat transfer rates, demoulding forces, and overall scrap rates during serial production runs.
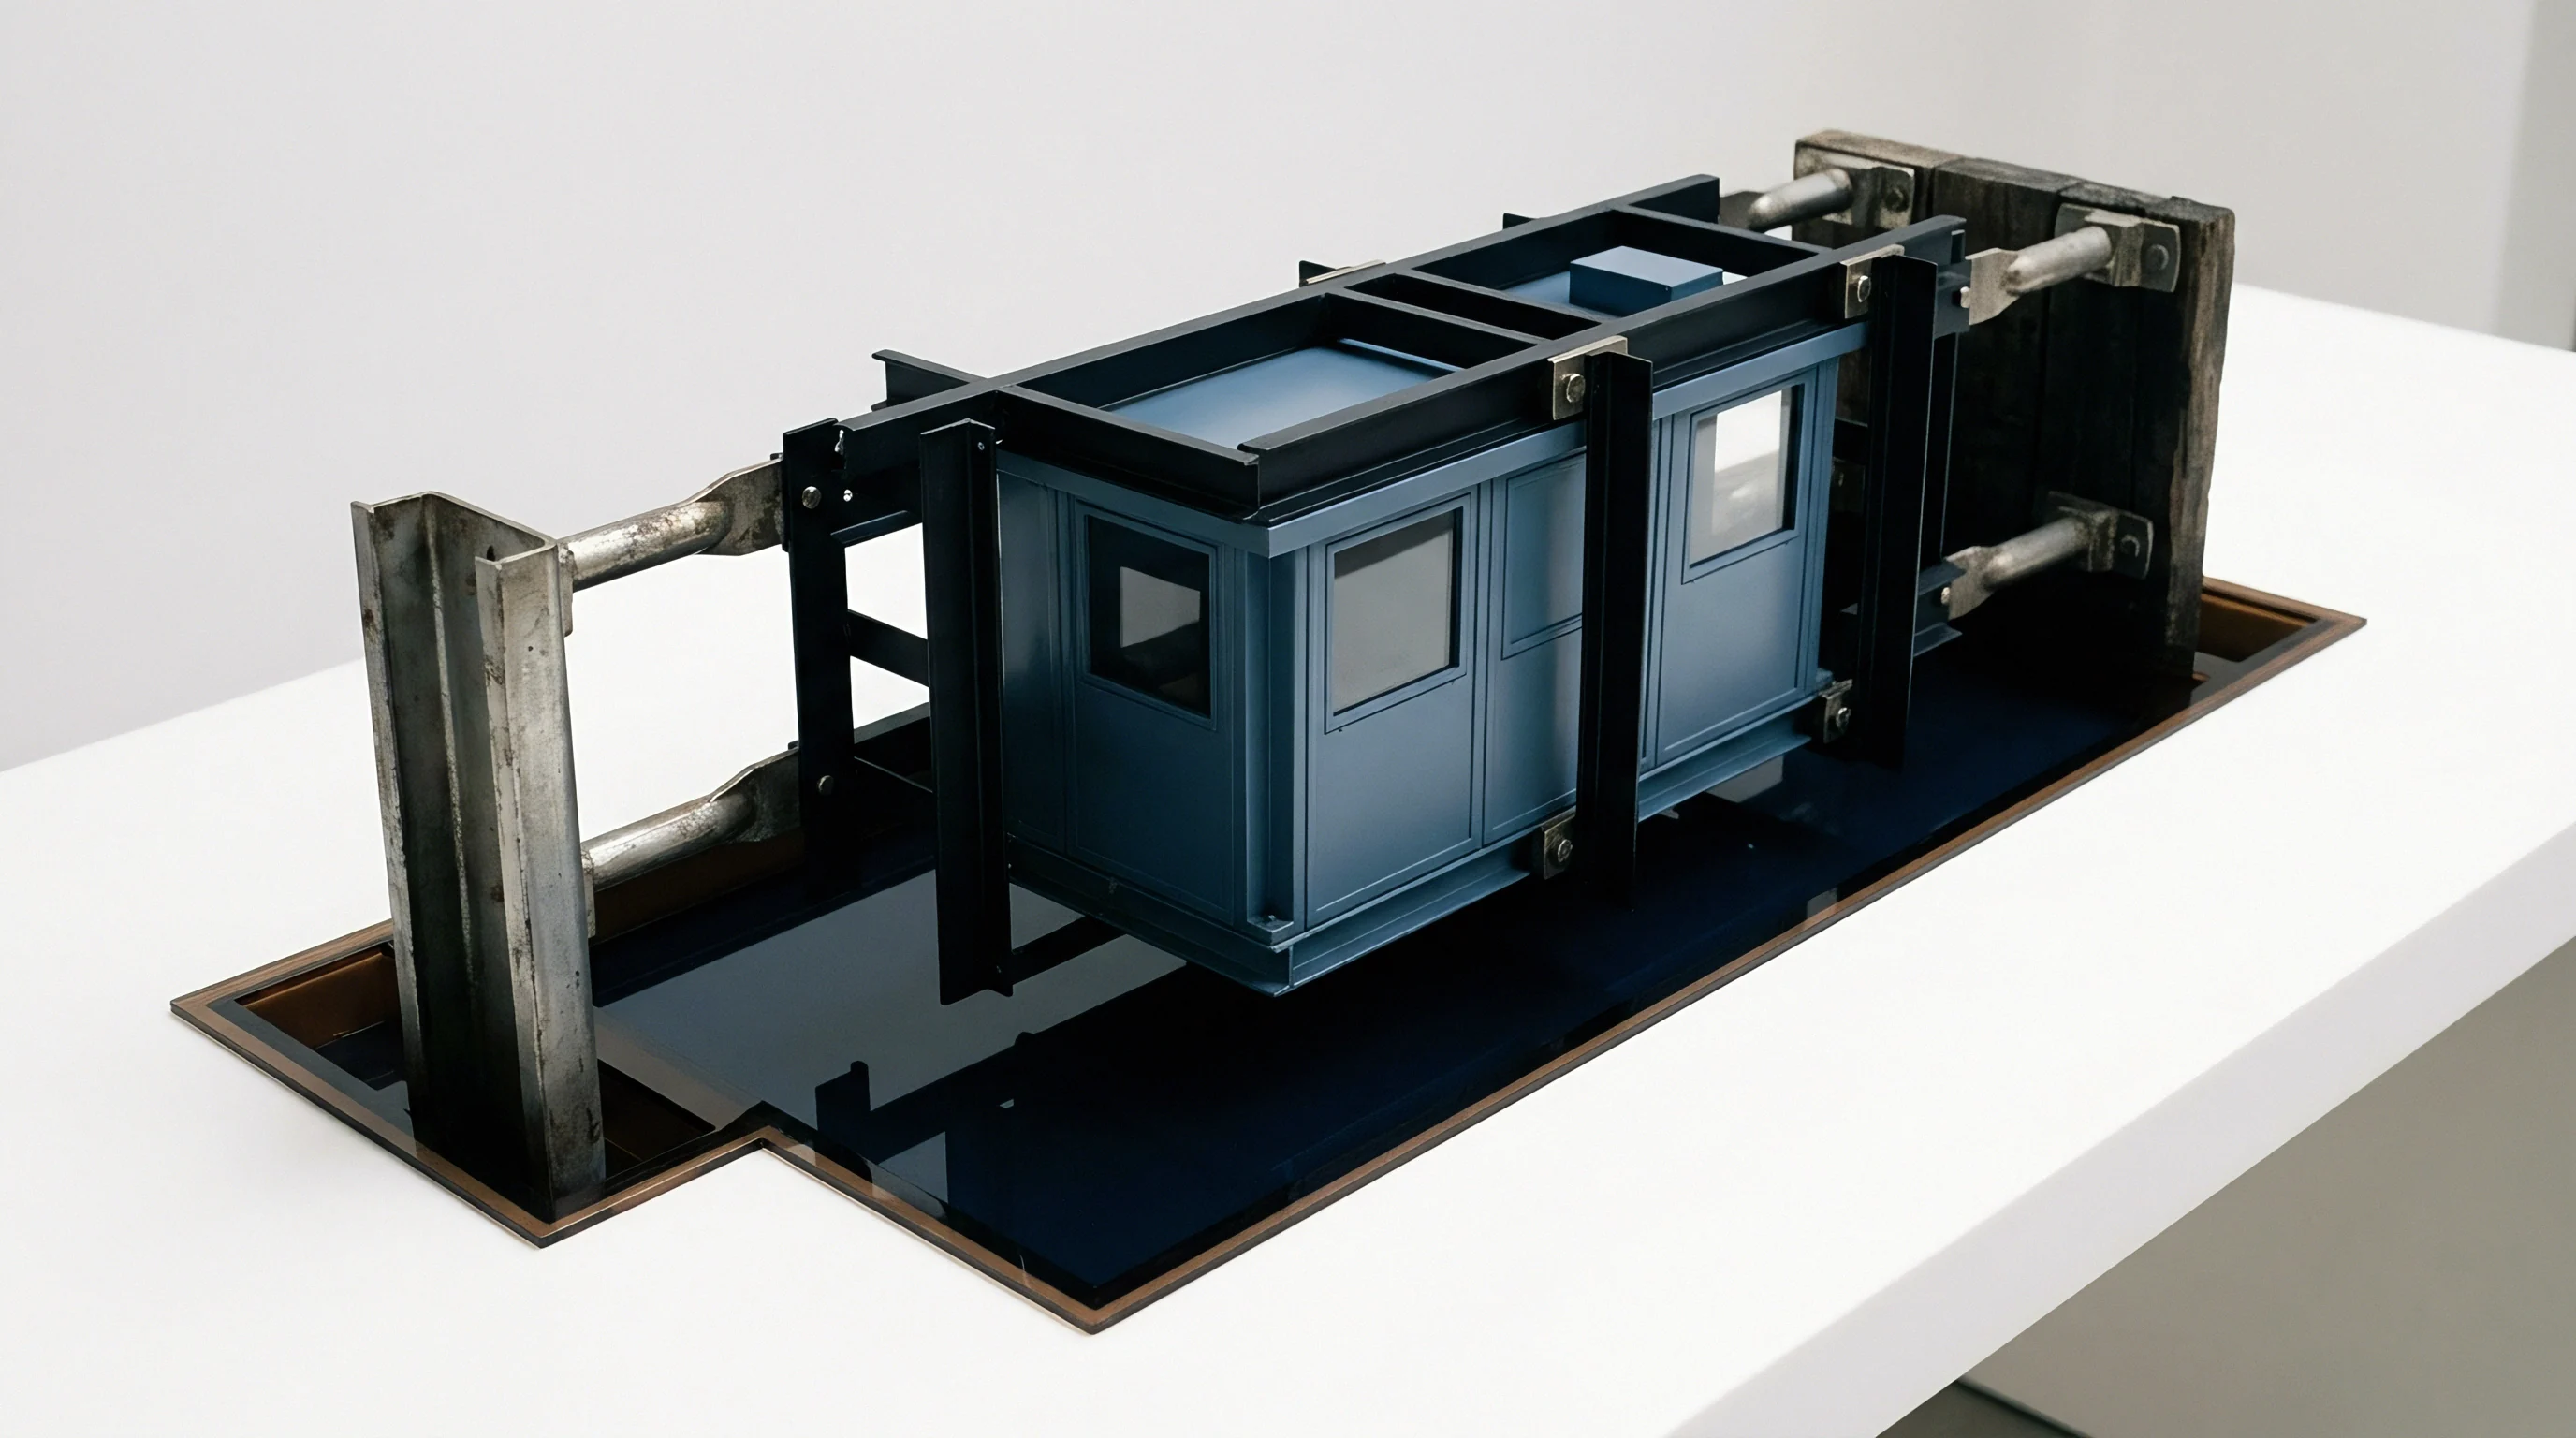
Insert Fabrication Surface Finish and Amortized Unit Economics
Machining nanoscale channels into tool steel demands specialized ultra-precision processes that directly drive up initial capital expenditure. Conventional CNC milling and wire EDM techniques lack the spatial resolution required for clean sub-micron definition. Toolmakers rely instead on focused ion beam milling, femtosecond laser ablation, electroformed nickel replication, and single-crystal diamond turning.
Cavity inserts must achieve a surface roughness (Ra) below 5 nanometers to prevent mechanical interlocking between the shrinking polymer matrix and microscopic steel asperities.
| Insert Machining Method | Achievable Surface Roughness (Ra) | Relative Cavity Cost Index | Typical Insert Wear Life |
|---|---|---|---|
| Femtosecond Laser Ablation | 10 – 25 nm | 1.0x | 100,000 shots |
| Focused Ion Beam (FIB) Milling | 2 – 5 nm | 3.5x | 25,000 shots |
| Electroformed Nickel Insertion | 1 – 3 nm | 1.8x | 50,000 shots |
| Single Crystal Diamond Turning | 0.5 – 2 nm | 2.2x | 200,000 shots |
Steel temperature governs freeze. Cavity inserts require inspection. Due to the high surface-area-to-volume ratio of sub-micron channels, standard static mold heating fails to maintain open flow paths long enough for complete filling.
Moulders implement dynamic mold temperature control, or variotherm processing, heating the cavity surface above the polymer glass transition temperature during injection, then rapidly chilling the steel below freeze point before ejection.
Variotherm rapid thermal cycling doubles tooling capital requirements while cutting reject rates on sub-micron feature replication by eighty percent.
Tolerance windows shrink. Yield rates dictate profitability. Integrating variotherm hardware extends cycle times by three to eight seconds per shot.
In high-volume medical or optical component manufacturing, adding cycle seconds increases piece price significantly. Tooling amortisation calculations must balance the elevated capital costs of nickel electroformed variotherm inserts against the scrap reduction achieved by preventing piezoviscosity-induced short shots.
Inclusion of DIN 16742 Grade TG3 dimensional tolerance clauses paired with mandatory ISO 294 test specimen validation establishes clear legal accountability for sub-micron feature replication yields.