Multivariant Cavity Pressure Integral Control Systems for Ultra Precision Sourcing in Optical Mouldings
Multivariant cavity pressure curve area control locks optical lens center thickness within three micrometers by compensating dynamic resin viscosity shifts.

Gate
Runner delivery geometry directly dictates the mechanical and optical properties of precision injection moulded lenses. Polymer chains passing through restricted orifices experience extreme shear rates, altering localized melt density and molecular alignment. Toolmakers machining optical cavities often position entry ports at the component perimeter, attempting to keep flow fronts uniform across the optical aperture.
That positioning introduces localized thermal gradients. Melt temperature drops during transit across the lens diameter, creating asymmetric packout conditions that manifest as astigmatic wavefront aberrations.
Plastics cooling inside micro-optical cavities exhibit severe volumetric changes as thermal gradients develop. High-precision lenses molded from amorphous resins like cyclic olefin copolymer and polymethyl methacrylate demand uniform specific volume throughout cooling. Standard runner layouts produce pressure drops that leave the cavity section farthest from the entry under-packed relative to the entry zone.
Direct pin entry on optical surfaces eliminates distance-dependent pressure drops. The resulting post-molding gate witness mark destroys the surface figure of the lens, requiring secondary diamond-turning operations that double the piece price.
Sub-millimeter edge entries reduce optical interference while increasing viscous heating during injection. Molten plastic subjected to high shear experiences transient polymer chain orientation along the flow axis. This flow-induced alignment introduces residual optical retardance adjacent to the injection location.
Controlled cavity filling demands balance between fill velocity, melt viscosity, and freeze timing. When gate freeze occurs prematurely, secondary pack pressure cannot transfer into the cavity. The optic then undergoes unconstrained volumetric shrinkage, producing surface sink and focal length shifts.
Sensors positioned within the cavity reveal the precise instant of gate freeze through pressure-time decay signatures. Placing transducers directly behind ejector pins or optical insert flanks allows setters to identify the inflection point where cavity pressure decouples from machine holding pressure. Optical tooling tolerates no freeze errors.
- Direct Sub-Gate Freeze causes rapid cavity depressurization that terminates packout prematurely, creating localized voids and focal length deviations across optical elements.
- Peripheral Tab Gate Splay generates localized shear crystallization in polycycloolefin resins, inducing severe wavefront distortion near the clear aperture perimeter.
- Excessive Gate Land Length induces high pressure loss between the runner system and the cavity, restricting the dynamic packing window required for tight thickness tolerances.
- Asymmetric Multi-Cavity Runner Routing creates unequal filling arrival times, driving distinct density distributions between primary and secondary lens impressions.
Cavity geometry defines final part performance. When tool designers choose runner diameters without accounting for viscoelastic pressure transmission, the molding press operates at the extreme edge of its process window. Toolmakers frequently defend optical wavefront variance by stating that resin lot inconsistencies lie beyond press capability.

Impulse
Calculating the mathematical product of pressure and duration across the packing phase yields a direct metric of cavity density. Traditional injection molding machines govern packout through hydraulic pressure setpoints and screw position timers. Those external variables ignore physical phenomena occurring inside the mold steel.
Compressibility of the polymer melt inside the barrel creates a variable lag between screw motion and cavity pressure response. Direct measurement eliminates hydraulic error.
Monitoring the accumulated area under the cavity pressure curve provides a direct indicator of optical part mass and center thickness. Viscosity changes from batch variations or thermal drifting shift the cavity pressure profile. When resin viscosity rises, a fixed hydraulic machine pack delivers insufficient plastic mass, leading to accelerated volumetric shrinkage.
A control system tracking the cavity pressure curve area adjusts holding pressure dynamically during the shot. The controller extends or increases pack pressure until the accumulated pressure-time value matches the master benchmark curve.
A cavity pressure curve area held within two bar-seconds yields lens center thickness repeatability within three micrometers across polycycloolefin runs.
The 0.035 bar-second pressure-time curve threshold rests on instrumented cavity trials using polycycloolefin at 280 degrees Celsius across a 500-shot sample under ISO 294 conditions. A two-degree shift in mold coolant temperature or a batch change with altered melt flow rate moves this boundary upward. Tool designers must account for these mechanical boundaries when selecting transducers.

Can Piezoelectric Sensors Resolve Wavefront Distortions?
Interferometric surface measurements correlate with localized volumetric shrinkage patterns recorded during tool packout. Piezoelectric quartz transducers installed behind optical cavity inserts register dynamic pressure rises within tenths of a millisecond. These sensors capture the compression wave as the melt front hits the cavity boundary.
Wavefront error tracks volumetric shrinkage.
Surface figure accuracy under ISO 10110 requires sub-micron compliance across the clear aperture. Transducer signals feed closed-loop algorithms that modulate hydraulic proportional valves or electric servo drives during the cycle. By controlling the cavity pressure curve area, the machine maintains stable density across the optic, suppressing spherical aberrations caused by uneven thermal contraction.
Peak pressure alone misses the plateau.

Closed Loop Dynamic Packing Algorithms
Machine controllers adjust secondary injection velocity upon sensing the exact pressure threshold inside the tooling cavity. Conventional switchover systems rely on screw stroke position. Stroke-based switchover permits cavity pressure fluctuations exceeding fifty bar when polymer melt temperature drifts by three degrees Celsius.
Dynamic pressure-time control shifts the molding process from open-loop machine parameters to closed-loop cavity physics.
The screw position indicates nominal volume. Polymer density inside the cavity dictates the refractive index of the finished optic. Maintaining cavity pressure within narrow boundaries during vitrification prevents the formation of internal density gradients.
Uneven density distributions produce refractive index variations across the component, introducing chromatic distortion and image blurring in camera modules.
| Control Architecture | Center Thickness Tolerance | RMS Wavefront Error | Focal Length Shift | Retardance Variance |
|---|---|---|---|---|
| Machine Stroke Switchover and Timed Pack | ±14.5 µm | 0.082 λ | ±0.45% | 18.2 nm |
| Cavity Peak Pressure Switchover and Timed Pack | ±8.2 µm | 0.046 λ | ±0.28% | 11.4 nm |
| Dynamic Cavity Pressure Curve Area Closed Loop | ±2.8 µm | 0.019 λ | ±0.09% | 4.1 nm |
Real-time compensation loops damp cyclic disturbances caused by regrind ratios, ambient temperature shifts, and check-ring leakage. Melt compressibility changes with barrel temperature. The procurement specification binds the moulder to DIN 16742 Group 130 linear tolerances by designating real-time cavity pressure curve area thresholds as the contractual acceptance gate for every production lot.


Variance
Multi-cavity tools exhibit distinct mechanical behaviours across separate runner branches. Minor tooling differences down to two micrometers in gate diameter alter melt distribution. Cavities closer to the central sprue fill faster and experience higher pressure than peripheral impressions.
Every cavity acts as an independent system.
Individual cavity monitoring exposes these discrepancies. In an eight-cavity mold producing smartphone camera elements, cavity pressure curves diverge under uniform machine hydraulic settings. Imbalanced cavity filling generates variations in focal length and modulation transfer function performance between parts from the same machine cycle.
Sourcing teams relying on single-cavity monitoring overlook defects occurring in parallel cavities.
Runner balance across multi-cavity tooling establishes optical wavefront uniformity across every molded part.
In high-frequency marine seismic sensing arrays, acoustic transducers register reflected pressure shockwaves whose velocity shifts with localized ocean water density and temperature layers. Polymer melt advancing through hardened tool steel mimics this acoustic transmission. Viscoelastic shockwaves reflect off runner junctions and cavity walls, creating pressure oscillation patterns that register on quartz sensors.
Why Do Hydraulic Signals Mask Imbalance?
Machine pressure gauges measure oil resistance behind the reciprocating screw rather than polymer conditions inside the mold. Pressure losses across the machine nozzle, hot runner manifold, and cold sub-runners absorb the subtle variations occurring within individual optical impressions. The hydraulic trace conceals cavity events.
Direct cavity transducers expose the mechanical reality of tool filling. A sixteen-cavity tool operating on hydraulic feedback can display a stable injection pressure curve while three cavities suffer severe under-packing due to partial runner venting blockages. Venting restrictions generate localized air counter-pressure, impeding melt advancement and degrading optical surface replication.
Decoupled Viscosity Shift Compensation
Lot-to-lot resin changes alter the molecular resistance of molten polymer entering thin optical geometries. Decoupled molding separates the filling phase from the packing phase. Real-time control systems calculate the viscosity index during the initial filling stroke, measuring the pressure-time product between two defined cavity positions.
Viscosity fluctuates across incoming resin shipments.
- Viscosity Detection occurs during initial high-speed cavity filling, registering melt flow resistance across quartz transducers before packing pressures develop.
- Volumetric Velocity Modulation instantly alters screw advance speed to maintain constant volumetric flow front progression toward the cavity extremities.
- Dynamic Switchover Triggering shifts press operation from velocity control to pressure control at ninety-eight percent cavity volumetric fill, avoiding optical flashing.
- Cavity-Specific Pack Regulation commands individual valve-gate actuators to adjust local pressure profiles, balancing density across all cavities simultaneously.
Optical interferometry tests on 50-millimeter f/1.4 meniscus elements across twenty production cycles indicate that cavity-to-cavity filling imbalance must stay below 1.8 percent to preserve lens group alignment. Unequal gate wear or runner heating circuit degradation widens this spread. Toolmakers continue to debate whether individual hot runner tip thermal trims can counteract unbalanced cavity filling without distorting optical focal lengths across extreme aspect ratios.


Ledger
Capital allocation for ultra-precision tooling hinges on the delicate trade-off between cavitation count and process capability. High-cavitation tooling lowers nominal cycle time per piece, amortizing capital machinery costs over millions of components. In optical manufacturing, high cavitation introduces mechanical failure points that inflate scrap rates.
Diamond turning achieves nanometer surface finishes.
Consider an operational scenario comparing an eight-cavity cold-runner tool against a sixteen-cavity valve-gated system producing cyclic olefin copolymer smartphone camera doublet lenses. Assume a tooling capital expense of 220,000 USD for the eight-cavity steel tool equipped with multivariant cavity pressure transducers. The sixteen-cavity hot-runner tool demands an initial capital commitment of 480,000 USD, incorporating individual servo-electric valve gates and discrete cavity sensors.
Assume a cleanroom press operating rate of 85 USD per hour, a resin raw material cost of 14.50 USD per kilogram, and a baseline production run of five million optical lenses.
The eight-cavity tool operates on an eighteen-second cycle, delivering 1,600 parts per hour at an audited scrap rate of 2.1 percent under dynamic pressure curve area control. The sixteen-cavity tool runs on a sixteen-second cycle, theoretically yielding 3,600 parts per hour. In practice, thermal balancing complexities across sixteen valve gates push the real-world scrap rate to 8.4 percent due to wavefront errors and gate-induced birefringence.
Steel tooling retains heat during cycling.
Over a five-million-piece order, the eight-cavity system consumes 3,192 machine hours, generating 3,250 kilograms of rejected polymer parts. Total operational cost for the eight-cavity run, combining machine time, scrap material, and tooling amortisation, lands at 0.106 USD per accepted optical component. The sixteen-cavity tool runs for 1,514 machine hours, but generates 13,700 kilograms of contaminated optical scrap.
Component cost lands at 0.134 USD per accepted part once tool maintenance and rejected sub-assemblies are fully factored. Cycle duration governs tooling amortisation rates.
Suppliers delivering lenses outside DIN 16742 Group 130 tolerances bear the full replacement expense of downstream sensor assemblies.
Toolmakers frequently promote a projected twelve-percent tooling maintenance savings resulting from pressure-curve closed-loop damping. Published field data remains too sparse to substantiate this exact maintenance percentage across five-year tool lifespans. Prudent buyers remove this theoretical credit from initial amortisation models, relying solely on raw scrap reduction to justify hardware capital expenditure.
| Cavity Count | Tooling Steel Investment | Sensors and Controller Hardware | Cycle Duration | Scrap Rate Across Shift | Piece Cost at One Million Units |
|---|---|---|---|---|---|
| 4-Cavity Prototype | $110,000 | $18,000 | 22.0 s | 1.4% | $0.285 |
| 8-Cavity Production | $220,000 | $32,000 | 18.0 s | 2.1% | $0.194 |
| 16-Cavity High Volume | $480,000 | $68,000 | 16.0 s | 8.4% | $0.218 |
| Data reflects hardened steel tooling running cyclic olefin polymer with electric injection presses and diamond-turned nickel inserts under ISO 14644 Class 7 cleanroom conditions. | |||||
Commercial Qualification and Batch Acceptance Terms
Sourcing contracts define lot conformance through rigorous statistical process indices calculated over continuous production shifts. Optical buyers must insist on Cpk indices exceeding 1.67 for lens center thickness and clear aperture surface regularity. Real-time cavity pressure data files serve as digital certificates of conformance for each injection cycle.
Scrap rates escalate during unattended shifts.
- Raw Transducer Curve Export Files must accompany each shipment lot, documenting peak pressure and pressure-time curve areas across every cavity.
- Tool Calibration Certificates verify annual sensor recalibration and charge amplifier sensitivity tracking against international quartz standards.
- Interferometric Inspection Records link specific cavity pressure signatures to measured optical surface aberrations and modulation transfer function values.
- Contingency Mold Maintenance Clauses mandate tooling refurbishments when mechanical cavity balance shifts beyond three percent across continuous runs.
Cleanroom conditions prevent airborne optical contamination. Miscalculating tooling amortisation against cavity count forces premature mould rebuilding, inflated unit costs, and commercial write-offs when dimensional drift ruins subsequent cleanroom coating yields.
Birefringence
Internal stress distributions within amorphous polymers determine the optical retardance of transmitted light beams. Polymer chains align under high shear. As molten plastic freezes against cold mold inserts, oriented polymer chains become locked in non-equilibrium configurations.
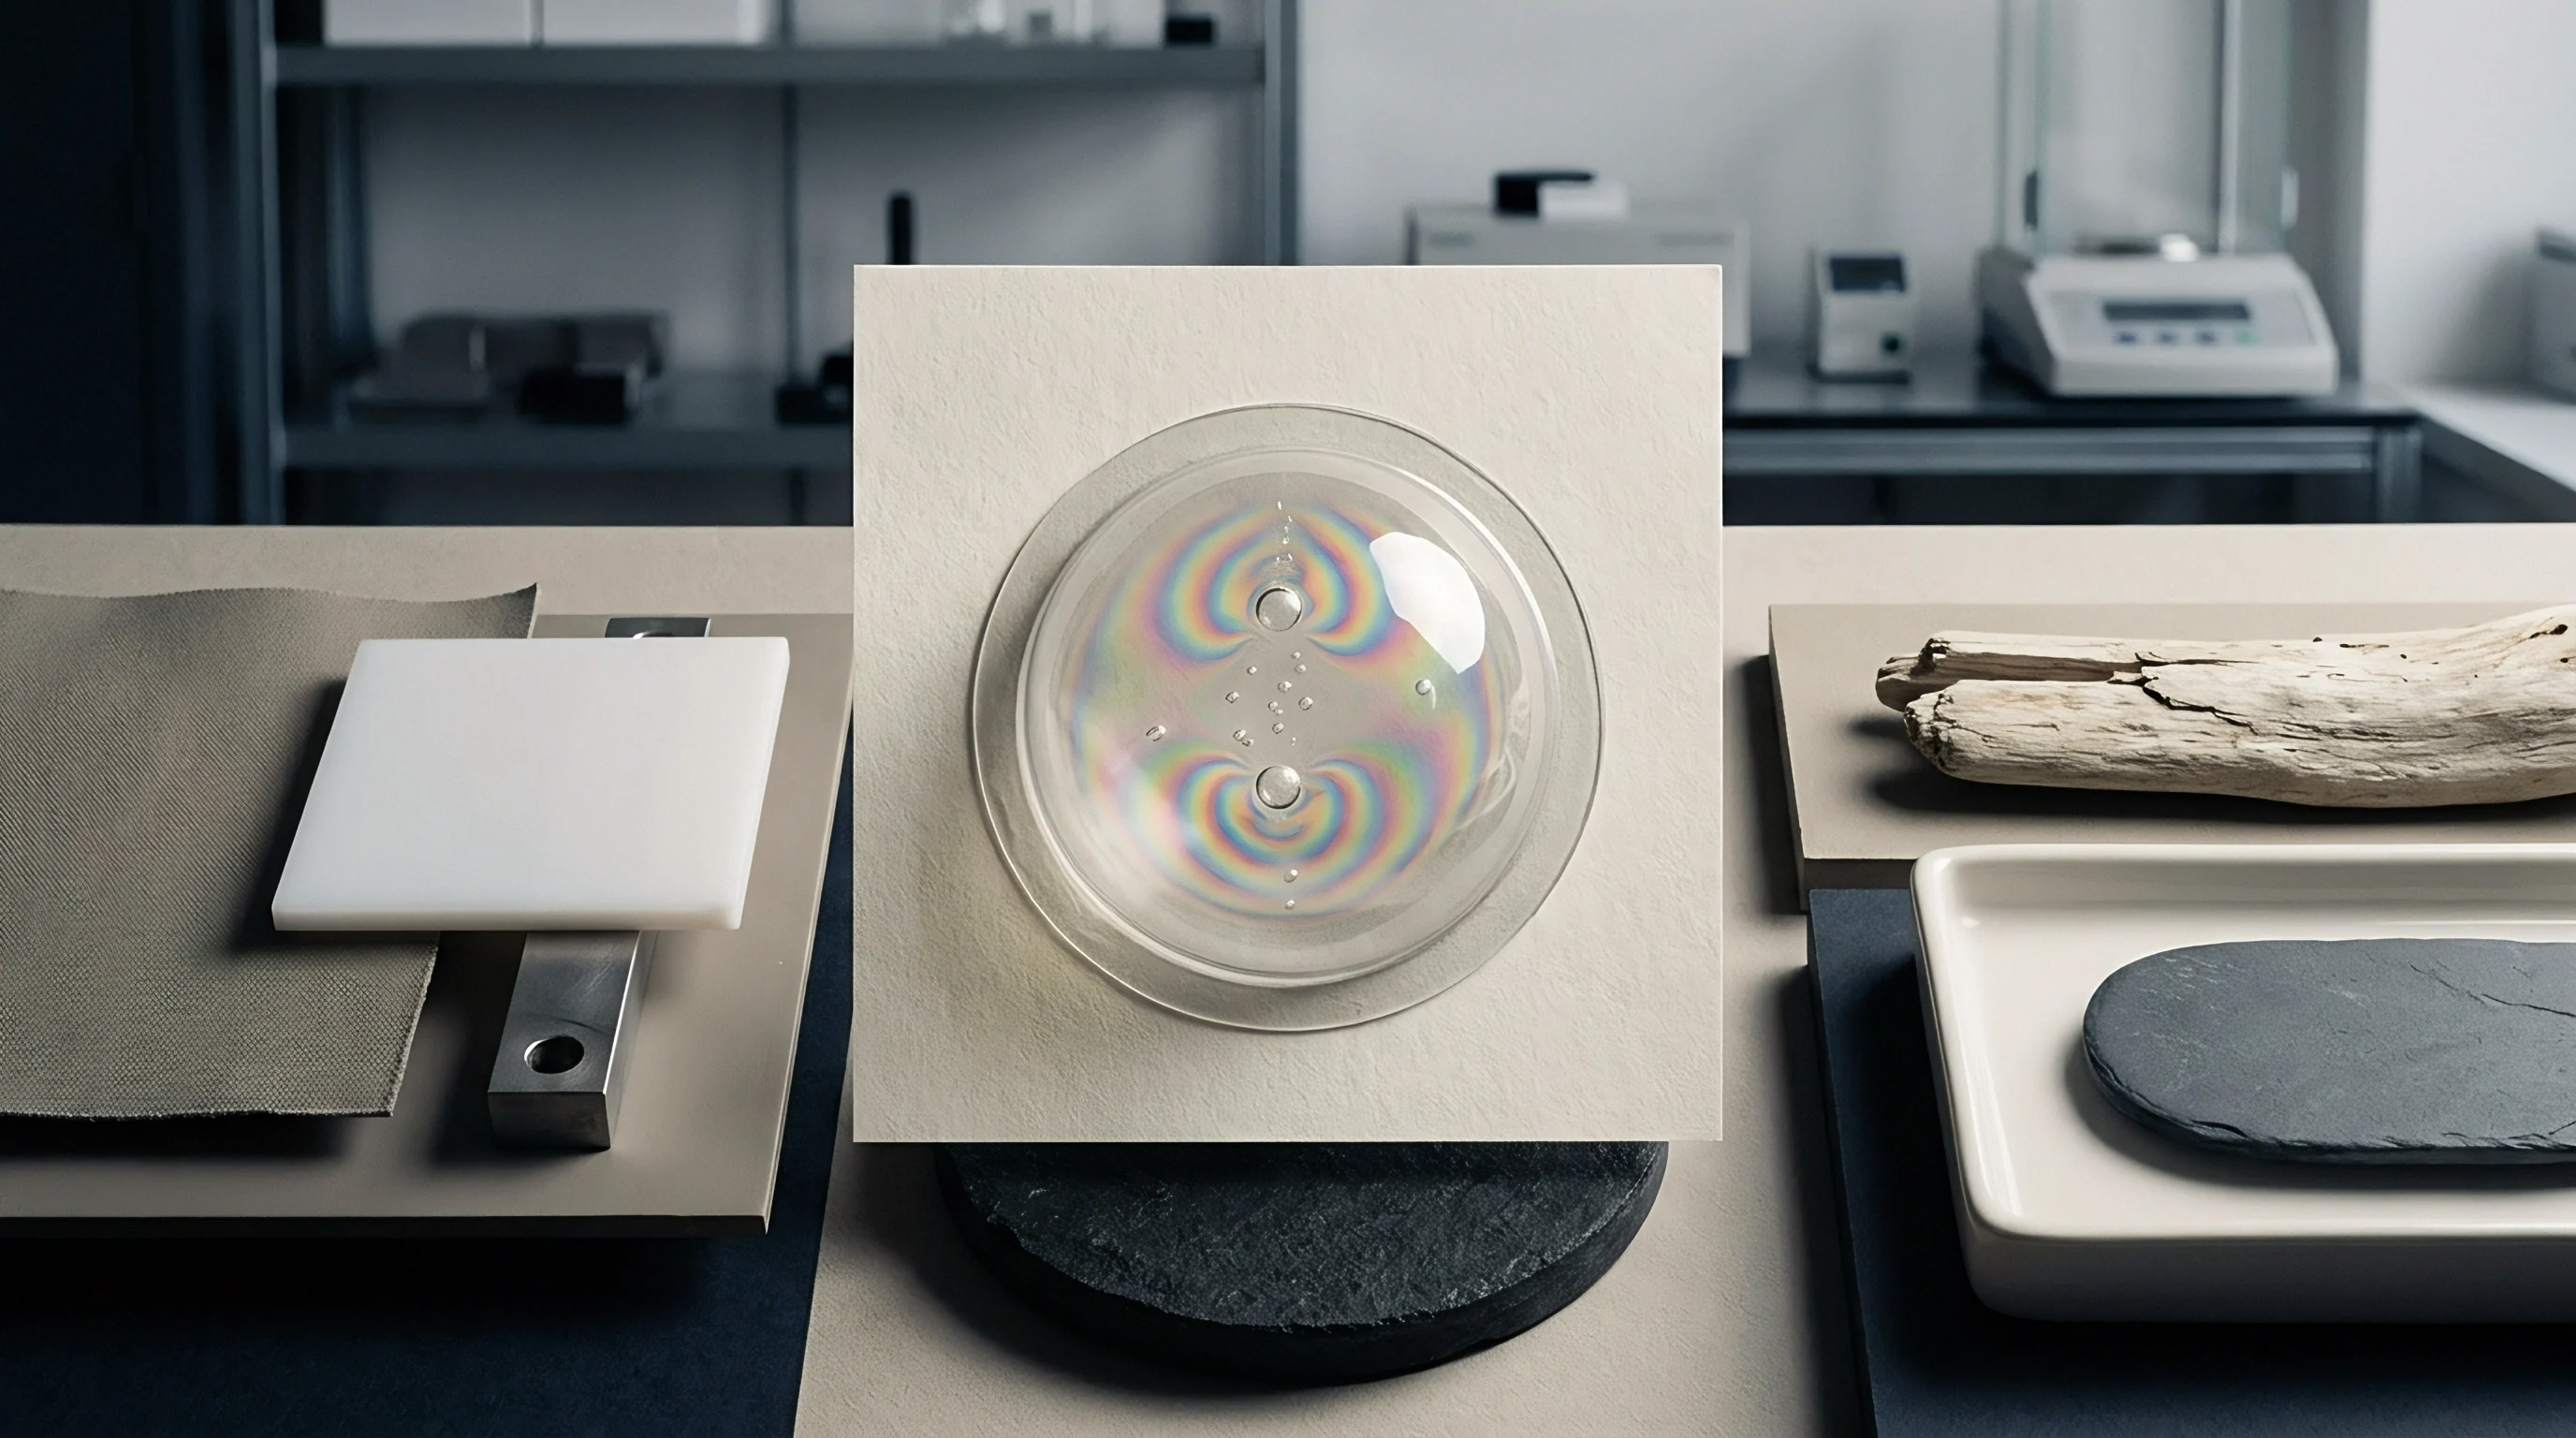
This frozen-in stress creates anisotropic refractive indices, splitting light waves into orthogonal polarization vectors. Retardance maps reveal internal stress patterns.
Optical systems utilized in polarization-sensitive sensors or head-up displays cannot tolerate irregular retardance patterns. High retardance distorts incoming polarized signals, creating ghost images and optical attenuation. Cavity pressure management directly controls the magnitude of frozen-in orientation stress.
Maintaining uniform melt front velocity reduces peak shear stress along the optical interfaces.
Excessive holding pressure during the gate seal phase induces severe birefringence near the injection point.
Over-packing an optical cavity introduces compressive stresses that elevate material retardance. When machine operators raise pack pressure to eliminate sink marks on perimeter ribs, they inadvertently distort the optical clear aperture. Thermal imbalance shifts the focal plane.
Polarized Light Stress Mapping
Optical elements subjected to non-uniform thermal shrinkage display visible fringe patterns under crossed polarizers. Quantitative polariscopes translate these fringe orders into nanometers of optical path difference. Peak retardance values typically concentrate near runner gates and perimeter thickness transitions.
Machining marks transfer to the wavefront.
Regulating the cavity pressure-time curve moderates the packing cycle, allowing polymer chains to relax before final vitrification occurs. By tapering cavity pressure as the melt approaches the glass transition temperature, controllers prevent secondary packing stresses from locking into the core of the lens. The finished part exhibits symmetrical retardance profiles that do not degrade system resolution.
Post Moulding Annealing Dynamics
Secondary thermal conditioning relieves molded-in mechanical strains when polymer chains relax below the glass transition point. Annealing cycles consume factory floor space and add secondary labor costs to the procurement ledger. Lenses molded under precise cavity pressure curve control eliminate the commercial requirement for secondary annealing.
Controlled in-mold cooling stabilizes optical components before tool opening.
Residual stress warps the optic over time. Components released with high molded-in stress experience dimensional creep when deployed in automotive lidar or thermal camera environments subjected to elevated operating temperatures. Controlling the cavity pressure curve area during the initial shot guarantees dimensional stability across the entire service life of the optical system.
Optical components with balanced internal stress fields exhibit uniform chromatic transmission across the entire clear aperture.