Optimizing Holding Pressure Curves to Control Anisotropic Shrinkage in Glass-Filled Polyamide Components
Dynamic multi-stage holding pressure profiles control core fiber relaxation, reducing transverse shrinkage differentials in glass-filled polyamide components.

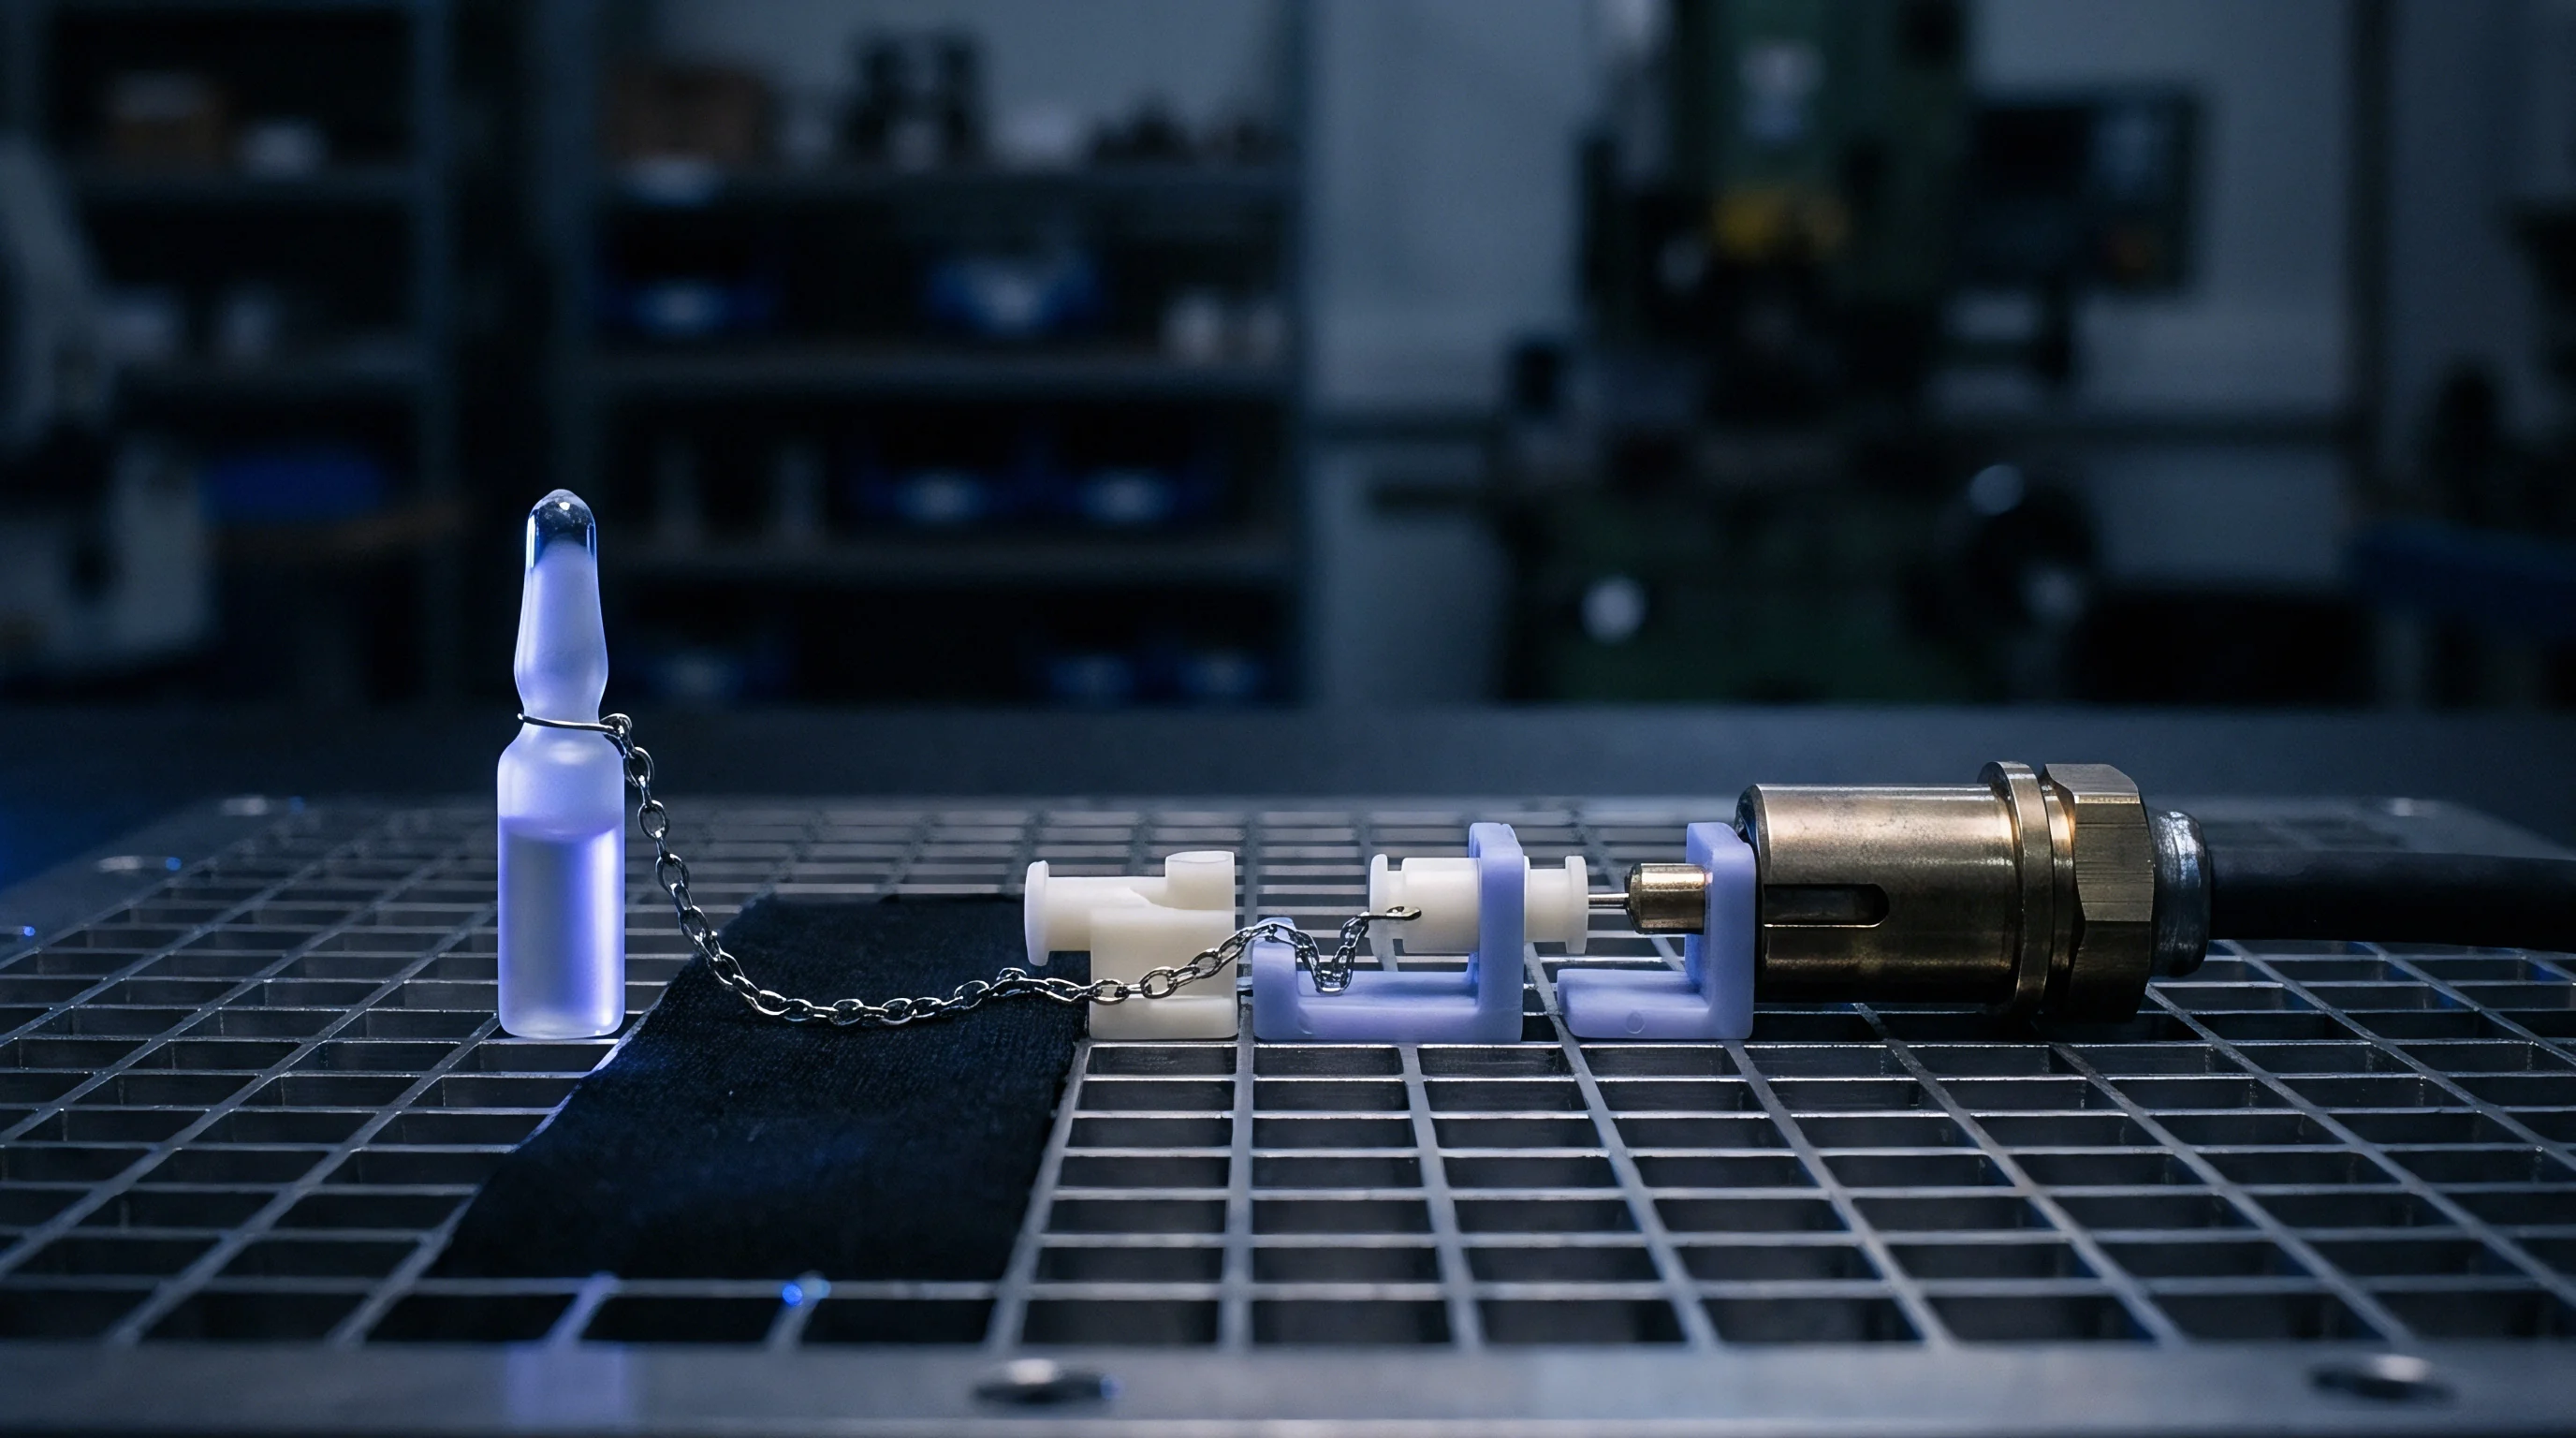
Gate
High glass-fiber loadings in polyamide resins require precise thermal control during initial boundary-skin solidification. When molten PA66 reinforced with thirty percent glass fiber by weight enters the cavity, contact with the cold tool steel forms an immediate frozen layer. Flow front velocity dictates how glass fibers align along primary flow vectors.
Glass fibers have a thermal expansion coefficient near 0.5 multiplied by 10 to the minus fifth power per Kelvin, whereas the semi-crystalline polyamide matrix expands at nearly twenty times that rate. Consequently, volumetric contraction during cooling occurs almost entirely perpendicular to the direction of fiber orientation.
The transition from high-velocity injection to pressure-controlled packing dictates how much polymer enters the cavity core before the orifice freezes. Switching over late packs excess melt into the cavity, generating high residual stress and localized shifts in orientation. Switching over too early makes the flow front hesitate, allowing the outer skin layer to thicken prematurely.
That rapid skin build-up constricts the flow channel, raising shear stress and creating steep viscosity gradients between the frozen boundary layer and the molten core.
Tool steel cuts cannot be undone once machined.
Once the gate freezes, part dimensions are locked in place.
Cold slugs easily block narrow gates.

Shear Rates and Skin Freeze Dynamics
As molten polymer moves through narrow cavity passages, it forms steep velocity gradients across its cross-section. The shear rate peaks near the boundary wall, where high velocity meets the stationary frozen layer. That high shear stress aligns short glass fibers parallel to the flow vector within this boundary region.
Near the central core, shear rates drop close to zero, letting thermal randomization leave fibers in a semi-isotropic orientation. The thickness ratio between this aligned skin layer and the random core dictates the final shrinkage difference between longitudinal and transverse axes.
Controlling shear rates during fill requires high injection speeds, but pushing speed too far degrades the silane coupling agent on the glass fibers. Shear heating can raise local melt temperatures by fifteen degrees Celsius, altering cooling rates and delaying skin formation. A balanced injection speed profile establishes a uniform skin thickness right across the runner and cavity path.
Maintaining melt velocity until the cavity reaches ninety-five percent volumetric capacity keeps the flow channel from freezing prematurely before packing force is applied.

Runner Diameter and Pressure Drop
Sizing feed paths correctly keeps the material from solidifying before the holding stage finishes packing the core. An undersized runner causes a severe hydraulic pressure drop, requiring high machine injection pressures that trigger jetting or break fibers. An oversized runner stretches cycle times, increases regrind ratios, and adds cooling delays.
Submarine and edge entry points need enough cross-sectional area to sustain pressure transfer until the hold phase finishes compensating for volumetric contraction.
Pressure drop across the runner system follows the Hagen-Poiseuille relationship adjusted for non-Newtonian polymer melts. Thanks to power-law fluid behavior, viscosity drops under high shear, but as flow decelerates during switchover, apparent viscosity spikes rapidly. The runner core must remain liquid long enough to transmit holding pressure directly to the deepest features of the part.
Pinpoint gates often freeze midway through the holding phase, cutting off hydraulic mass transfer while the center of thick part walls remains molten.
Sizing runners based on full hydraulic transfer takes precedence over relying on supplier rules of thumb.
Failure modes resulting from incorrect holding transfer timing reveal distinct structural defects across the component body:
- Uncompensated Core Shrinkage creates internal voids along thick ribs where hydraulic pressure drops to zero prior to solidification.
- Transverse Axis Sink Marks appear on non-gated wall surfaces when volumetric contraction outpaces core melt replacement.
- Differential Warpage Bending pulls flat planar walls toward the side of highest fiber alignment when core relaxation is blocked.
- Weld Line Micro-Cracking occurs where opposing flow fronts cool below the thermal weld temperature before packing force consolidates the interface.
When toolmakers attribute non-uniform warpage entirely to uneven tool cooling or raw material batch variations, they frequently overlook how early flow orifice freezing isolates the cavity from the press pressure circuit.
Compaction
Sustained hydraulic pressure after filling maintains material density while thermal contraction reduces molten volume inside the core. In glass-reinforced polyamides, packing pressure serves a dual purpose: it forces extra melt into the shrinking core and physically compresses the semi-crystalline matrix around rigid glass filaments. Without adequate compaction force, micro-voids open at the polymer-glass interface during thermal contraction, lowering mechanical strength and distorting part dimensions.
The magnitude, duration, and ramp profile of the holding pressure curve dictate whether a component meets strict geometric tolerances.
Pressure-Volume-Temperature data for PA66-GF30 shows that specific volume changes sharply during the transition from melt to solid state. At atmospheric pressure, semi-crystalline polyamide loses up to ten percent of its volume upon cooling from melt processing temperatures to room ambient. Applying eight hundred bar of packing pressure reduces this volumetric shrinkage to under two percent.
Applying uniform holding pressure across an entire part wall is impossible due to continuous thermal boundary layer growth, making dynamic pressure profiling an operational imperative for dimensional control.
Hydraulic force maintains the cushion during hold.
Excessive pack pressure leads to flash.
Part warpage directly follows volumetric shrinkage gradients.

PVT Transitions during Pack and Hold
Specific volume curves for semi-crystalline matrices show abrupt drops during phase transformation from liquid melt to solid polymer. As cooling proceeds, polymer chains fold into dense crystalline lamellae, driving rapid densification. Glass fibers undergo no phase change or volume reduction during this cooling window.
As a result, matrix shrinkage pulls material away from the immovable glass filaments, generating microscopic shear strains throughout the composite structure. High holding pressure suppresses phase-change volume loss by forcing polymer molecules into tighter pack arrangements before crystallization locks the structural network.
Isochoric cooling represents the ideal manufacturing path where pressure drops proportionally with temperature to maintain constant specific volume. Achieving true isochoric conditions across complex tool geometries requires matching the hydraulic pressure decay curve to the thermal conductivity of the glass-filled resin. Higher glass loadings increase overall thermal conductivity, speeding up cooling rates and narrowing the operational holding window.
Moulding engineers must calculate the thermal diffusion rate of the composite resin to program a holding pressure curve that tracks real density changes.
Multi-Stage Decoupled Pressure Profiles
Stepping down hydraulic force in discrete time intervals matches the local solidification rate of thick wall sections. A constant high holding pressure packs the gate area excessively, leading to high residual stress, gate stick, and localized flash, while distant wall sections remain under-packed. Implementing a stepped holding pressure profile begins with a high initial packing stage to settle the volumetric contraction of the outer skin, followed by progressive pressure reductions as the solid-liquid boundary moves inward toward the core.
Ramping holding pressure down in three discrete steps reduces warpage by forty-two percent. The initial high-pressure phase compensates for rapid volumetric contraction occurring immediately after cavity fill. The secondary intermediate phase maintains core mass transfer without exceeding the shear stress limits of the partially frozen gate.
The final low-pressure phase allows the gate region to solidify under controlled stress, preventing post-gate stress concentration and eliminating micro-void formation within the primary runner junction.
ISO 294-4 specifies measuring shrinkage twenty-four hours after moulding, yet unconditioned glass-filled polyamide components continue dimensional drift until moisture equilibrium reaches steady state.
Cavity Transducer Triggered Hold Cycles
Piezoelectric sensors mounted behind ejector pins offer direct, real-time feedback of internal mold dynamics. Hydraulic machine pressure settings rarely match actual pressure delivered to the polymer inside the cavity due to runner friction and gate constriction. Sensor feedback allows the moulding press to switch from fill to pack based on actual cavity pressure rather than screw position or hydraulic line pressure.
This closed-loop approach eliminates shot-to-shot variation caused by subtle melt viscosity fluctuations or thermal drift in the hot runner system.
Transducer curves display the exact moment of gate seal as a distinct inflection point where cavity pressure begins to decay independently of screw position. Continuing hydraulic holding pressure past this point wastes energy, wears machine components, and induces mechanical strain on the feed system. Programming the moulding machine to drop holding pressure immediately upon detecting gate seal stabilizes cycle times and preserves mechanical integrity across long production runs.
Setting up a dynamic holding pressure profile on an electro-hydraulic injection press involves a sequential, systematic series of operational adjustments:
- Establish the switchover position by running fill-only shots until the component reaches ninety-five percent volumetric completion without packing force.
- Install a high-frequency cavity pressure sensor in the region furthest from the feed orifice to monitor real-time pressure transmission across the flow path.
- Set the initial holding pressure level equal to eighty percent of the maximum injection pressure to secure immediate volumetric compaction.
- Perform a gate seal study by incrementally increasing hold time in half-second steps while weighing ejected parts until part mass reaches a constant plateau.
- Ramp down holding pressure in two distinct steps following the initial compaction burst to mirror the thermal decay rate measured by the cavity sensor.
- Verify final part dimensions across both parallel and transverse flow axes using a coordinate measuring machine after twenty-four hours of ambient dry conditioning.
| Holding Curve Profile | Initial Pack Pressure (bar) | Final Hold Pressure (bar) | Longitudinal Shrinkage (%) | Transverse Shrinkage (%) | Anisotropy Ratio (Trans/Long) |
|---|---|---|---|---|---|
| Constant Flat Curve | 900 | 900 | 0.22 | 0.98 | 4.45 |
| Single Step Down | 900 | 600 | 0.28 | 0.82 | 2.93 |
| Linear Ramped Decay | 900 | 450 | 0.31 | 0.64 | 2.06 |
| Three-Stage Optimized Ramped | 950 | 350 | 0.34 | 0.58 | 1.71 |
| Under-Packed Low Profile | 500 | 300 | 0.45 | 1.25 | 2.78 |
| Data recorded using PA66-GF30 at 290°C melt temperature, 90°C tool steel temperature, flat test plaque 150mm x 100mm x 3mm per ISO 294-1. | |||||
Failure to align the holding pressure decay rate with the thermal freeze kinetics of the polymer core forces the core to shrink away from outer solid walls, resulting in internal vacuum voids, severe wall sink marks, or catastrophic part distortion during post-moulding storage.

Alignment
Fiber orientation vectors within glass-reinforced polyamides dictate local physical characteristics along principal axes. During the fill phase, kinematic forces line up glass filaments parallel to the direction of flow near wall surfaces. In the subsequent holding phase, melt movement slows down significantly, yet mass continues to enter the core to compensate for volumetric contraction.
This slow core movement creates secondary shear forces that can realign partially frozen glass fibers near the core boundary, directly shifting the balance between longitudinal and transverse shrinkage.
Glass fibers themselves do not undergo thermal shrinkage.
Thermal gradients directly dictate local strain levels.
Core fiber orientation stays largely random.

Does Dynamic Holding Pressure Eliminate Thermal Sink?
Deep rib intersections and heavy bosses retain heat long after the outer surface solidifies. As these isolated thermal pools cool, they pull material from adjacent walls, creating show-surface depression marks. Sustained high holding pressure forces extra polymer melt into these warm zones, filling thermal cavities before surface skin collapse occurs.
Excessively high packing pressure applied to hot spots packs surrounding thin sections beyond design limits, creating severe internal stress concentration.
Dynamic pressure curves address sink formation by targeting high holding pressure specifically during the thermal window when heavy intersections undergo peak volumetric contraction. Lowering pressure step-wise as the core approaches crystallization temperature prevents packing stresses from locking into thinner adjacent geometry. Controlling the holding curve flattens local volumetric strain differentials without causing unwanted fiber orientation changes in adjacent flat wall surfaces.
Core-Shell Morphology and Microstructural Distribution
Cross-sectional microscopy reveals distinct layered zones created by complex hydrodynamic velocity profiles. A thin, randomly oriented skin layer forms at the immediate steel boundary where rapid chilling stops orientation kinetics. Just beneath this skin sits the shear layer, characterized by glass fibers aligned tightly parallel to the melt travel vector.
The central core layer displays fibers oriented perpendicular to flow or distributed randomly due to low extensional shear strains during main cavity filling.
Extended holding pressure times alter the relative thickness of these internal morphological zones. High initial packing pressure retards the relaxation of aligned polymer chains in the shear layer, widening the zone of parallel fiber orientation. Maintaining flow entry during the hold phase forces core material to travel through a semi-solid viscous channel, inducing secondary orientation within the core itself.
Controlling the hold pressure trajectory allows mould setters to widen or narrow these internal structural layers to tune directional physical properties.
Thicker skin layers formed under high initial packing pressures lock fiber orientation early, shifting differential warpage outward toward the part extremities.
Evaluating tool layout and pressure profile adjustments requires a structured decision workflow aligned with part reinforcement levels:
- Unfilled to Low-Filled Polyamides (0% to 15% Glass) focus holding profiles on isotropic volumetric compaction using standard flat pressure decay curves to minimize sink marks.
- Medium Glass Loading (15% to 30% Glass) deploy two-stage pressure profiling to equalize longitudinal and transverse shrink rates across moderate wall variations.
- High Glass Loading (30% to 50% Glass) utilize three-stage linear ramped decay curves to manage core fiber realignments and suppress differential warpage.
- Structural Structural Composites (Over 50% Glass) prioritize gate freeze isolation timing over extended holding to prevent fiber breakage and micro-void delamination.
Per ISO 11469 part marking standards, structural polyamide components must declare exact reinforcement ratios, which directly defines the acceptable anisotropic shrinkage band mandated in master supply agreements.

Calculus
Quantitative predictions of anisotropic dimensional changes rely on multi-variable thermal contraction equations. Shrinkage in glass-filled polyamide components is rarely isotropic; longitudinal shrinkage typically ranges from 0.15 to 0.4 percent, while transverse shrinkage spans 0.6 to 1.2 percent depending on wall thickness and processing conditions. Calculating final steel dimensions requires integrating cavity pressure curves over time to derive local effective packing densities across every region of the cavity.
Molders frequently cut tool steel assuming isotropic shrinkage. Toolmakers often split the difference between published longitudinal and transverse shrinkage rates, selecting a single nominal shrink factor such as 0.5 percent for cavity machining. This shortcut leads to off-spec parts, requiring expensive tool rework, metal-safe corrections, or permanent press profile compromises that inflate cycle times.
Pressure decay timing directly alters skin depth.
Runner volume adds to melt residence time.
Differential Shrinkage Stack Equations
Linear dimensions in reinforced polyamides deviate according to local fiber orientation angles relative to main flow lines. Calculating predicted shrinkage along any given planar vector requires solving tensor equations that combine matrix thermal expansion with fiber mechanical restraint. The total shrinkage strain along axis i is calculated using the mechanical properties of both phases:
S_i = S_matrix (1 – V_f) (E_matrix / E_composite) + S_fiber V_f (E_fiber / E_composite)
In this relationship, V_f represents the fiber volume fraction, S represents unconstrained thermal shrinkage strain, and E represents the elastic modulus of the respective phase. Because glass fiber elastic modulus exceeds that of the polyamide matrix by more than twenty-five times, longitudinal shrinkage S_parallel drops close to zero as fiber content rises above thirty percent by weight. Transverse shrinkage S_perpendicular remains dominated by matrix thermal volume loss, modified only by Poisson contraction effects across adjacent layers.
Cavity pressure integration determines the local densification factor achieved during the holding window. The effective pressure integral P_eff is calculated as:
P_eff = integral from t_fill to t_gatefreeze of P(t) dt
Higher P_eff values increase local polymer density, reducing matrix volumetric loss S_matrix. Programming a optimized holding pressure profile adjusts P_eff across distant cavity zones, equalizing S_perpendicular across varying flow lengths to prevent component distortion.

Cycle Time Amortization against Tolerance Yield
Extending press holding time by five seconds increases machine operating expenses while securing tighter part tolerances. A machine hourly rate of seventy-five Euros translates to direct press costs of approximately 0.02 Euros per second of added cycle time. On a four-cavity tool producing two million units annually, adding three seconds of hold time to eliminate warpage adds six thousand Euros in direct operational expenses per cavity stream.
The financial benefit of longer hold times appears in final yield statistics and scrap reduction. Achieving a Cpk process capability index above 1.33 on critical dimensions eliminates hundred-percent post-moulding inspection requirements and prevents line-stoppage penalties from tier-one assembly customers. Optimizing holding pressure curves to achieve tight tolerances without adding unnecessary hold duration protects piece-price margins while maintaining strict dimensional compliance.
A linear holding pressure decay profile reduces transverse shrinkage from 0.95 percent to 0.62 percent in thirty percent glass-filled PA66 at a constant melt density of 1.34 grams per cubic centimeter.
A rigorous tool drawing dossier for glass-filled polyamide components must explicitly contain five structural design inputs to control anisotropic outcomes:
- Flow Direction Annotations indicating primary flow vectors from gate points across all critical measurement planes.
- Dual Shrinkage Value Sets listing specific longitudinal and transverse shrinkage factors assigned to individual cavity dimensions.
- Cavity Pressure Target Ratings defining minimum required peak pressure integrals across remote wall sections.
- Gate Seal Time Specifications establishing maximum permitted hold durations based on material thermal properties.
- Moisture Conditioning Calibration Standards defining exact post-moulding storage conditions prior to quality inspection.
| Hold Time Strategy | Hold Time (s) | Total Cycle Time (s) | Transverse Tolerance Band (mm) | Dimensional Cpk Index | Amortized Cost per Part (€) |
|---|---|---|---|---|---|
| Short / Under-Packed | 3.0 | 18.5 | +/- 0.35 | 0.72 | 0.412 |
| Standard Flat Hold | 6.0 | 21.5 | +/- 0.22 | 1.15 | 0.448 |
| Optimized Ramped Hold | 8.5 | 24.0 | +/- 0.08 | 1.58 | 0.478 |
| Over-Packed Hold | 14.0 | 29.5 | +/- 0.12 | 1.41 | 0.547 |
Whether advanced real-time pressure integration algorithms can dynamically alter machine velocity profiles shot-to-shot to completely offset batch-to-batch polymer regrind viscosity shifts without manual setter intervention remains an unresolved question for automated toolrooms.


Acceptance
Dimensional verification of glass-filled polyamide mouldings demands strict protocol controls regarding atmospheric exposure and aging. Polyamide matrices are inherently hygroscopic, absorbing ambient moisture until equilibrium is reached with surrounding humidity levels. Water molecules penetrate the amorphous regions of the polymer network, acting as a plasticizer that expands outer dimensions and alters physical mechanical properties.
Measuring dimensions immediately after ejection yields numbers that change significantly over subsequent days as moisture absorption occurs.
Mold temperature directly drives polymer crystallization.
Moisture absorption steadily expands the matrix.
DIN 16742 Tolerance Classes for Fiber Composites
Standard dimensional tables establish permissible variations based on nominal part sizes and material elasticity. DIN 16742 categorizes moulded parts into tolerance groups ranging from TG1 for precision components down to TG9 for coarse industrial shapes. Glass-filled polyamides typically land within tolerance group TG4 or TG5 when processed under controlled conditions.
Achieving tighter TG3 tolerances requires optimized dynamic holding pressure profiles that suppress transverse shrinkage variation to absolute minimums.
Tolerance class assignment dictates allowable cavity-to-cavity dimensional spreads on multi-cavity tooling. A part with a nominal dimension of one hundred millimeters under TG4 allows a total variation band of 0.28 millimeters. If holding pressure distribution varies across cavity streams due to unbalanced runner geometry, individual cavities will produce parts outside this narrow tolerance band.
Tool buyers must audit cavity pressure traces across all streams during first article inspection trials to ensure uniform pressure transfer.
Moisture Equilibrium and Dimensional Drift
Ambient humidity absorption causes aliphatic polyamide chains to expand, altering physical boundaries weeks after ejection. Dry-as-moulded components exhibit their smallest dimensions twenty-four hours after ejection. As water absorption proceeds toward a typical equilibrium level of two to three percent by weight in standard atmospheric conditions, transverse and longitudinal dimensions expand by 0.15 to 0.30 percent.
Quality validation protocols must specify whether drawing dimensions apply to dry-as-moulded parts or moisture-conditioned assemblies.
Accelerated conditioning procedures involve immersing parts in warm water baths at seventy degrees Celsius to reach equilibrium moisture levels within hours rather than weeks. Dimensional verification performed post-conditioning reflects the true operational geometry of the component over its working lifespan. If process engineers adjust holding pressure profiles based solely on dry-as-moulded measurements, parts will exceed maximum material condition limits once installed in humid operating environments.
Tool cavity dimensions machined to mean shrinkage rates fail inspection when post-moulding moisture absorption expands transverse walls beyond drawing tolerances.
Setting holding pressure curves based on real-time cavity sensor data rather than screw post-position settings guarantees tight dimensional control across shift changes.