In-Mould Cavity Pressure Sensor Selection and Calibration Procedures for Precision Tooling
Precision cavity pressure sensor selection demands matching load path dynamics with piezoelectric drift limits and verified in-situ dynamic calibration routines.


Pin
Direct melt interface sensing places the transducer diaphragm in direct contact with polymer flow inside the impression. Flush-mounted piezoelectric transducers capture dynamic pressure without mechanical transmission losses, detecting melt front arrival, viscosity shifts, and volumetric filling in real time. Precision optical lenses, electrical connector housings, and medical fluidic channels rely on direct contact because pressure transmission errors distort peak packing control.
However, these direct sensors require precise bore machining in cavity steel, exposing the sensing face to abrasive resin flow and thermal gradients reaching 300 degrees Celsius.
Indirect pressure measurement transfers cavity force to an internal transducer through a moving steel ejector pin. Transmitting force through steel rods introduces frictional hysteresis, alignment variance, and pin deflection that can alter cavity geometry. When polymer melt presses against the ejector pin tip, friction between the pin shank and tool steel bore absorbs part of the applied force.
This loss reduces the force reaching the sensor base, producing pressure readings lower than actual cavity conditions.
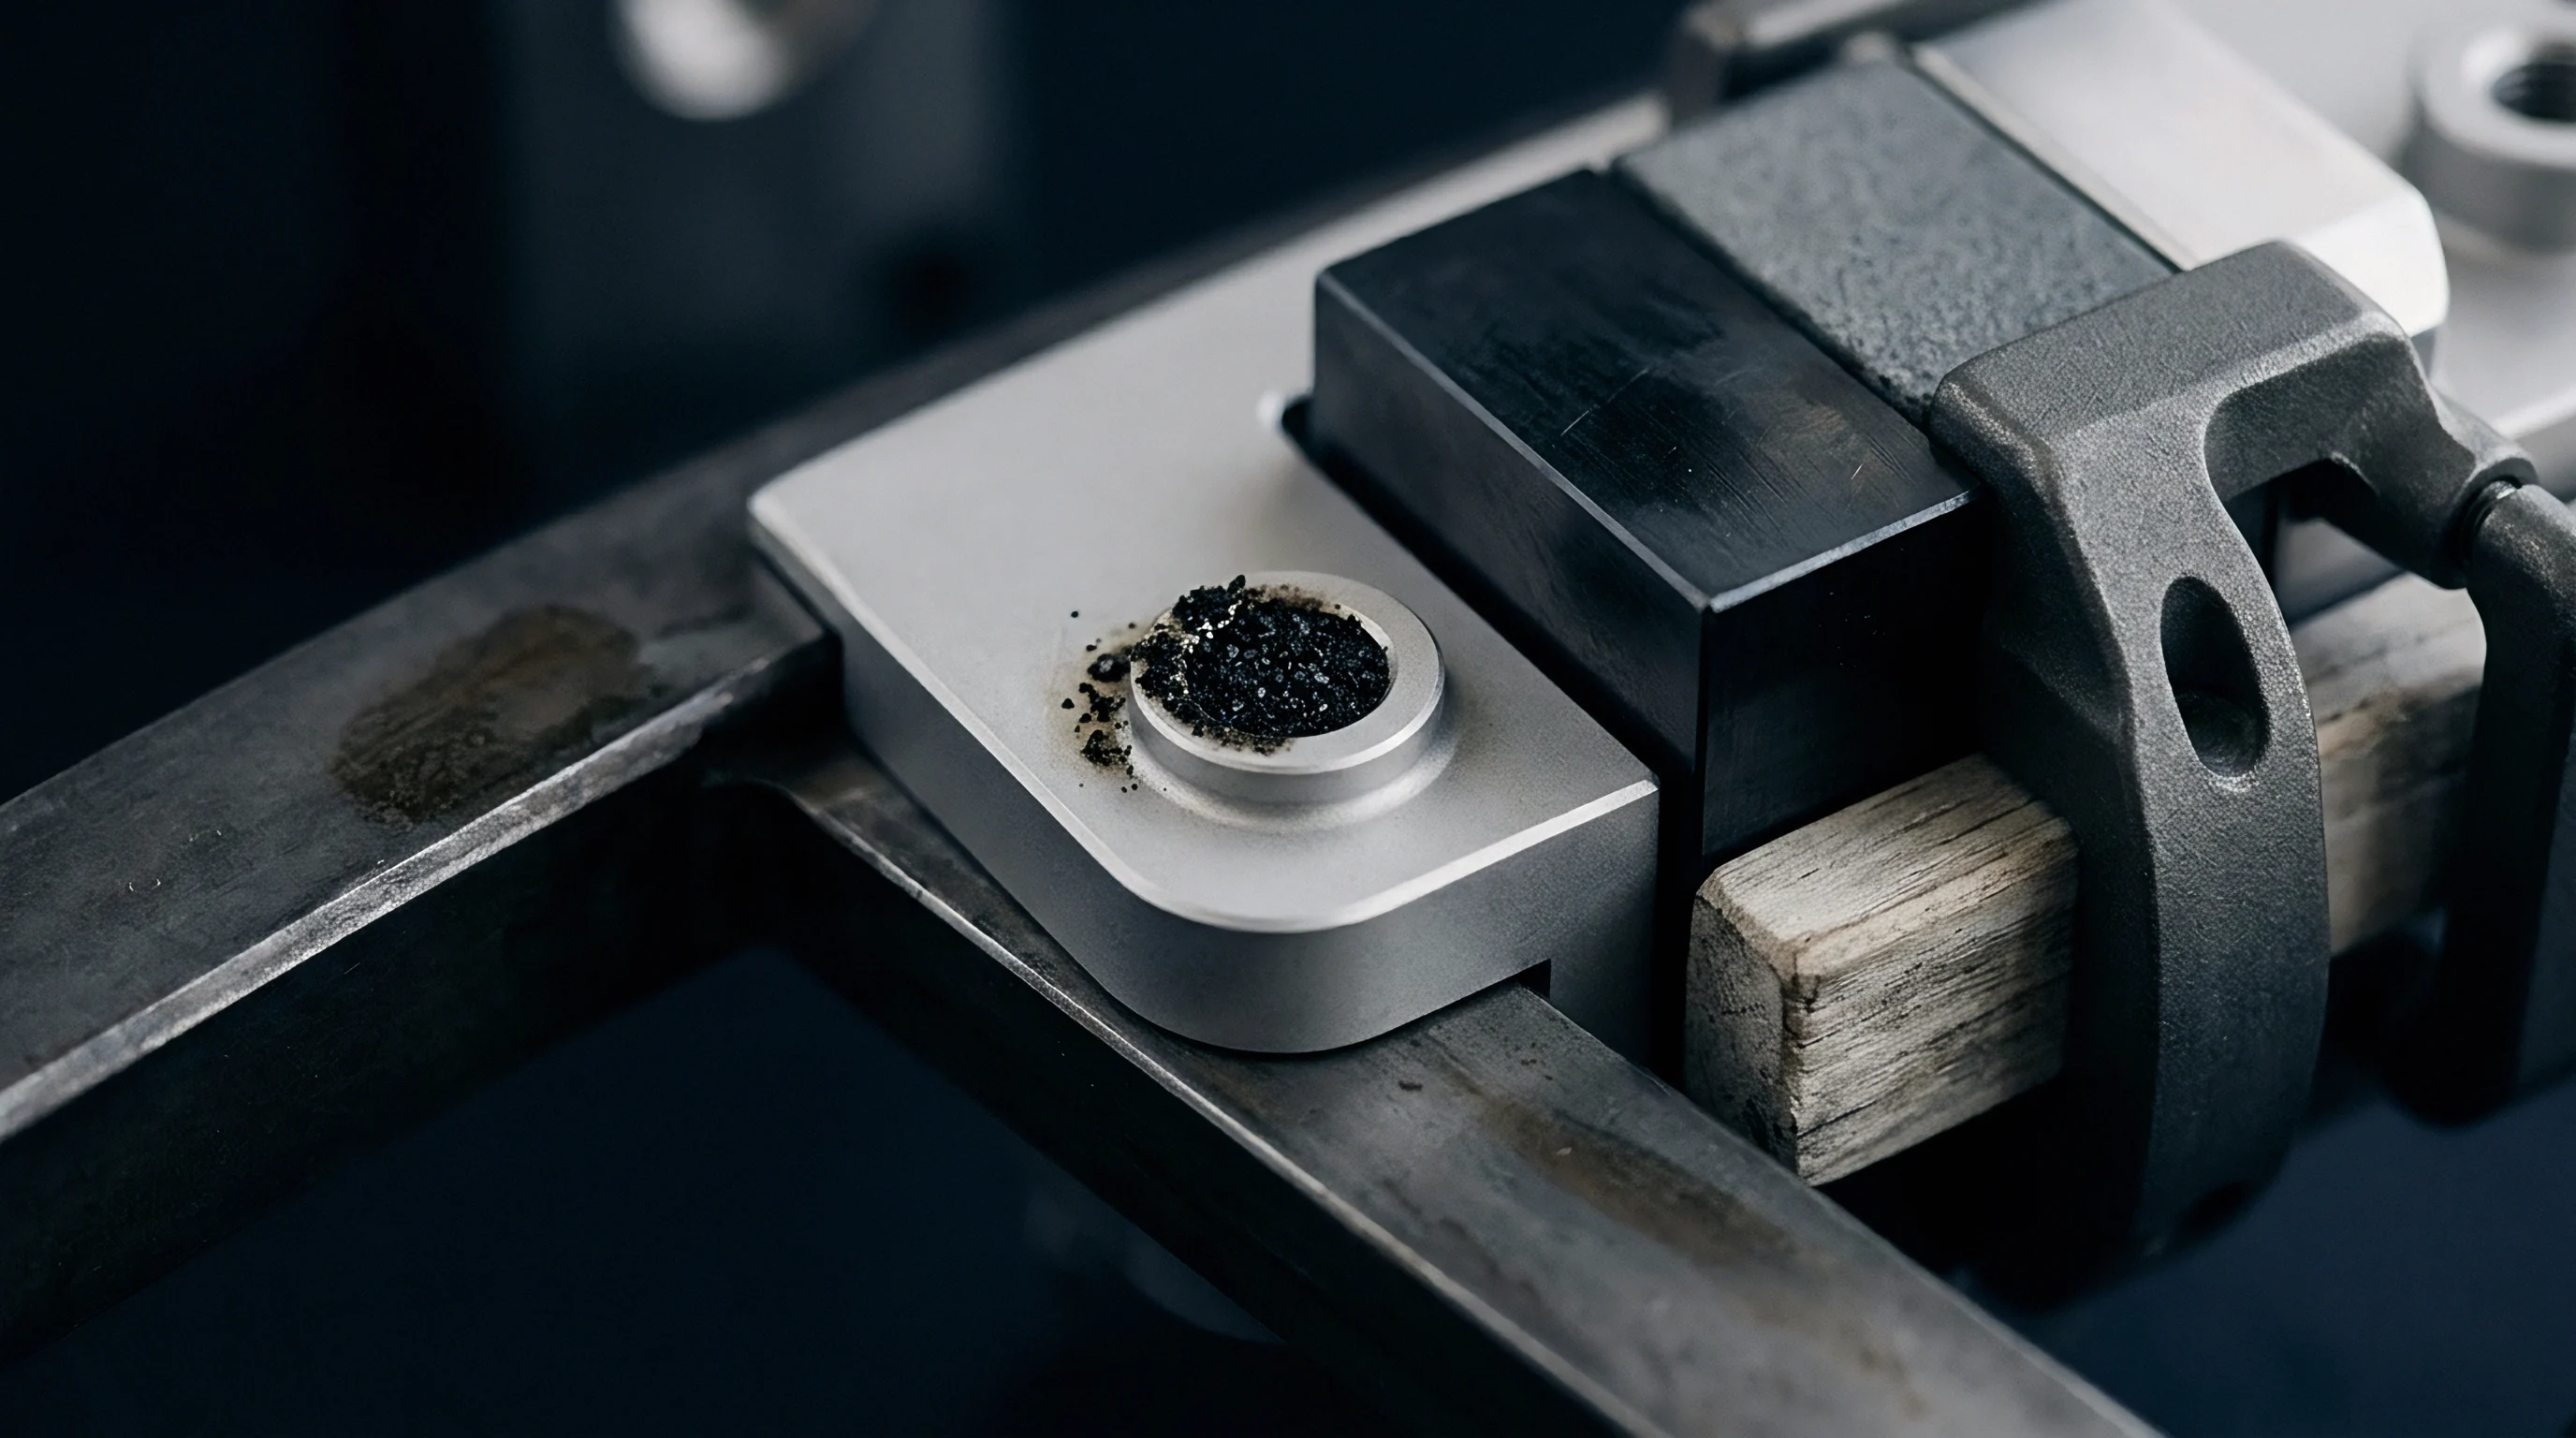
Direct Load Transfer Geometry
Placing the diaphragm flush with the cavity wall removes intermediate transmission components. Direct-contact transducers use hard-coated metallic or ceramic sensing faces built to withstand peak pressures over 2,000 bar. Toolmakers machine transducer pockets into cavity steel using CNC jig grinding or sinker electrical discharge machining.
The sensor face must align flush with the surrounding cavity contour within plus zero to minus five micrometers. A protruding sensor restricts polymer flow and causes shear heating, whereas a recessed sensor leaves a raised stud on the moulded part.
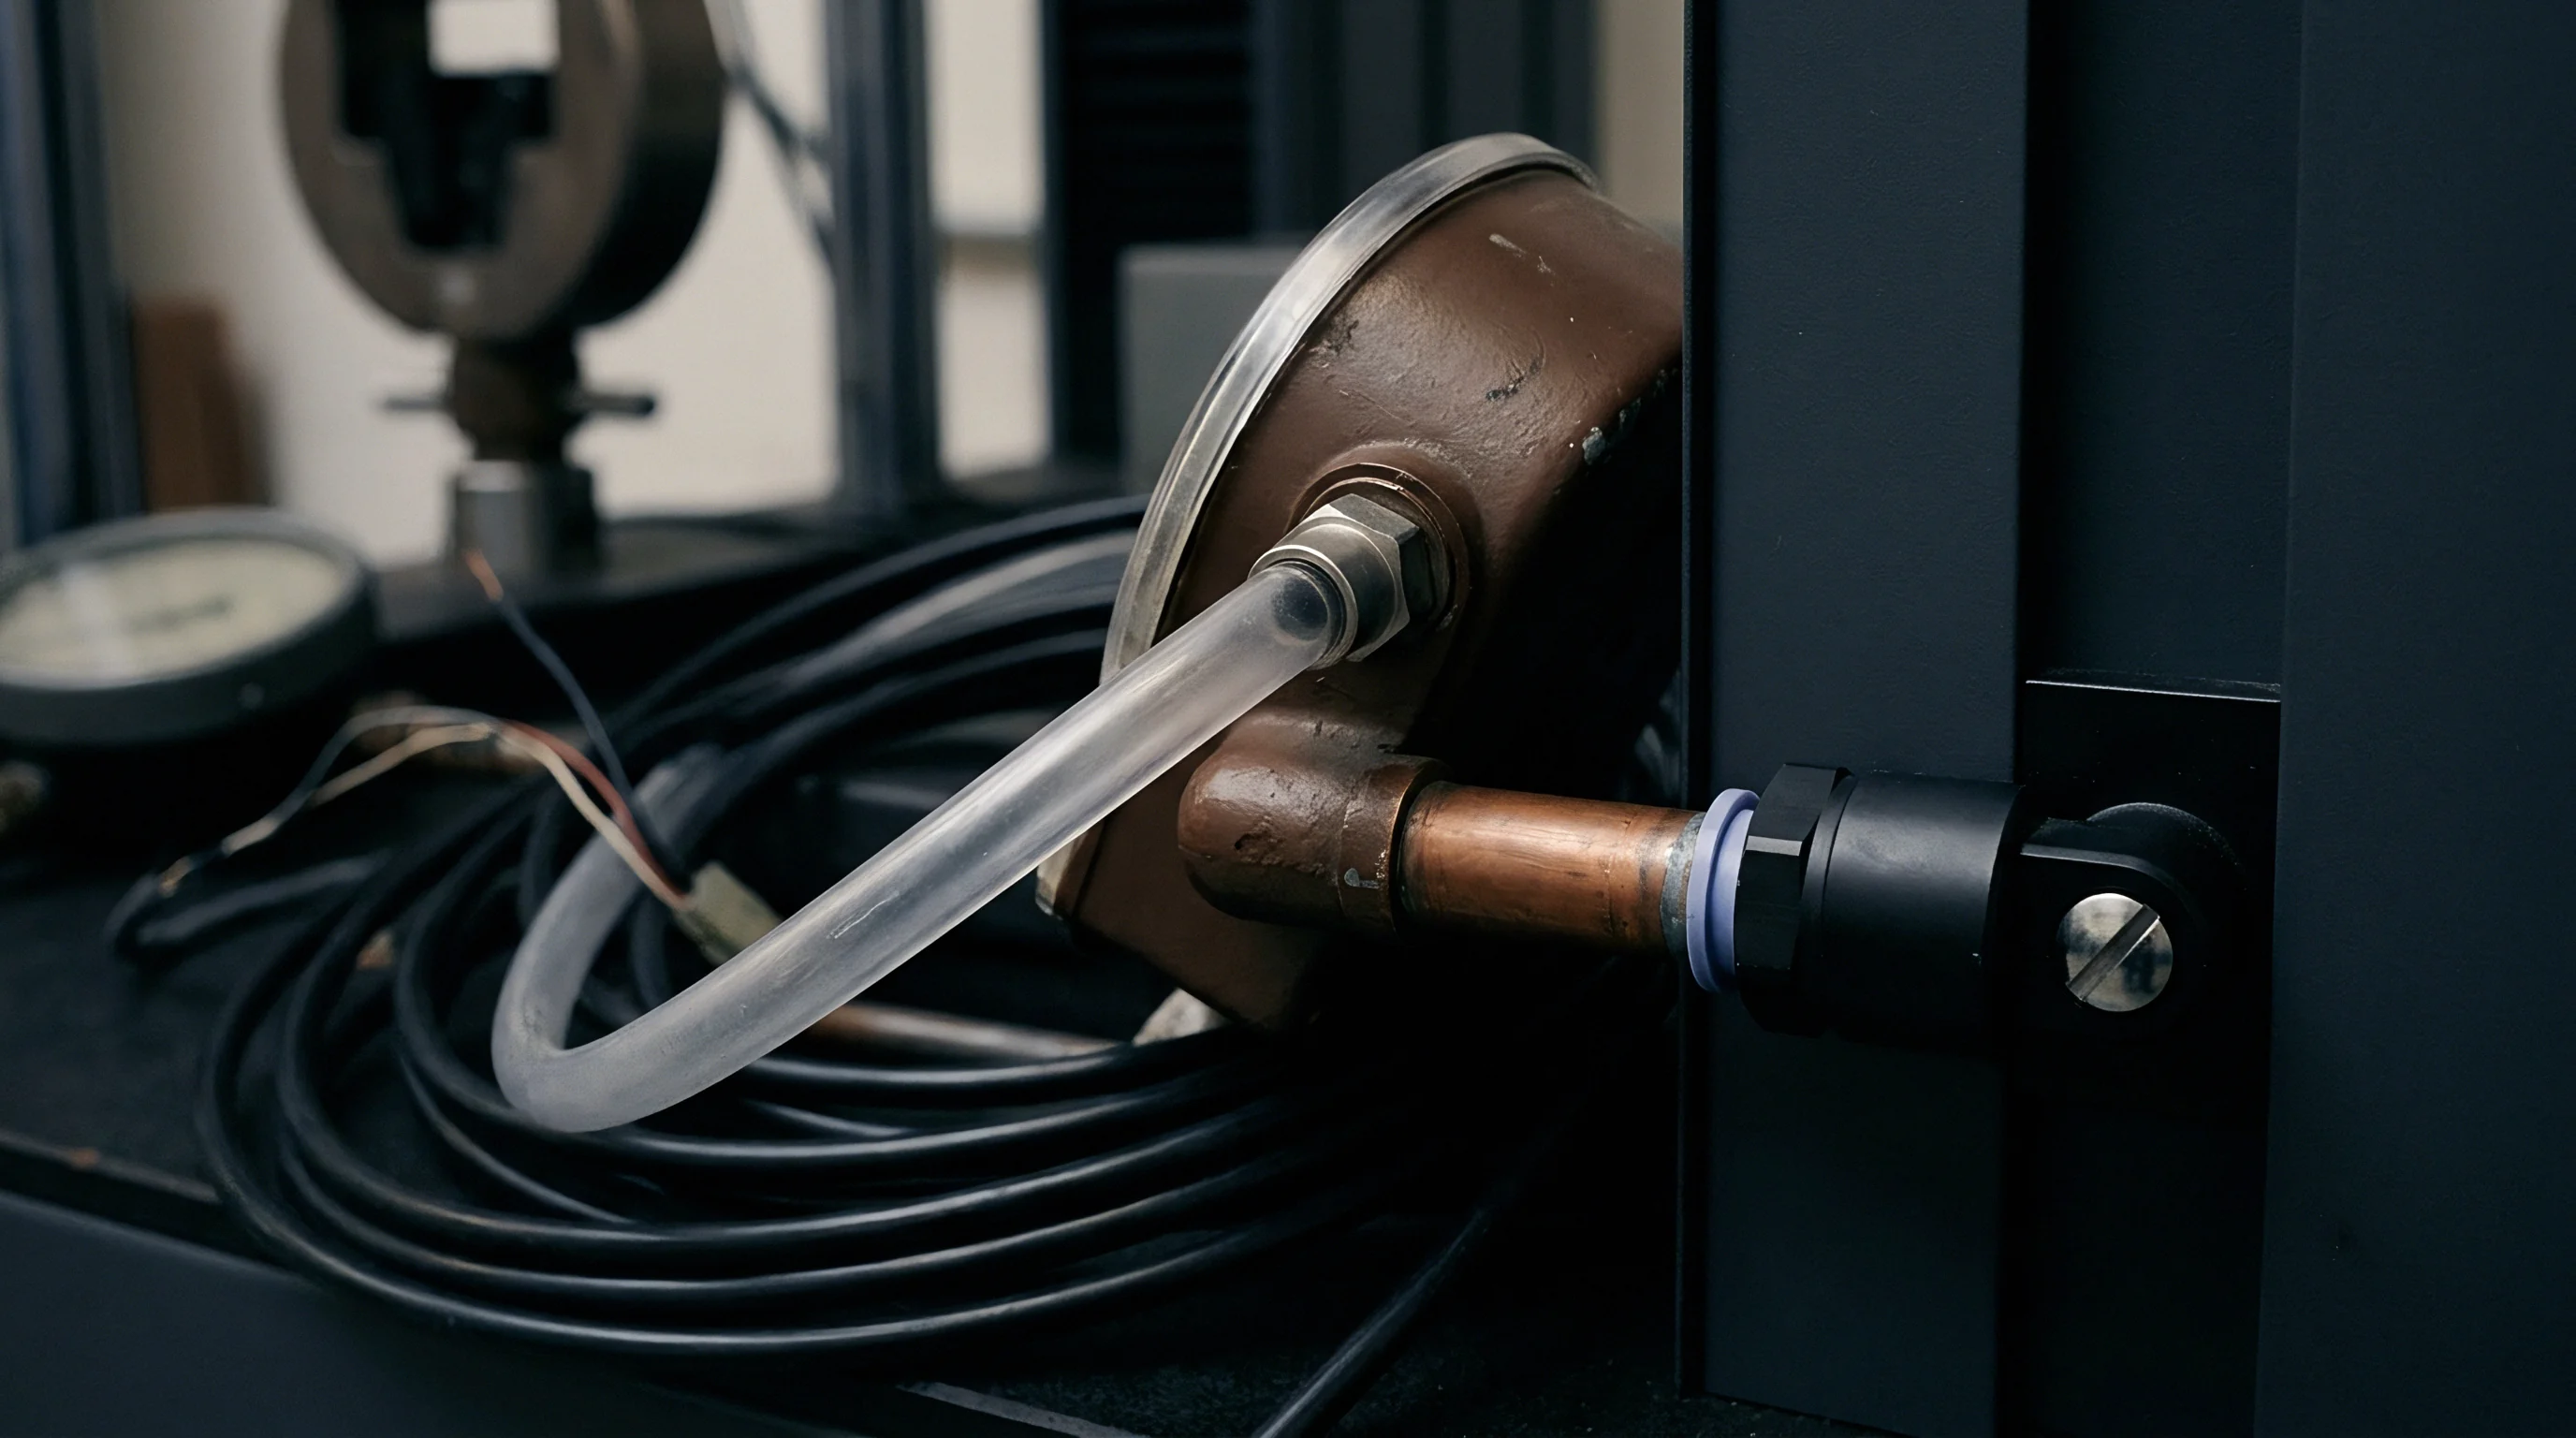
Indirect Mechanical Load Transmission
Indirect configurations place the transducer behind an ejector pin inside the ejector plate or backup plate assembly. This shields delicate sensor electronics from corrosive polymer degas products and extreme melt temperatures. Measurement accuracy depends heavily on pin clearance, surface finish, and length-to-diameter aspect ratio.
Keeping pin clearance between 0.005 millimeters and 0.010 millimeters prevents polymer flash from entering the gap while minimizing mechanical friction. If binding occurs, signal peaks truncate; similarly, aspect ratios exceeding six-to-one encourage column buckling under high packing loads, producing non-linear signal responses that corrupt peak pressure data.
| Transducer Mechanism | Pressure Range (bar) | Temperature Limit (°C) | Installation Footprint (mm) | Signal Sensitivity |
|---|---|---|---|---|
| Direct Piezoelectric Quartz | 0 ~ 2,500 | 200 ~ 300 | Ø 4.0 ~ Ø 12.0 | High (-2.5 to -9.4 pC/bar) |
| Indirect Ejector Pin Piezoelectric | 0 ~ 2,000 (Load based) | 120 ~ 200 | Ø 12.0 ~ Ø 16.0 | High (-4.0 to -9.0 pC/N) |
| Piezoresistive Strain Gauge | 0 ~ 1,500 | 120 ~ 150 | Ø 6.0 ~ Ø 10.0 | Medium (0.5 to 2.0 mV/V) |
Choosing an unsuitable mounting geometry introduces systematic measurement errors that distort process control algorithms. Frictional losses along the ejector pin shank cause machine controllers to under-predict cavity packing, leading to over-packing, internal stress, tool flash, and parts sticking in the mold.
Load Path Variance in Indirect Sensing
Indirect transfer paths accumulate mechanical tolerances across multiple steel interfaces. Force moves from the polymer melt through the ejector pin, across the pin head, and onto the transducer button. Microscopic asperities on these mating surfaces compress under load, causing non-linear force-deflection behavior during initial cavity pressurization.
- Shank Binding Frictional Loss occurs when thermal expansion or side-loading tilts the pin against the bore, diverting force into the mold frame instead of the sensor.
- Polymer Flash Infiltration happens when high melt pressure pushes polymer into clearances exceeding 0.012 millimeters, where it solidifies around the pin tip and locks the assembly.
- Pin Base Bending Deflection stems from off-center seating against the transducer load button, causing uneven compression across internal quartz disks.
- Thermal Expansion Offset Drift occurs as heat travels down the ejector pin from the cavity, expanding the pin and artificially pre-loading the sensor.
Ignoring pin fit tolerances and alignment during installation alters the relationship between true cavity pressure and measured charge. Inaccurate pressure feedback prevents the machine controller from detecting viscosity changes, leading to weight variation, sink marks, and dimensional drift across production runs.
Charge
Piezoelectric quartz elements release an electrical charge proportional to mechanical stress applied along specific crystal axes. Single-crystal synthetic quartz offers high stiffness, rapid response frequencies, and minimal hysteresis under cyclic loads up to 2,000 bar. Under compressive force F, a quartz disk cut perpendicular to its x-axis generates charge Q governed by the piezoelectric coefficient d11, expressed as Q = d11 · F. High-precision systems use longitudinal cuts that output between minus two and minus ten picocoulombs per bar of cavity pressure.
Signal processing relies on charge amplifiers that convert high-impedance picocoulomb signals into stable, low-impedance analog voltages, usually zero to ten volts. These high-impedance lines require specialized low-noise coaxial cables with polytetrafluoroethylene insulation and conductive graphited layers, because movement or vibration in standard coaxial cabling generates triboelectric interference that distorts low-pressure readings during fast tool clamping movements.

Piezoelectric Transducer Physics
Compressive force on single-crystal quartz generates proportional polarization along its x-axis cut. Synthetic quartz remains stable under severe dynamic loading, maintaining linearity within plus or minus 0.5 percent of full-scale output. Natural frequencies above 100 kilohertz allow direct quartz sensors to track melt front arrival down to sub-millisecond increments.
Piezoresistive strain gauges, which use metallic foil or silicon elements on a flexible diaphragm, output millivolt shifts under Wheatstone bridge excitation; while cheaper upfront, they suffer from thermal drift and mechanical fatigue over long, high-cycle runs.
Indirect force measurement relies on rigid transmission pin paths.

Signal Conditioning and Cabling
Low-noise coaxial cables with Teflon insulation prevent parasitic capacitance shifts during rapid mold motions. Wiring channels inside tool plates need dedicated routing, smooth bend radii over twenty millimeters, and rigid support brackets. Running unshielded high-impedance cables near electromagnetic interference from heater bands or servo drives introduces ripple to the pressure signal.
While press-side charge amplifiers convert weak charge into proportional voltage, modern industrial units digitize signals right at the mold frame, sending data over noise-immune protocols like EtherCAT or PROFINET straight to the machine controller.
Piezo charge drift almost always stems from inadequate cable insulation resistance rather than crystal degradation. In practice, dirty or oil-contaminated connectors drop insulation resistance below the required 10 to 14 ohms, bleeding off charge before signal conditioning can finish.

Machining
Installing cavity sensors accurately requires tightly controlled bore dimensions in hardened tool steel. Toolrooms machine pockets into steels such as 1.2343 (H13) or corrosion-resistant 1.2083 (420 stainless) hardened to 52 to 58 HRC. Strict concentricity, exact bore depths, and fine surface finishes are essential; geometric errors distort diaphragm alignment, create stress concentrations, and produce inaccurate signal baselines under clamping force.
Spacer rings ground to micron tolerances set the precise mechanical pre-load required for installed piezoelectric sensors. Pre-loading holds the sensor tightly against its seating shoulder, preventing movement during high-impulse filling. Without adequate pre-load, the sensor can shift during injection, causing signal dropouts and false negative pressure dips at the start of the packing phase.

Bore Tolerances and Seating Surfaces
Sensor pockets require tight dimensional control to prevent diaphragm distortion during cyclic packing. Counterbore depth tolerances must stay within plus zero to minus ten micrometers relative to the cavity surface. The seating shoulder needs a flatness tolerance within two micrometers and a surface finish of 0.4 micrometers Ra or better.
Rougher surfaces leave microscopic peaks that flatten when the mold clamps up, destroying the pre-load calibration and causing long-term zero-point drift.
Per DIN 16742 Class TG3, pocket seating flatness tolerance dictates signal offset precision.
- Rough-machine the pocket, leaving 0.15 millimeters of grinding stock on critical load-bearing shoulders.
- Heat-treat the tool steel plate to a target hardness of 54 HRC to prevent compression yielding under sensor seating faces.
- Finish-grind the seating shoulder with a precision jig grinder to reach an Ra 0.2 micrometer finish and flat contact.
- Ream the guide bore to an H7 clearance tolerance, ensuring axial alignment with the cavity opening.
- Clean pocket surfaces in an ultrasonic solvent bath to remove chips, slurry, and oil residue.
- Measure depth from the cavity surface to the pocket shoulder using an electronic depth micrometer calibrated to 0.001 millimeter accuracy.
- Grind a custom spacer ring to the calculated thickness, accounting for the required 15 percent pre-compression bias.
- Torque the retaining nut to manufacturer specifications using a calibrated digital torque wrench.

Pre-Load Calculation and Assembly
Precision-ground spacer rings set the mechanical bias needed for piezoelectric crystals. Manufacturer specifications typically require pre-load forces equal to 10 to 20 percent of maximum measuring capacity. For example, a transducer rated for 2,000 bar pressure needs pre-loading equivalent to 200 bar static compression.
Ground disc springs or solid steel spacers preserve this pre-load against thermal expansion in surrounding tool plates. During assembly, installers must avoid applying torsional torque to the sensor housing, as twisting internal crystal stacks permanently ruins signal linearity.
| Machining Feature | Target Dimension | Tolerance Class | Surface Finish (Ra) |
|---|---|---|---|
| Sensor Guide Bore Diameter | Ø 4.000 mm ~ Ø 12.000 mm | H7 (+0.012 / 0.000 mm) | 0.4 µm |
| Seating Shoulder Flatness | Planar Contact Surface | 0.002 mm TIR | 0.2 µm |
| Counterbore Depth | Per Sensor Model Geometry | +0.000 / -0.010 mm | 0.8 µm |
| Ejector Pin Clearance Hole | Pin Diameter + 0.008 mm | F7 (+0.020 / +0.010 mm) | 0.4 µm |
Tooling drawings should reference established standards to remain binding during mold acceptance audits. Citing DIN 16742 Class TG3 tolerance standards sets clear dimensional expectations, holding mold makers accountable for pin pocket concentricity and pre-load seating accuracy prior to sign-off.

Derivation
Converting electrical signals into accurate pressure readings requires systematic scaling routines. Factory sensitivity values (measured in picocoulombs per bar) reflect ideal room-temperature conditions. Once installed, tool dynamics ~ such as mechanical pre-loads, ejector pin friction, and mold deflection under clamping force ~ shift this baseline.
Calibrating the signal path converts raw millivolt outputs from the charge amplifier into verified pressure measurements across the full operating window.
Hydraulic calibration stands offer a controlled setup for mapping sensor response before tools enter production. Bench fixtures apply known hydraulic force increments across ten discrete steps up to maximum operating pressure. Comparing these bench-tested response curves against dynamic press readings highlights mechanical binding and alignment issues within the mold assembly.

Hydraulic Bench Calibration Routines
Testing transducers off-press requires hydraulic fixtures that simulate clamping conditions. An inline reference load cell and hydraulic ram apply controlled force increments to the sensor or ejector pin assembly while data acquisition hardware records output voltage at each step to build a linear regression curve. The resulting slope gives effective sensitivity in picocoulombs per Newton or millivolts per bar, accounting for non-linearity, spring compliance, and pin friction before production starts.
Factory calibration matrices yield less than one percent error under static oil pressure at twenty degrees Celsius.

What Verifies Charge Amplifier Scaling during Dynamic Trials?
Dynamic trials using high-speed data acquisition capture melt front arrival alongside hydraulic pressure profiles. Process engineers correlate peak hydraulic pressure with peak cavity pressure during packing, tweaking amplifier scaling factors until measured cavity pressure matches melt compressibility models. Discrepancies between calculated and actual readings point to pin friction or restricted cavity venting.
- Amplifier Sensitivity Reset aligns charge amplifier picocoulomb-per-bar settings directly with factory calibration certificates.
- Zero Offset Drift Compensation sends an automatic reset pulse at mold open to clear residual charge before the next cycle.
- Peak Pressure Correlation cross-checks peak cavity pressure against calculated nozzle pressure, accounting for runner pressure drops.
- Volumetric Filling Switchover Verification sets machine V/P transition points using cavity pressure thresholds instead of screw position limits.
Calibration guidelines generally recommend scaling sensor sensitivity to expected peak cavity pressure rather than the transducer’s maximum capacity to optimize measurement resolution.

Thermal
Molten polymers entering cavity impressions at 200 to 350 degrees Celsius create sharp transient thermal gradients across the sensor face. This rapid heating causes differential thermal expansion between the outer transducer casing and internal quartz elements, generating false pressure signals known as thermal shock drift.
Quartz crystals remain linear up to their Curie phase transition temperature of 573 degrees Celsius, but practical operating limits are much lower. Housing seals and pre-load disc springs begin relaxing above 200 degrees Celsius. Continuous operation at elevated mold temperatures degrades internal insulation, accelerating charge leakage and destabilizing baselines during extended hold cycles.

Transient Thermal Shock Effects
Contact with the melt front generates steep temperature gradients across the sensing diaphragm. As the front face expands while the rear stays cool, mechanical shear stress develops across internal quartz elements. This produces a transient false charge that shows up as a spike or negative pressure dip right before melt pressurization begins.
Direct sensors often use protective coatings ~ such as polyimide films or vacuum-deposited ceramics ~ to slow heat transfer into the diaphragm and suppress signal distortion.
Melt contact induces transient thermal stresses that alter piezo charge response.

Zero-Point Shift Mitigation
Resetting charge amplifiers at mold separation removes accumulated electrical offset before each shot. Long cycle times and sustained high temperatures can degrade cable insulation resistance, causing signal drift. Modern amplifiers perform an auto-zero routine during tool opening, grounding signal lines to purge residual charge.
Resetting every cycle locks the zero-pressure baseline to atmospheric conditions, preventing cumulative drift over multi-day runs.
- Transducer Serial Number linking the sensor hardware to its calibration curve and tool maintenance history.
- Calibrated Sensitivity Factor defining exact output values in picocoulombs per bar or picocoulombs per Newton.
- Amplifier Scale Setting specifying input range parameters used during charge-to-voltage signal conversion.
- Thermal Compensation Coefficients providing signal correction factors across the operating temperature range.
- Hydraulic Bench Baseline Test Curve supplying reference load-versus-voltage records for maintenance audits.
Unaddressed thermal drift makes it difficult to tell whether signal variations stem from actual changes in polymer viscosity or baseline instability across production shifts.

Economics
Adding cavity pressure hardware to production tooling requires initial capital investment but significantly cuts scrap rates. High-precision multi-cavity molds require upfront outlays for sensors, low-noise cabling, multichannel amplifiers, and control software. These expenditures pay for themselves by decoupling machine variations from part quality, reducing scrap on technical components from typical three percent baselines to under 0.1 percent.
Scientific molding relies on cavity pressure profiles to trigger machine V/P switchover, transferring control from screw position to the actual state of cavity fill. When resin lot variations alter melt viscosity, fixed-position switchover produces under-filled or flashed parts. Using cavity pressure sensors adapts injection duration dynamically, maintaining consistent volumetric filling, packing transfer, and part dimensions despite material variations or machine drift.

Decoupling Process Windows from Machine Variability
Viscosity shifts in raw resin cause dimensional variation unless packing profiles adjust dynamically. Transducers placed near the end of fill detect melt arrival, telling the controller to transfer to holding pressure the moment impressions are full. This closed-loop control eliminates reliance on hydraulic repeatability or screw position calibration, keeping dimensions tight to DIN 16742 Class TG3 criteria across different presses.

Amortisation and Scrap Rate Break-Even
Multi-cavity molds producing high-volume technical components recover sensor costs through reduced inspection expenses and shorter cycle times. Automatic 100 percent qualification using peak pressure and pressure integral thresholds replaces manual sampling. End-of-arm robotics receive real-time pass/fail signals from sensor controllers, instantly sorting suspect parts into quarantine bins to protect good production lots.
| Tooling Setup | Instrumentation Cost (USD) | Baseline Scrap Rate | Instrumented Scrap Rate | Break-Even Volume (Units) |
|---|---|---|---|---|
| Single-Cavity Medical Tool | $6,500 | 2.5% | 0.05% | 45,000 |
| 4-Cavity Connector Tool | $18,200 | 3.0% | 0.10% | 120,000 |
| 16-Cavity Optical Lens Tool | $54,000 | 4.5% | 0.15% | 210,000 |
| 32-Cavity Fluidic Micro-Tool | $98,000 | 5.0% | 0.20% | 310,000 |
For example, consider a 16-cavity precision mold producing engineering thermoplastic parts priced at $1.80 each, with an annual volume of two million units. Installing multi-channel cavity pressure monitoring for an upfront hardware cost of $54,000 cuts process scrap from 4.5 percent to 0.15 percent. This reduction eliminates more than 87,000 defective parts annually, saving roughly $156,000 per year in material and machine time.
Payback on the capital investment occurs within four months of continuous production, converting process stability directly into improved operational margin.