Micro Mould Cavity Pressure Sensor Placement Mechanics
Sub-millimetre cavity pressure sensor placement requires sub-two-micron pin clearances and end-of-fill installation to decouple micro-melt viscosity from V/P switchover.


Melt
Polymer flow through cavities thinner than 0.40 mm creates extreme fluid dynamic conditions that dictate where sensors must sit. Micro-channel velocities drive shear rates past 100,000 s⁻¹, triggering rapid non-Newtonian shear thinning while heat dissipates almost instantly into the tool steel. A frozen layer forms on cavity walls within milliseconds, rapidly narrowing the open channel.
Standard injection moulding maintains a fairly stable bulk temperature along core flow paths, but micro-moulding destroys this thermal equilibrium as the surface-area-to-volume ratio climbs sharply with every reduction in wall thickness. In a liquid crystal polymer part with a 0.20 mm wall, that frozen layer chokes off more than 40 percent of the cavity thickness before the flow front even reaches its limit. Pressure drops across these micro-channels scale inversely with the cube of the hydraulic radius, driving local gradients past 1,500 bar per centimetre.
Viscous heating directly affects flow front resistance. Shear in the central core generates heat that works against rapid cooling from the conductive steel. While high melt velocity keeps the flow channel open, dropping injection speed even slightly leads to immediate freeze-off.
Gate-area pressure sensors register the sharp pressure spikes of high-velocity filling, while sensors at the flow terminus read lower, delayed profiles. Downstream locations show whether the melt stays fluid enough to pack out micro-gears, thin webs, or optical arrays before freezing solid. Putting a sensor right next to a micro-gate risks picking up localized runner entrance turbulence and jetting instead of genuine cavity pressure.
But placing it only at the end of fill leaves the setter blind to early packing behavior and pressure loss across the part.
| Polymer Grade | Nominal Wall (mm) | Shear Rate Band (s⁻¹) | Pressure Loss Rate (bar/mm) | Viscous Heat Shift (°C) | Frozen Layer Fraction (%) |
|---|---|---|---|---|---|
| LCP Vectra E130i | 0.15 | 120,000 – 180,000 | 185 – 240 | +18 – +24 | 45 – 55 |
| PEEK 150G | 0.20 | 80,000 – 140,000 | 140 – 190 | +12 – +17 | 35 – 45 |
| POM Delrin 500P | 0.30 | 40,000 – 90,000 | 85 – 130 | +6 – +11 | 25 – 35 |
| PC Lexan 121R | 0.40 | 20,000 – 55,000 | 50 – 85 | +3 – +7 | 15 – 25 |
Steel geometry dictates how the melt behaves. Force reaches a sensor diaphragm only if the melt path stays hydraulically continuous. If polymer freezes over the sensor face before peak pressure arrives, the transducer registers the mechanical stiffness of solidifying plastic instead of hydrostatic pressure.
That structural decoupling distorts the curve, hiding short shots or sink marks behind misleading pressure signals. Choosing a mounting location means matching the pin face area to local wall thickness. Standard sensors use pin diameters from 1.0 mm to 2.5 mm.
In micro-moulding, a 2.5 mm pin can easily span an entire feature or exceed local wall width, forcing the toolmaker to seat the pin on a nearby ejector rib, runner junction, or dummy pocket. Micro-sensors with 0.5 mm or 1.0 mm pins solve spatial fit problems, but they concentrate mechanical stress in the tool steel. Micro-injection moulding demands nozzle pressures of 2,000 to 2,800 bar, driving intense loads into these small sensor faces.
Unless pin-to-bore clearances are kept within sub-micron tolerances, localized steel deflection will produce microscopic interlock grooves that catch flash.
Melt compressibility further complicates signal interpretation in tiny volumes, where solidification happens in under 100 milliseconds. As the screw switches from velocity control to packing pressure, volumetric shrinkage occurs alongside rapid thermal contraction. Signal readings across this brief window combine elastic melt compression with swift pressure decay as viscosity climbs toward infinity.
A sensor placed in a thin area next to a thicker section will show premature pressure loss whenever the local wall or gate freezes early. Reading these curves means separating local melt behavior from machine ram pressure. Because the sensor face acts as a boundary transducer, it measures perpendicular force while parallel melt flow across the pin head generates parasitic friction.
This axial-to-radial load transfer introduces errors as high as 12 percent when the sensor tip sits flush in a high-shear zone.
Tooling purchase orders must stipulate maximum allowable pin clearance of 0.002 mm for sensor bores operating above 1,800 bar to prevent melt ingress per DIN 16742 guidance.
Signal stability over thousands of cycles depends heavily on thermal management around the sensor pocket. Piezoelectric quartz elements generate micro-coulomb charges proportional to applied force, but thermal transients expand both the sensor housing and the surrounding tool steel. When micro-moulds run hot ~ 160°C to 200°C for PEEK or 90°C to 120°C for LCP ~ temperature shifts between the cavity face and internal sensor cooling circuits cause baseline drift as thermal balance swings over a shift.
Designers need thermal isolation gaps or uniform cooling spacing around the housing to keep thermal expansion out of the force reading. Placing a sensor directly opposite a micro-gate exposes the quartz element to harsh thermal shocks every shot, while moving it slightly off-axis protects calibration over long runs.
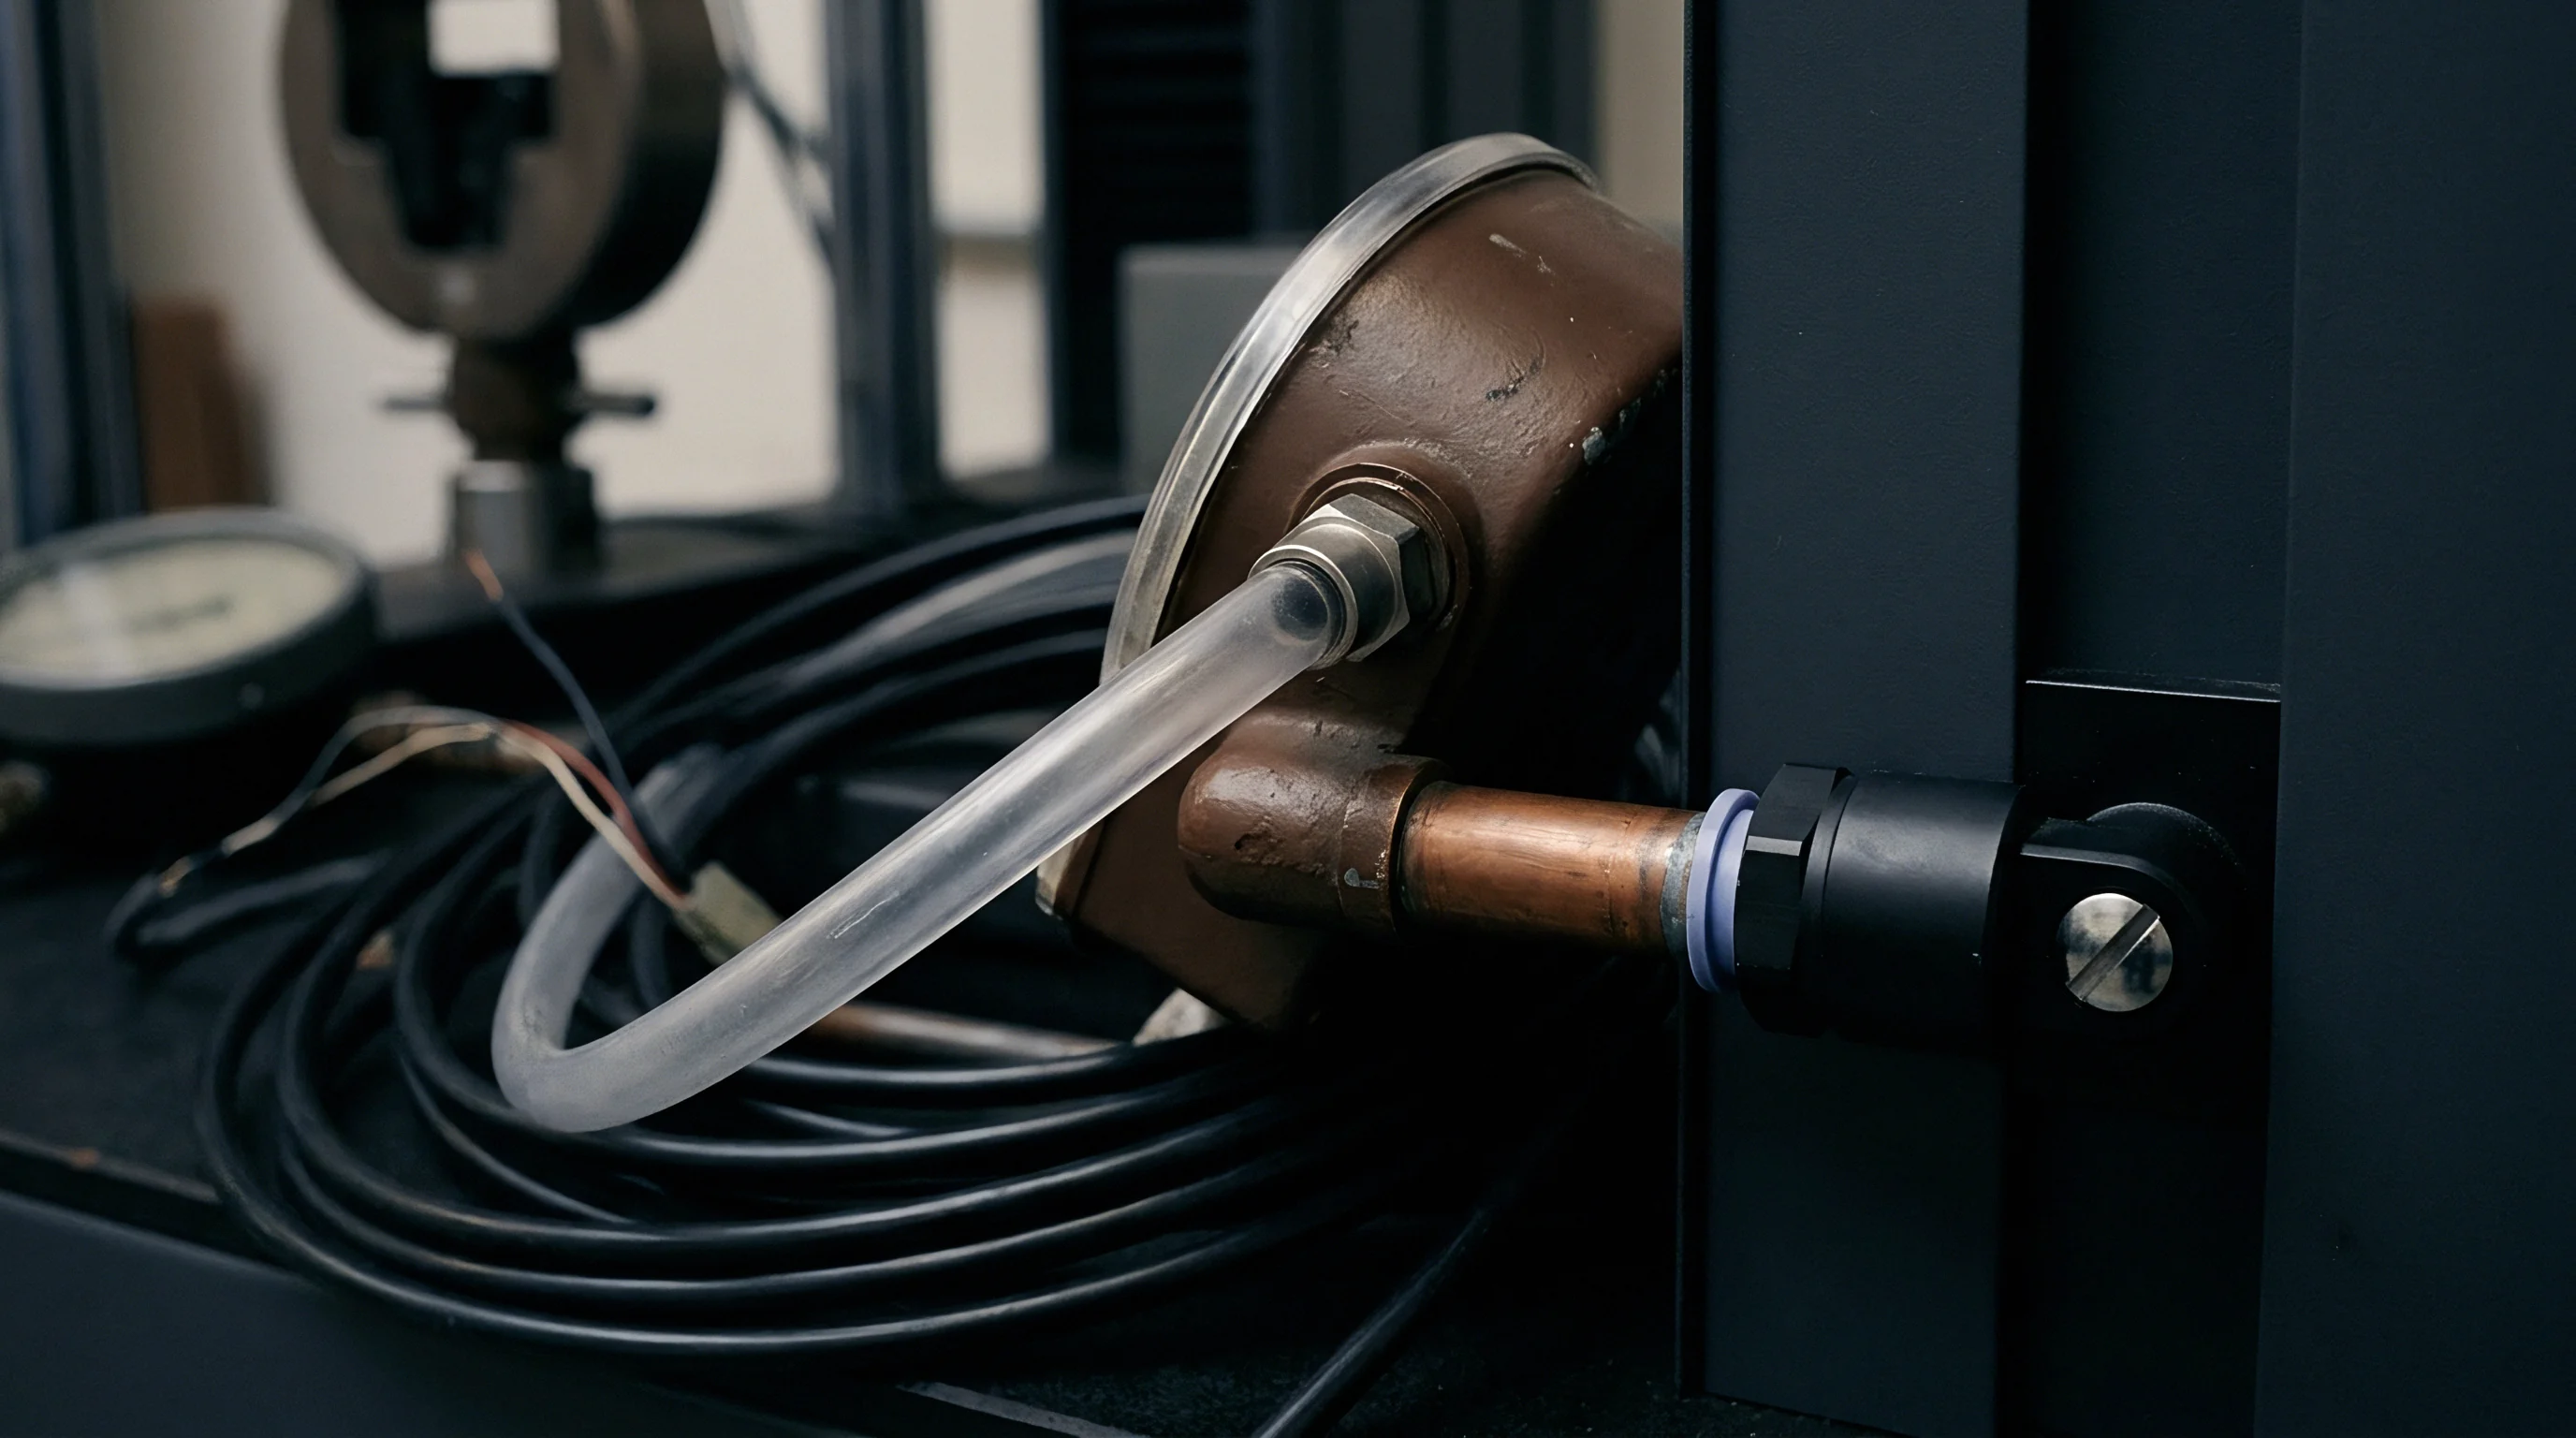
Micro-Scale Pressure Drop Failure Modes
Pressure drop across sub-millimetre sections causes defect patterns that destroy dimensional control if sensor layout and mechanics are misaligned.
- Premature Flow Front Freeze occurs when local cavity pressure drops below the threshold needed to overcome skin resistance, leaving distant micro-features short.
- Localized Viscous Degradation happens when extreme shear near tight gates heats polymer beyond its thermal limit, leaving micro-voids and gas burns across the sensor face.
- Hydrostatic Pressure Shielding develops when an oversized pin spans frozen skin, measuring solid-phase rigidity instead of actual fluid packing pressure.
- Flash Wall Separation occurs when local hydraulic force overcomes clamp force over small areas, forcing parting lines open and packing melt into sensor clearances.
Mapping local flow resistance back to melt viscosity relies on clear rheological scaling. Across a 0.25 mm wall, viscosity shifts constantly from skin to core: resin next to the frozen layer sees maximum shear stress, while the hot core flows with much lower resistance. This effective hydraulic diameter changes dynamically throughout the filling pulse.
As a result, an upstream sensor near the runner records a steep linear pressure ramp followed by a plateau in packing, whereas downstream sensors show delayed, non-linear pressure curves that attenuate quickly during hold. The delta between these two sensors gives setup techs a live metric for tracking batch consistency, material breakdown, and thermal drift. If raw resin lot variation shifts the melt flow index by just 10 percent, the downstream peak pressure changes proportionally, giving press controls a clean signal for closed-loop adjustment.
Process windows in micro-moulding are tight because thin resin layers dump heat into the steel almost instantly. Injection speeds over 300 mm/s are routine, pushing fill times below 0.05 seconds. At that speed, a sensor needs a dynamic response rate above 50 kHz to register the pressure spike created when melt hits the end of fill.
Standard piezoelectric sensors meant for conventional moulding are too slow; they output smoothed, lagged curves that clip true peak forces. Micro-sensors built with high natural resonance frequencies capture these fast transients accurately. Installation mechanics have to support that electronic speed ~ long transmission pins introduce mechanical damping and friction losses.
Aligning the pin assembly directly with primary melt flow ensures clean force transfer so technicians can trigger switchover at the precise microsecond of fill completion.
As a rule of thumb, sensor pin diameter should never exceed twice the nominal wall thickness of the feature being measured.
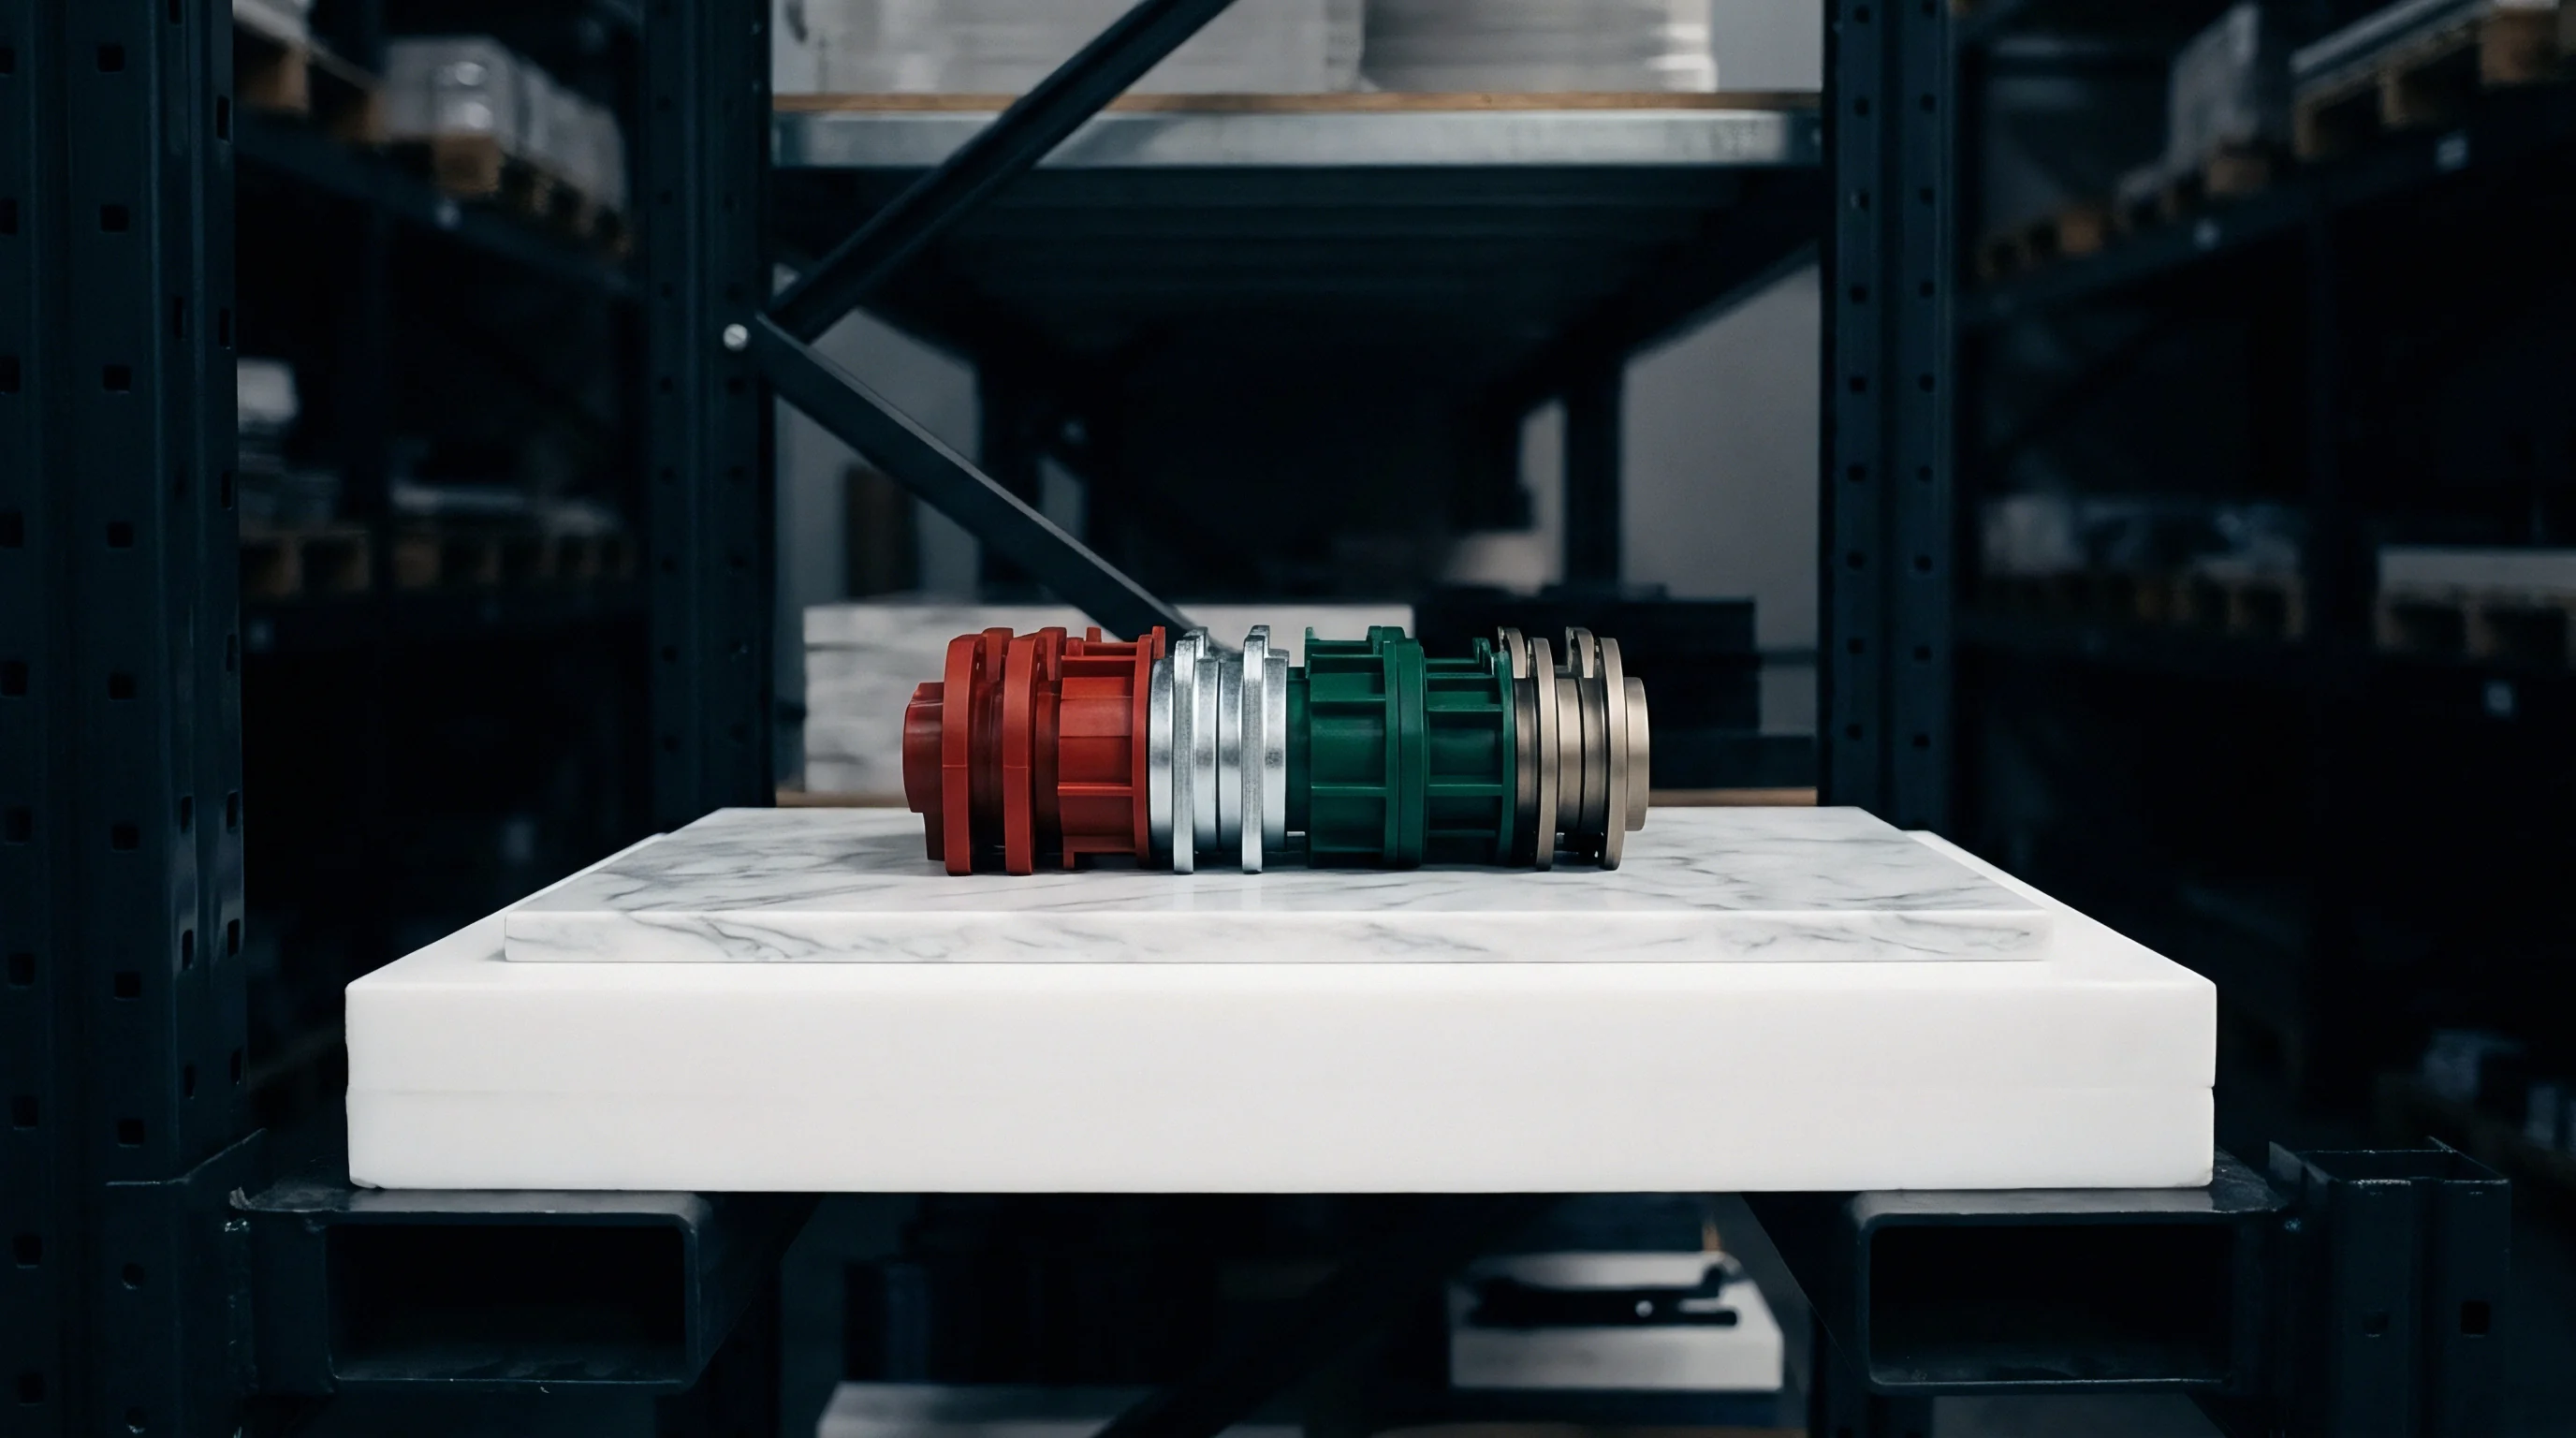

Pin
Mounting cavity pressure sensors in micro-tools takes precise toolmaking to clear core pins, ejector mechanisms, and conformal cooling lines. Direct mounting seats the sensor diaphragm flush with the cavity wall, putting the melt in contact with the element. Indirect mounting tucks the sensor behind an ejector or transfer pin, transmitting force down the pin to a transducer in the cavity or ejector retaining plate.
Direct mounting offers clean signal response free of mechanical friction, but micro-cavity layouts rarely leave room for it. A direct 1.0 mm transducer head needs a threaded bore with tight seating perpendicularity and fine clearance tolerances. In 32- or 64-cavity medical molds, that space is already taken up by core pins, dowels, and cooling lines.
Using modified 0.5 mm or 0.8 mm ejector pins offers a practical work-around, transferring force down to sensors housed safely in secondary plates.
Pin friction is the main drawback of indirect measurement. High melt pressure generates side loads that push ejector pins against their bore walls, creating friction that absorbs part of the force signal before it reaches the transducer base. When injection pressures flex tool plates, pin binding worsens, introducing hysteresis ~ seen as delayed pressure response on fill and residual force readings after cavity venting.
Toolmakers control friction by shortening guide lengths, stepping down shank diameters behind the head, and applying hard, low-friction coatings like TiAlN or DLC. Bore clearance requires a fine balance: keeping it under 0.002 mm prevents flash, while opening it up reduces binding but increases flash risk with runny resins like LCP.
| Mounting Architecture | Pin Diameter (mm) | Bore Clearance (µm) | Friction Loss (%) | Signal Delay (ms) | Max Tool Temp (°C) |
|---|---|---|---|---|---|
| Direct Flush Mount | 1.0 – 2.5 | N/A (Sealed) | 0.0 | < 0.1 | 200 |
| Indirect Ejector Pin | 0.8 – 1.5 | 1.5 – 2.5 | 4.5 – 12.0 | 0.5 – 1.5 | 160 |
| Sub-Millimetre Indirect Pin | 0.4 – 0.6 | 1.0 – 2.0 | 8.0 – 18.0 | 1.0 – 2.5 | 140 |
| Dual-Function Ejector Sensor | 1.0 – 2.0 | 2.0 – 3.0 | 3.0 – 9.0 | 0.3 – 1.0 | 150 |
Sub-millimetre pins need careful structural design to prevent buckling under high injection loads. A 0.5 mm pin under 2,000 bar cavity pressure sees about 39.2 Newtons of axial force. That sounds minor, but with a pin area of just 0.196 mm², compressive stress in the steel hits 200 MPa.
If unguided length exceeds Euler buckling limits, the pin bows inside its bore, driving up wall friction and risking permanent bend. Toolmakers place rigid guide bushings as close to the cavity face as possible, keeping unguided length-to-diameter ratios under 6:1. Materials usually favor ultra-fine-grain high-speed steels or micro-grain tungsten carbide hardened above 60 HRC to give the yield strength and elastic modulus needed for repeated compression cycles.
Force pin binding occurred when flash clearance exceeded four micrometres during liquid crystal polymer trials. Low melt viscosity allowed micro-filaments of resin to bleed into the annulus around the pin head. Once cooled, these filaments wedged the pin tight, preventing force transmission back to the transducer.
The pressure trace flattened out, showing no response to packing adjustments. Teardowns revealed solid resin rings wrapped around the top 2.0 mm of the shank. Fixing it required re-machining the cavity insert, pressing in a hardened guide bushing with 0.0015 mm clearance, and adding an anti-flash relief step behind the land.
When tool drawings lack explicit sensor recess tolerances, returning them for revision ensures every indirect pin bore meets exact diameter and perpendicularity specs.
Dynamic calibration trials prove that indirect pin friction reduces peak pressure amplitude by 14.2 bar for every 10 millimetres of guided pin length in unlubricated tool steel bores.
Sensor pre-loading is equally critical. Piezoelectric quartz transducers read charge shifts caused by changing compressive force. To keep the signal linear and prevent internal shifting during cyclic unloading, the sensor housing must be torqued down against its mounting shoulder during installation.
Too little pre-load leaves loose mechanical contact, triggering baseline drift and non-linear output on fill. Too much crushes the quartz plates or distorts cavity steel, damaging both tool and sensor. Pre-loading micro-tools takes calibrated torque wrenches or precision shims that account for differential expansion between housing alloys and tool steel plates, as thermal expansion at operating temperatures alters the installed pre-load force.

Selection Matrix for Direct versus Indirect Sensor Installation
Determining sensor mounting mechanics depends on cavity dimensions, plate layout, and acceptable tool complexity.
- Direct Flush Mounting demands space for transducer tip diameters of at least 1.0 mm directly behind the cavity face, delivering zero friction loss and sub-millisecond response for optical components.
- Indirect Pin Mounting uses ejector pins down to 0.4 mm diameter to transmit force down to secondary plates when micro-cavity space prevents direct installation.
- Dual-Function Ejector Sensor Mounting sits quartz elements directly behind ejector pins, pairing part ejection with pressure sensing to eliminate extra holes in the part layout.
- Sub-Plate Transducer Mounting seats button sensors behind whole cavity blocks, measuring aggregate pressure across multi-cavity inserts where individual pin placement is impossible.
Diaphragm deflection also affects part finish. Under peak injection loads, even direct-mount micro-sensors flex by 1 to 5 micrometres. A sensor tip sitting 5 micrometres proud leaves an impression on the part, while a 5-micrometre recess forms a raised micro-boss.
On micro-fluidic chips or tiny connectors, steps that size disrupt micro-channels or misalign mating pins. Installations require flushness held within +0.000 / -0.002 mm against cavity steel. That level of precision takes final grinding and polishing of the sensor tip while locked in the cavity insert, or optical metrology shimming before commissioning.
Machining sensor mounting bores takes wire EDM, jig grinding, and sinker EDM. Bore concentricity between pin guide diameters and transducer threads must stay within 0.005 mm total indicator reading. Non-perpendicular seating surfaces induce uneven bending loads across quartz elements, distorting signals and shortening sensor life.
Pin bore finishes must be ground or polished to Ra 0.1 µm or better to minimize friction. Standard drilling and reaming will not work; toolmakers must perform hardened-state grinding or high-speed CNC milling inside fully heat-treated cavity blocks to hold geometric specs under clamping loads.
A tooling modification to add clearance behind a bound force pin added three thousand dollars in toolroom machining and delayed qualification by two weeks after flash locked the ejector plate during first-article trials.

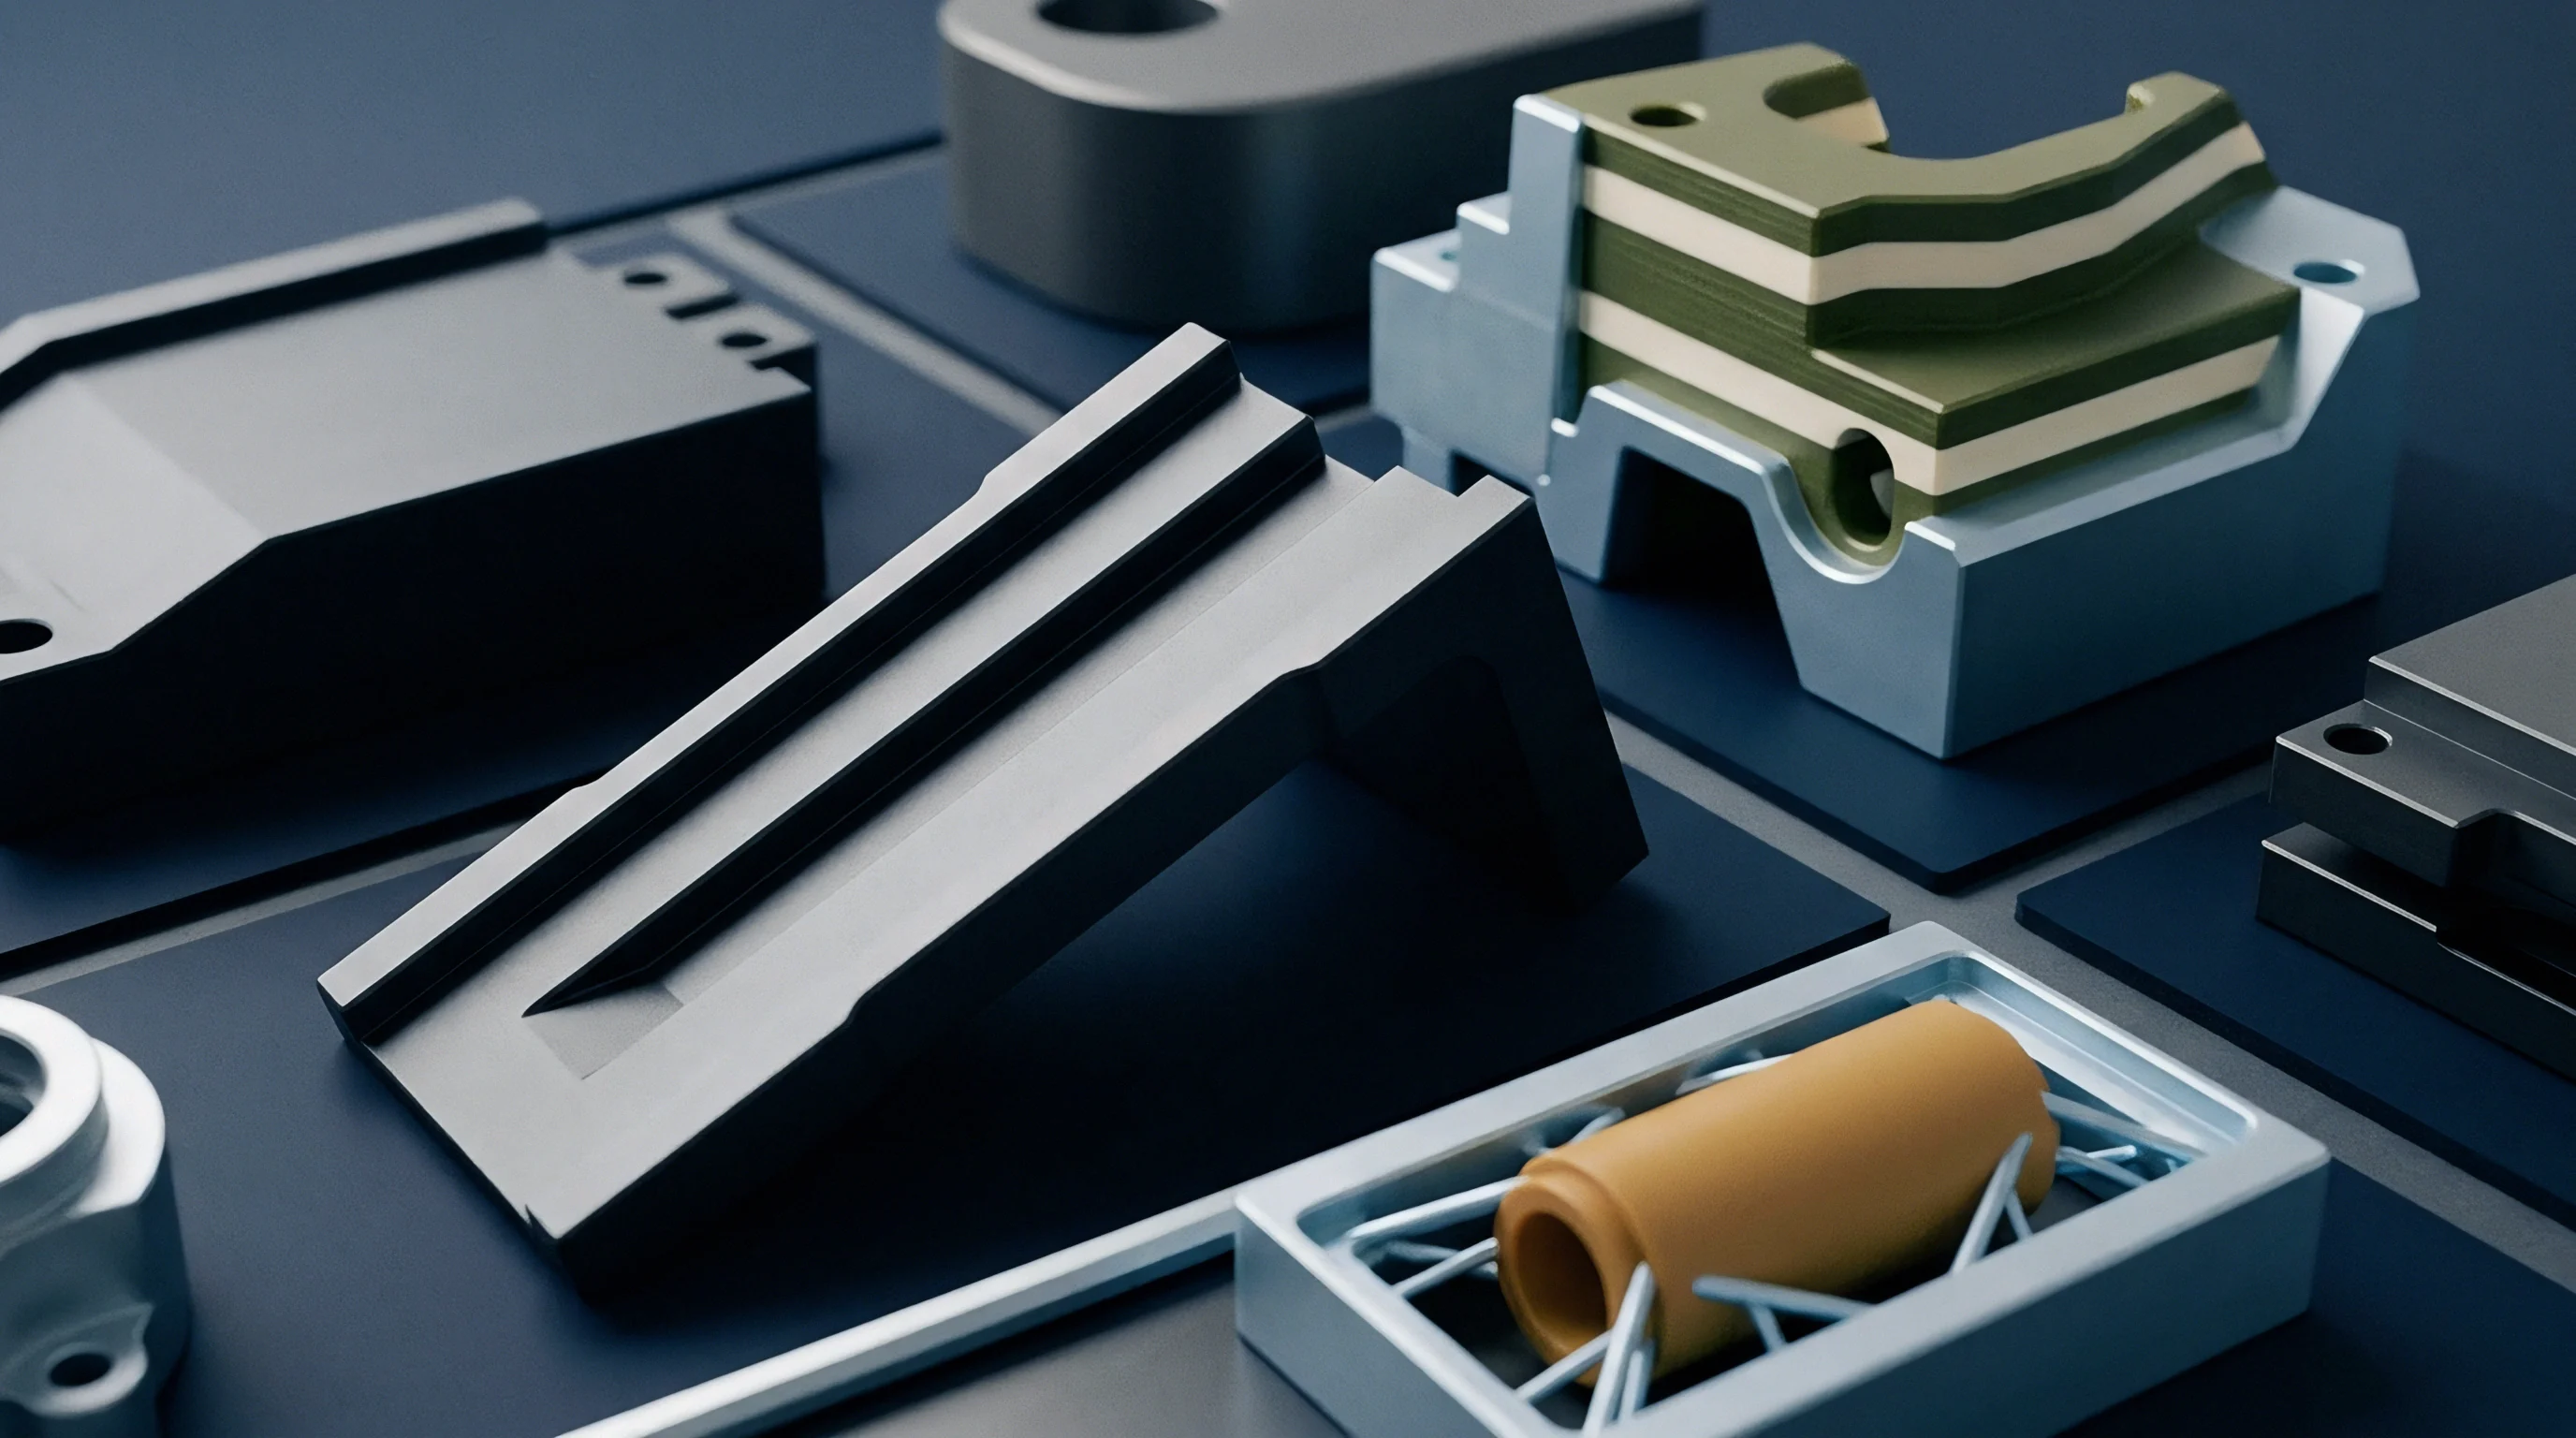
Locus
Positioning sensors effectively along the flow path depends on melt rheology, part layout, and process goals. Placing a transducer near the gate gives immediate data on runner pressure drop, gate freeze, and machine repeatability. Gate pressure profiles show sharp rise times linked directly to screw speed during filling.
They miss what happens downstream, though ~ hesitations, vent restrictions, or short shots near the end of fill won’t show up at the gate. If the goal is triggering V/P switchover on full fill, the sensor belongs near the end of the flow length, where the fill signal spikes immediately to initiate hold before flash forms.
Mid-cavity positions offer a solid compromise for general process monitoring, though they require checking wall thickness changes and weld line locations. In parts with internal cutouts ~ like micro-switch bodies or sensor housings ~ melt streams split around core pins and rejoin, forming weld lines. These boundaries are structural weak points where cooler flow fronts join under lower pressure.
Seating a sensor at or near a weld line checks actual packing pressure where fronts meet, verifying that there is enough pressure to fuse the polymer chains. If local pressure drops below material-specific limits, mechanical strength falls off and parts risk failing under load.

Where Does Pressure Loss Shear Micro-Melt Most Severely?
Pressure drops concentrate across geometry transitions where flow channels narrow into micro-features, demanding strategic sensor placement to capture critical shear events.
Shear heating and pressure losses vary along the flow path. Velocity peaks near the gate, creating maximum shear rates and local temperature jumps. Further downstream, velocity drops as the thermal boundary layer thickens, increasing flow resistance.
A gate sensor registers heavy pressure while the end-of-fill transducer reads zero through the first 80 percent of the injection stroke. Once the cavity packs out, pressure builds backward from the end of fill toward the gate. In tools with flow-length-to-thickness ratios past 150:1, true pressure balance across the part rarely occurs because the thin channel freezes before packing pressure spreads throughout the cavity.
Routine inspection of piezoelectric charge cables after thermal cycling catches shield degradation. Micro-sensor signals output charge in the pico-coulomb range, leaving them vulnerable to noise from mold heaters and servo motors. High-impedance cables routed through tight tool plate slots flex continuously during ejection strokes.
Frayed shielding or worn insulation introduces electrical noise that masks subtle pressure shifts during fill. Routine PM procedures must include mega-ohm insulation tests to ensure the noise floor stays below 0.5 percent of full scale across production runs.
Multi-sensor setups give complete visibility over pressure distribution across the cavity, though space and budget limit where they can be used. Running one sensor near the gate and another at the end of fill provides live pressure drop numbers across the part, directly tracking melt viscosity inside the mold. If resin lot variation drives viscosity up, the delta pressure curve widens during injection, giving the machine controller a clean signal to auto-correct barrel heat or injection speed.
Paired sensors also measure flow front velocity: by tracking elapsed time between the pressure response at the gate and end-of-fill transducers, the controller calculates average melt speed across the cavity to optimize injection speed.
Venting alignment is another consideration. As melt enters the micro-cavity, it pushes air out through parting-line or ejector-pin vents. If vents plug with resin deposits or release agents, trapped air compresses at the end of fill, creating back-pressure against the melt.
A sensor placed right next to a vent records this gas compression as an early, shallow pressure ramp before the melt actually arrives. Distinguishing trapped gas pressure from polymer contact comes down to the rate of pressure change (dP/dt): plastic contact triggers a steep, near-vertical spike, while gas compression builds along a smooth exponential curve. Downstream sensors end up serving double duty, tracking flow front arrival and monitoring vent cleanliness over long runs.
Post-moulding metrology on a micro-fluidic plate proved that distal feature warpage correlated exclusively with end-of-fill packing pressure variations that a single gate-mounted pressure sensor failed to register.
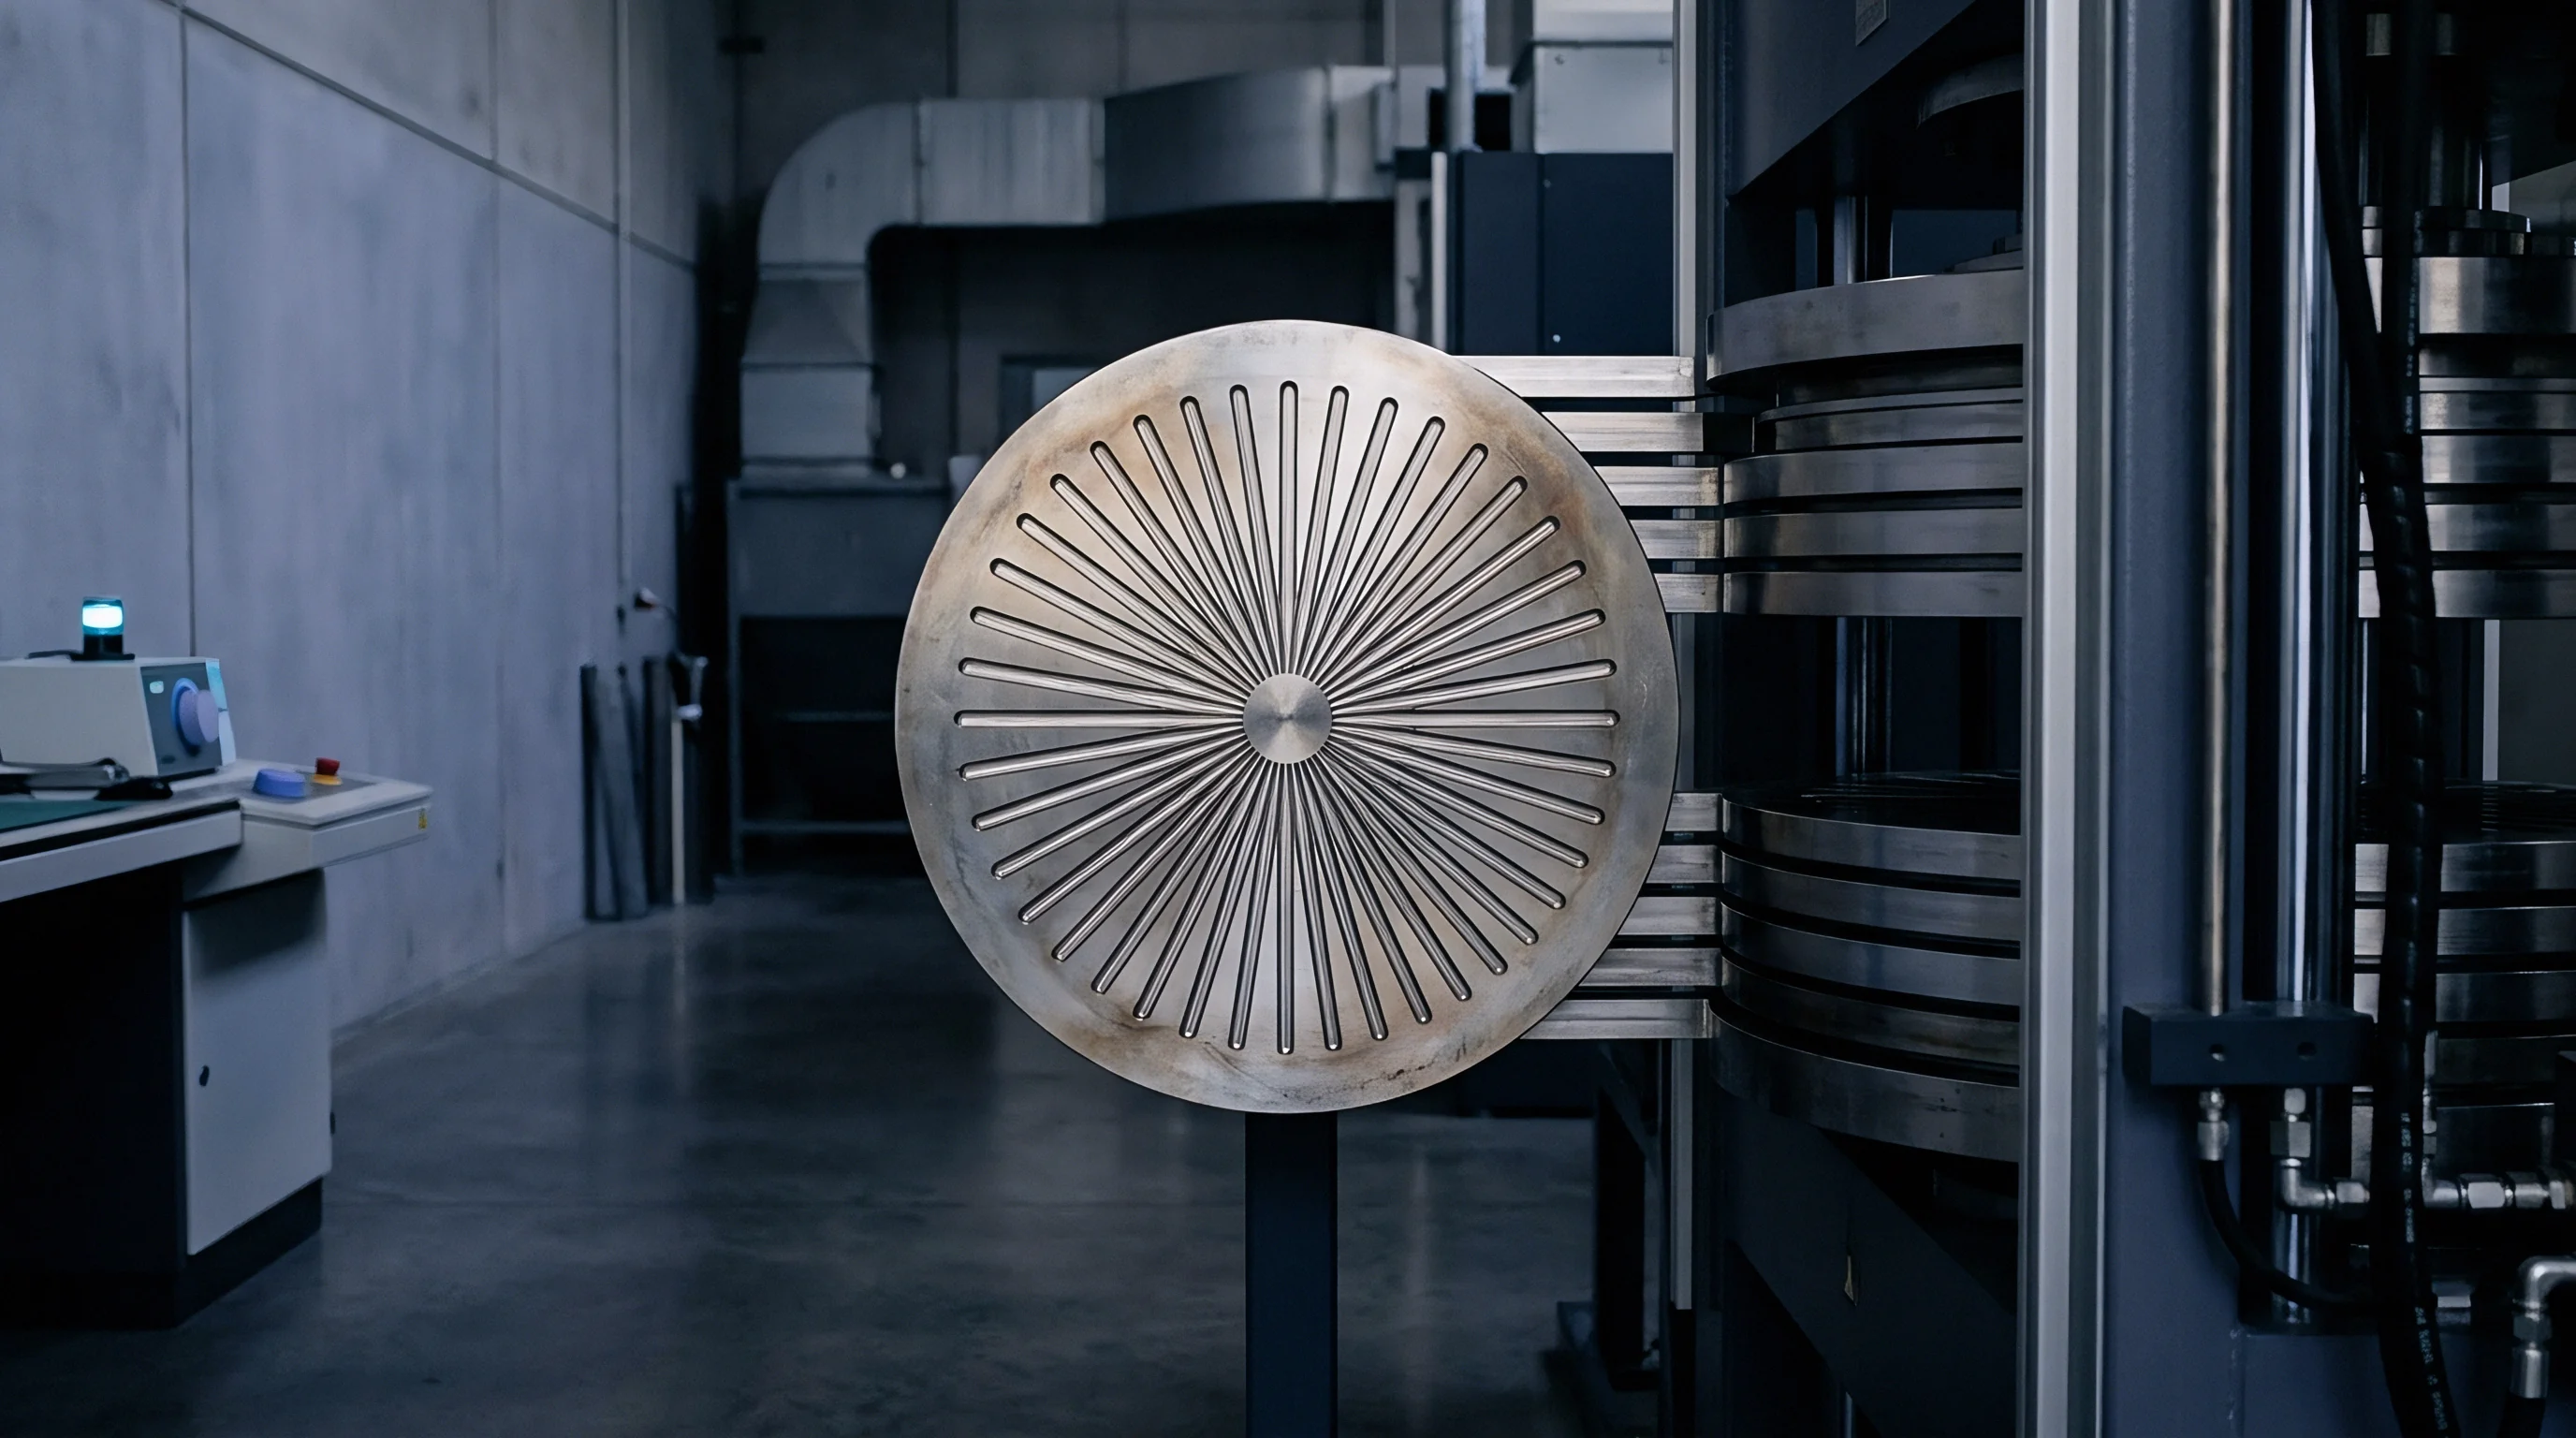
Control
Wiring micro-cavity sensors into press controls allows closed-loop regulation that replaces conventional screw-position V/P switchover. Position-based transfer assumes uniform barrel cushion, stable resin density, and zero check-valve leak. But when shot weights fall below 0.5 grams and cushion volume is tiny, minor non-return valve leakage or pellet variations create noticeable shot-to-shot swings.
Under those conditions, position transfer leads to mass variation, sink marks, or flash. Triggering switchover from cavity pressure relies on real-time melt pressure inside the mold, isolating part quality from mechanical press tolerances upstream.
Cavity pressure transfer works by assigning a threshold value to the sensor signal. As melt hits the transducer tip near the end of fill, pressure spikes, prompting the controller to switch instantly from velocity control to packing mode. This handoff eliminates the hydraulic shock that happens when a high-speed ram impacts a full cavity without deceleration.
Control loop response time is critical here: total delay across sensor threshold, digitization, PLC processing, and valve response cannot exceed 1 millisecond. High-speed fieldbus architectures with dedicated sensor cards run update rates up to 10 kHz to maintain that speed.
| Control Paradigm | Switchover Trigger | Weight Cpk (1.0 g Part) | Dimensional Variance (%) | Scrap Rate Target (%) | Setup Time (Hours) |
|---|---|---|---|---|---|
| Screw Position Transfer | Linear Encoder (mm) | 0.85 – 1.10 | ±0.45 | 2.5 – 5.0 | 1.5 |
| Hydraulic Pressure Transfer | System Pressure Transducer | 0.95 – 1.25 | ±0.35 | 1.8 – 3.2 | 2.0 |
| Cavity Pressure Transfer (Gate) | Near-Gate Sensor Threshold | 1.35 – 1.65 | ±0.18 | 0.5 – 1.2 | 3.5 |
| Cavity Pressure Transfer (End-of-Fill) | End-of-Fill Sensor Threshold | 1.67 – 2.10 | ±0.08 | < 0.1 | 4.5 |
Scientific moulding principles dictate using real-time cavity feedback to tailor packing curves against volumetric shrinkage. After switchover, the press runs a multi-stage packing profile to feed extra melt into the cavity during cooling. In thin micro-parts, the packing window is short ~ usually 0.2 to 1.5 seconds.
The sensor tracks pressure decay as the gate freezes off; once the decay curve stops responding to changes in hydraulic pressure, gate seal is complete. Reading gate seal directly off cavity pressure curves cuts out wasted hold time, shortening cycle times and avoiding over-packing stresses that warp parts or cause ejector binding.
The sequence below establishes the execution steps for calibrating cavity-pressure-based V/P switchover on micro-moulding presses.
- Run a screw-position short-shot series to find the injection velocity needed to fill 95 percent of cavity volume without packing pressure.
- Set the cavity sensor sampling rate to maximum frequency on the data acquisition system.
- Step up injection speed until the end-of-fill sensor shows a clean, near-vertical pressure rise at fill completion.
- Set the cavity pressure switchover trigger at 70 percent of the peak pressure recorded by the end-of-fill transducer on full-shot runs.
- Enable cavity pressure switchover control on the press interface, overriding position-based triggers.
- Tune secondary hold profiles to hit target part mass and drawing dimensions.
- Confirm process capability over a 500-shot run using automated mass and optical dimension metrology.
Statistical process control programs use the peak cavity pressure integral as an automated quality gate. Controllers integrate the pressure curve over time for every shot, measuring total mechanical and thermal energy imparted to the melt. If a partial nozzle clog, temperature drop, or valve delay alters fill behavior, the pressure integral drifts outside control limits.
The machine triggers a diverter flap, ejecting suspect parts without pausing production. That 100 percent inline monitoring is vital in medical device production, where inspecting micro-parts by hand is slow and unreliable.
Process capability studies show that converting a 16-cavity micro-tool from position switchover to end-of-fill cavity pressure control increased Cpk values for critical part dimensions from 1.04 to 1.82.
Peak holding pressure control offers a more advanced way to regulate part density. Rather than holding hydraulic pressure constant during packing, the controller monitors the cavity sensor and adjusts hydraulic pressure on the fly to hold a flat cavity pressure target. This compensates for lot-to-lot shifts in resin viscosity and compressibility.
If resin viscosity climbs, hydraulic pressure rises to push material in; if viscosity drops, hydraulic pressure backs off to protect against over-packing and flash. Running peak holding control requires fast servo-electric or electro-hydraulic injection units that respond within milliseconds.
What remains unresolved is whether fiber-optic Fabry-Perot interferometry sensors can match the mechanical durability and calibration stability of quartz piezoelectric transducers in high-temperature micro-moulding tools over time.
Cost
Adding cavity sensors to micro-tooling means balancing upfront cost and machining complexity against long-term maintenance. A single piezoelectric package ~ sensor, force pin, high-impedance cable, and charge amplifier ~ costs between 2,000 and 4,500 USD in hardware alone. In multi-cavity tools, that scales quickly: instrumenting a 32-cavity mold adds 64,000 to 144,000 USD in components before factoring in precision machining and wire routing.
Buyers have to balance that initial spend against scrap reduction and inspection savings over the tool’s production life.
| Cavity Count | Sensor Coverage Mode | Hardware Cost (USD) | Toolroom Machining (USD) | Scrap Reduction Target (%) | Break-Even Volume (Units) |
|---|---|---|---|---|---|
| 4-Cavity | 100% (All Cavities) | 10,000 – 16,000 | 4,000 – 7,000 | 4.2 | 180,000 |
| 8-Cavity | 100% (All Cavities) | 20,000 – 32,000 | 8,000 – 14,000 | 3.8 | 350,000 |
| 16-Cavity | 50% (Representative) | 22,000 – 36,000 | 9,000 – 15,000 | 2.5 | 420,000 |
| 32-Cavity | 25% (Flow Ends Only) | 24,000 – 40,000 | 10,000 – 18,000 | 1.9 | 580,000 |
Tool design and machining introduce additional overhead. Cable routing requires wider plate stacks, milled wire channels, and sealed junction boxes to shield high-impedance connectors from coolant leaks during maintenance. EDM bore sizing, pocketing, and hand shimming add 40 to 80 toolroom hours per cavity block.
Indirect pins also increase ejector assembly complexity, requiring backer plates, guide pins, and pre-load adjustment hardware. Altogether, instrumenting a tool adds 8 to 15 percent to build costs and pushes delivery schedules out by two to three weeks.
Maintenance is an ongoing expense over the life of the tool. Force pins and diaphragms suffer wear and thermal fatigue under continuous cycling. Resin micro-flashing around pin heads forces regular teardowns, ultrasonic cleaning, and pin replacements every 100,000 to 500,000 shots, depending on pressure and resin abrasiveness.
Cables damaged by plate motion or rough handling during bench cleaning are another frequent failure point. Swapping broken cables or worn sensors takes specialized toolroom time and recalibration, running 1,500 to 3,000 USD per repair plus press downtime.
Tracking diaphragm indentation marks across production runs catches sensor fatigue before flash occurs. After a million cycles of dynamic pressure spikes, transducer diaphragms experience work hardening and micro-stretching, altering zero offsets and sensitivity settings. Recalibration requires pulling sensors from the tool for lab service or running press-side load-cell checks.
Skipping recalibration allows baseline drift to creep into the process, causing press controls to gradually over-pack or under-pack parts over long runs.
Tooling quotes and master purchase agreements must incorporate clear sensor specification and liability clauses to protect the buyer from poor execution.
- Sensor Hole Geometry Warranty stipulates that seating faces, bore diameters, and concentricity meet sensor supplier specs within +0.002 / -0.000 mm, with steel rework or replacement covered by the toolmaker on inspection failure.
- Signal Fidelity Acceptance Threshold requires assembled indirect force pins to show dry-cycle friction losses under 5 percent during bench testing before tool sign-off.
- Wiring and Seal Integrity Protection mandates IP65 moisture seals and mechanical strain relief in plate wiring channels to keep coolant from grounding out charge cables.
- Spare Pin Provisioning Clause obligates the toolmaker to deliver three fitted, ground, and polished spare force pins per sensor cavity alongside first-article samples.
Justifying sensor investment comes down to scrap reduction and press throughput. In high-value applications ~ implantable medical parts, bio-resorbable pins, or micro-sensor housings ~ raw resin runs 200 to 1,000 USD per kilogram, making finished scrap expensive. Dropping scrap rates from 4 percent to 0.1 percent with inline cavity pressure rejection pays off initial sensor integration within months.
At the same time, pressure-based switchover prevents flash, letting presses run faster injection speeds and shorter cooling times for a 5 to 12 percent gain in cycle efficiency over the life of the tool.
A standard tooling contract clause specifies that the toolmaker remains financially responsible for re-machining cavity inserts and replacing damaged force pins if sensor bore clearances exceed 0.002 mm during initial T1 trials, thereby shifting pre-qualification risk away from the buyer.