Decoupled Cavity Pressure Control Methods for Mitigating Fiber Orientation Warpage in Glass Filled Polyamides
Decoupled III cavity pressure control mitigates glass-filled polyamide warpage by dynamically managing switchover and packing to equalize differential shrinkage.
Vector
Short glass fibers suspended in a polyamide melt align along local velocity gradients during injection. When 30% or 50% weight-fraction glass-reinforced PA66 moves through a cold mold cavity, the velocity profile forms a pronounced skin-core split. Shear stresses near the mold steel freeze an outer layer of fibers parallel to flow.
In the slower-cooling core, extensional transverse flow aligns fibers perpendicular to that primary stream. This orthogonal layout generates severe anisotropy in both Young’s modulus and thermal expansion coefficient.
Parallel shrinkage in PA66-GF30 typically runs between 0.2% and 0.4%, compared to 0.7% to 1.1% transversely. Across varying wall thicknesses or long flow paths in complex parts, this uneven fiber alignment creates asymmetric residual stresses. The resulting bending moments release as the part cools and conditions, turning directly into twisting and out-of-flatness.
Under standard conditioning per ISO 1110, an unconstrained 2 mm thick PA66-GF30 plaque exhibits out-of-plane bow exceeding 1.8 mm when packing leaves flow-induced orientation gradients uncompensated.
Skin Core Morphologies in Reinforced Polyamides
Melt rheology dictates how thick the frozen boundary layer grows relative to the molten interior. High injection speeds push the shear zone outward toward the tool wall, thinning the skin and leaving a wider core of randomly oriented or transverse fibers. Slower injection allows premature thermal crystallization against the cold walls, thickening that outer skin and shrinking the core fraction.
Glass fibers also change the compound’s thermal diffusivity, speeding up freeze-off compared to unfilled base resin.
Orientation tensors describe spatial fiber alignment in three dimensions. In injection molding simulations and micro-computed tomography scans, the diagonal component along the flow path reaches 0.75 to 0.85 near the skin, then drops below 0.35 at the core center. This difference creates localized stiffness swings from 9,500 MPa along the orientation vector down to under 4,200 MPa across it.

Differential Shrinkage Gradients across Wall Sections
Cooling rates across the part geometry alter crystallization kinetics in the polyamide matrix. PA66 crystallizes rapidly, forming spherulites that lock fibers into shear-induced vectors before the molecules can relax. Even with uniform volumetric shrinkage, orientation differences alone force the part to bow along its axis of highest stiffness disparity.
Traditional machine controls set holding pressure at the hydraulic cylinder, ignoring localized cavity volume loss.
Differential volumetric shrinkage amplifies orientation warpage. Thick sections retain heat longer, contracting more as they cool and pulling adjacent thin sections out of alignment. Standard three-stage machine setups cannot separate fill speed from the local pressure needed to balance this volumetric deficit across varying wall thicknesses.
| Material Grade | Glass Fraction (wt%) | Parallel Modulus (MPa) | Transverse Modulus (MPa) | Flow Shrinkage (%) | Cross Shrinkage (%) |
|---|---|---|---|---|---|
| PA6-GF30 | 30 | 8,800 | 3,900 | 0.30 to 0.50 | 0.80 to 1.20 |
| PA66-GF30 | 30 | 9,500 | 4,200 | 0.25 to 0.45 | 0.70 to 1.10 |
| PA66-GF50 | 50 | 15,500 | 6,800 | 0.15 to 0.30 | 0.50 to 0.90 |
| PA6/66-GF35 | 35 | 11,000 | 4,800 | 0.20 to 0.40 | 0.65 to 1.05 |
Wall thickness variations exacerbate orientation-driven warpage. Gating into thick regions lets packing pressure penetrate the bulk before thin walls freeze from the mold surface inward.

Sensor
Piezoelectric quartz transducers installed in mold steel convert mechanical deflection into an electrical charge proportional to melt pressure. Decoupled II processing uses velocity control until the cavity reaches roughly 95% to 98% volumetric capacity, then transfers to hydraulic hold based on screw position. Decoupled III processing isolates the mold from machine dynamics entirely: the cavity pressure signal triggers the switchover from fill velocity to pack pressure, and transducers control the holding stage directly.
Cavity-based control removes variations driven by batch-to-batch viscosity shifts, regrind ratio fluctuations, and barrel temperature drift. When resin viscosity drops, position-based transfer injects excess resin into the tool before switching, flashing the parting line and raising internal stress. A cavity pressure sensor detects the advancing pressure front directly, cutting fill velocity the instant the cavity reaches its target volumetric threshold.
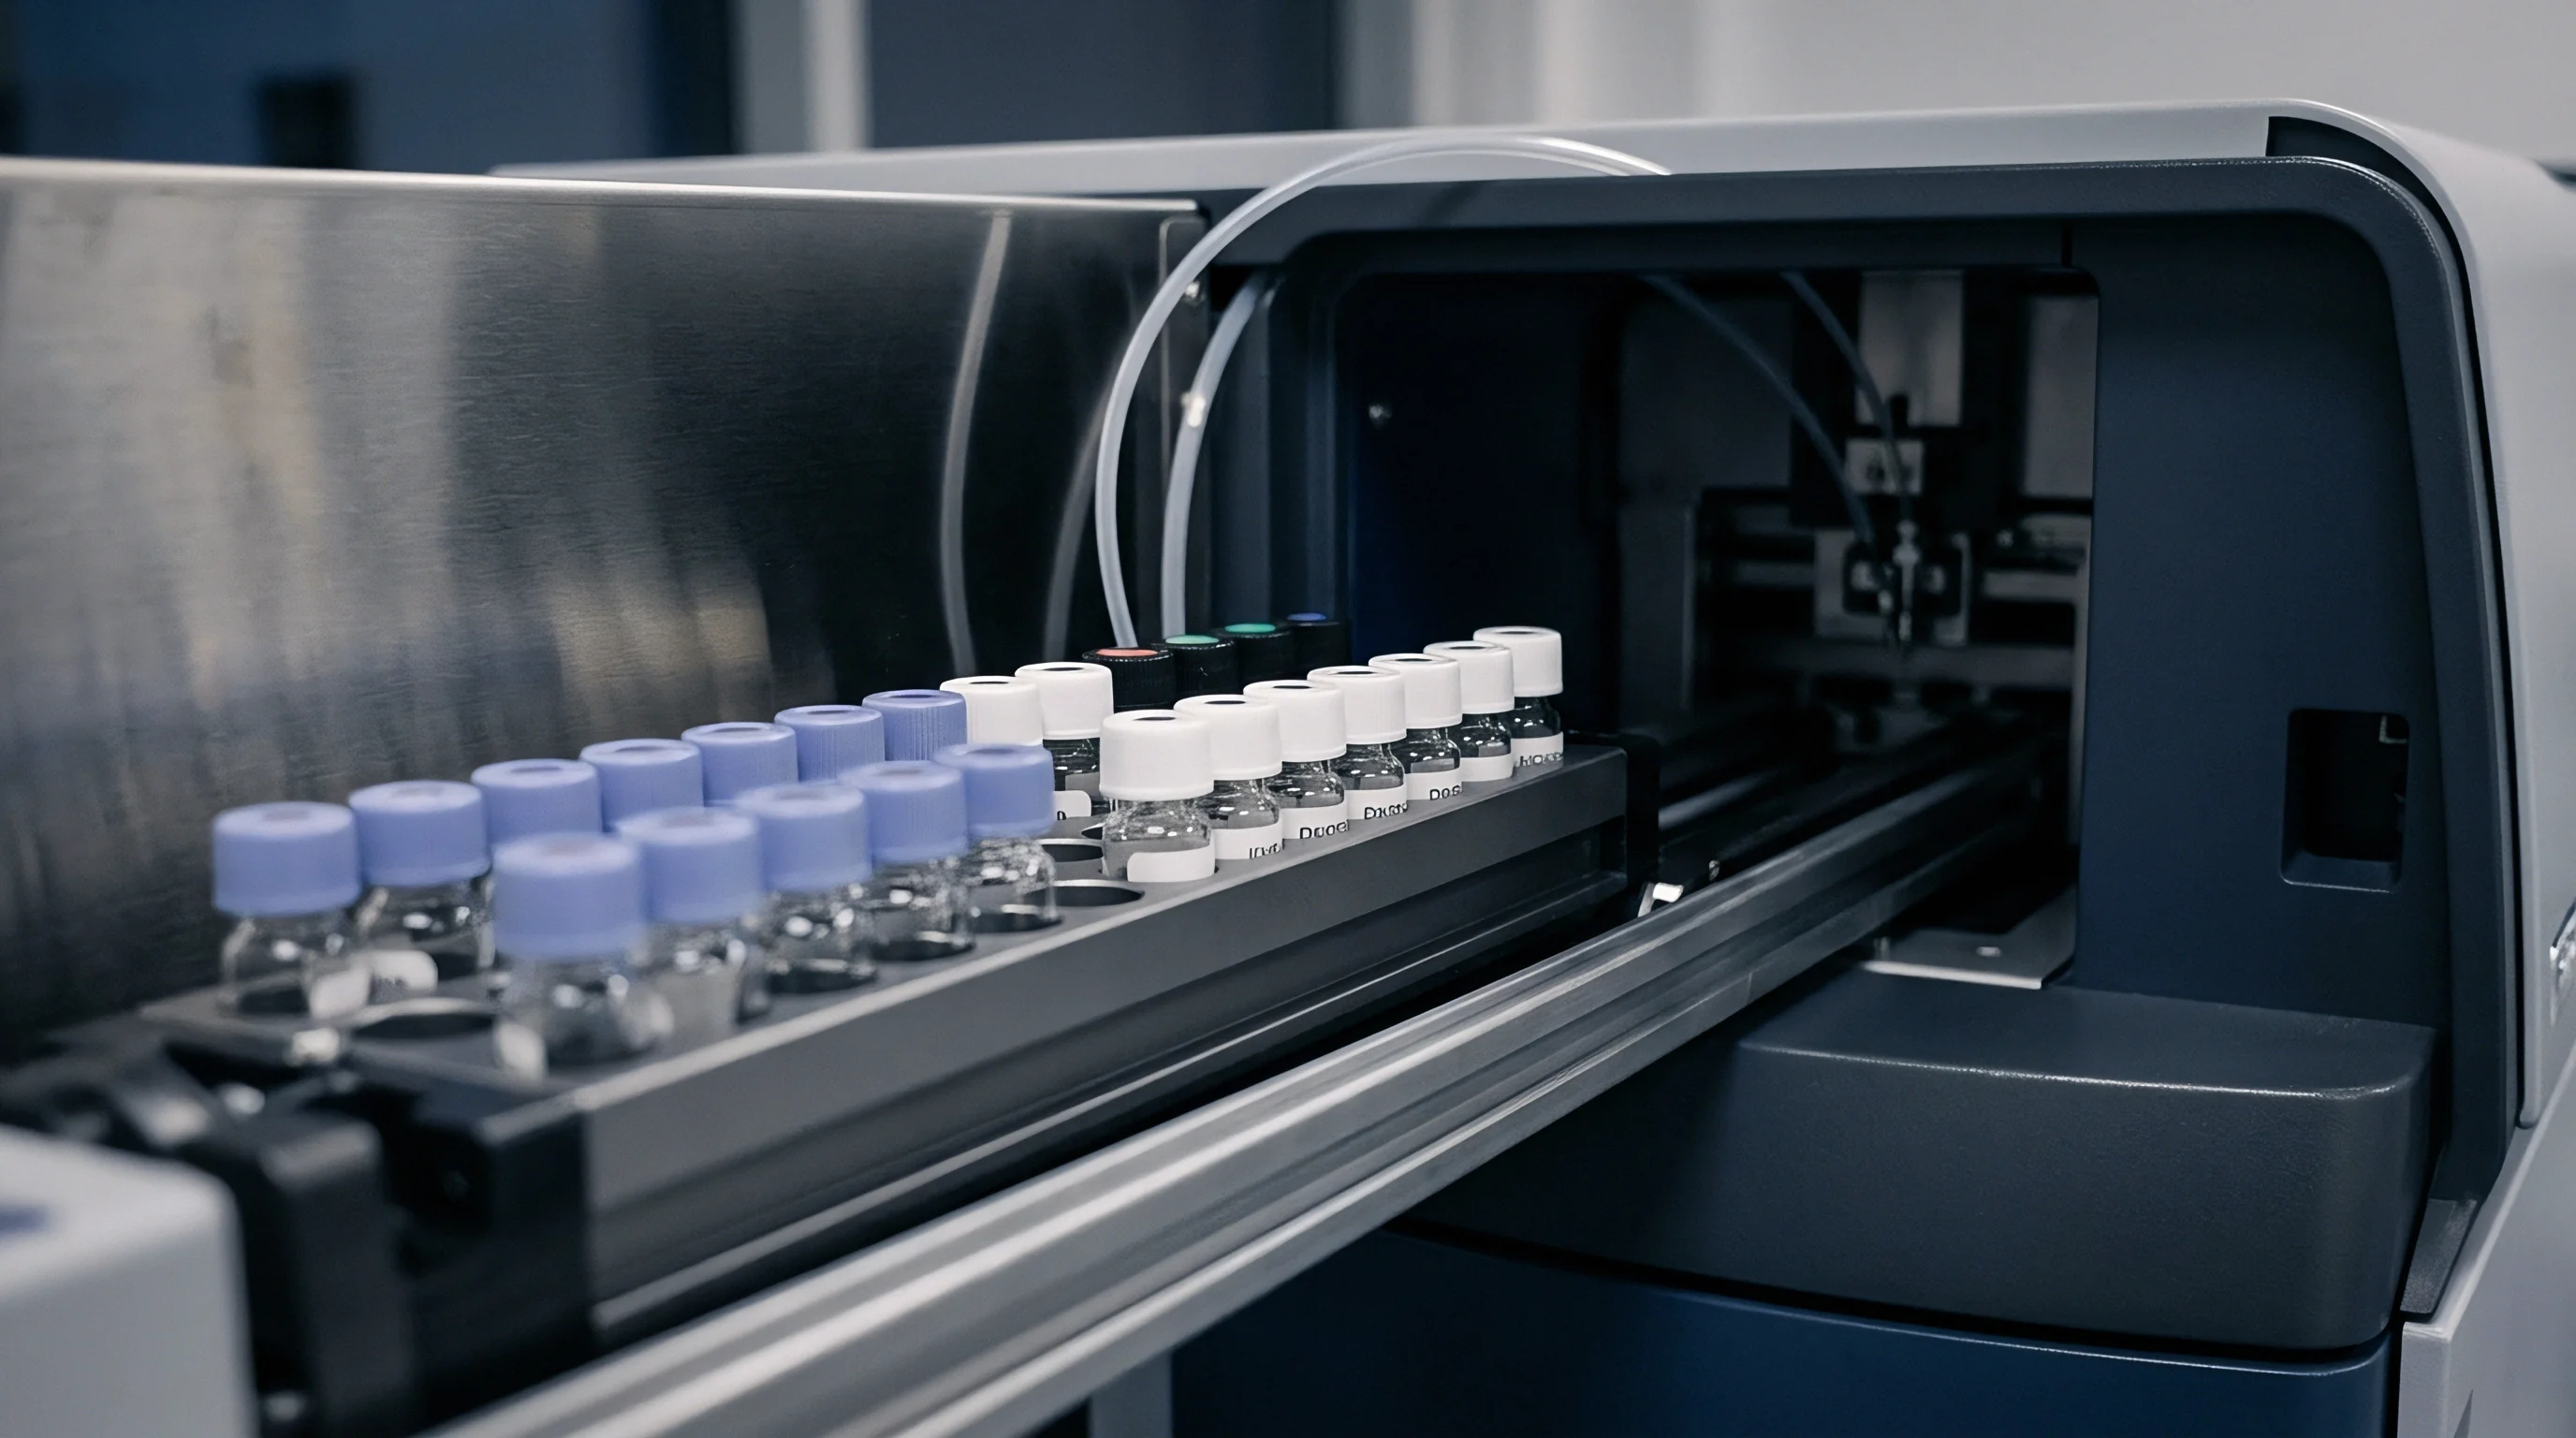
Transducer Placement at Flow Terminations
Placing sensors at the end of fill ensures complete part filling without overpacking the gate area. A sensor opposite or next to the last region to fill monitors melt front arrival. Once pressure there reaches a threshold ~ typically 15 MPa to 35 MPa ~ the system triggers the packing sequence.
This placement prevents gas burns on thin structural ribs while preserving rigidity across long flow paths.
Transducer placement determines signal quality at the digital controller. Direct-contact sensors sit flush with the mold wall, putting the diaphragm directly in contact with polymer melt. Indirect sensors sit behind ejector pins, calculating pressure from mechanical force transferred through the pin relative to its contact surface area.
- Direct-contact piezoelectric sensors respond in under 1 millisecond, capturing minor pressure fluctuations during fill.
- Indirect ejector-pin transducers avoid witness marks on cosmetic surfaces, though pin friction introduces a 3% to 7% hysteresis error into pressure calculations over long runs.
- Button transducers behind core inserts measure localized compressive forces in high-stress tool zones. Pocket installation requires precision electrical discharge machining to keep the sensor perpendicular.
- Multi-cavity sensor arrays balance filling across asymmetric runner layouts, monitoring fill profiles in each cavity to trigger individual hot runner valve pins.

Decoupled Three Switchover Mechanics
Executing switchover through cavity pressure decouples the process from machine hydraulic dynamics. During high-speed filling, a constant volumetric flow rate controls fiber orientation. Switching to pack precisely as the melt hits the end-of-fill transducer avoids the pressure spike that forces extra fiber alignment near the gate.
Machine response delay sets the limit on transfer precision. Modern hydraulic valves respond within 8 to 15 milliseconds, while all-electric servo motors react in under 3 milliseconds. Longer transfer delays create a secondary shear field in cooling resin, compounding fiber anisotropy near the runner.
Raising barrel temperatures to eliminate warpage merely masks tool-level volumetric deficits with thermal expansion.
Process repeatability depends on calibration stability. Thermal cycling degrades quartz crystal polarization over millions of shots. Annual calibration keeps sensor drift below 1.0% of full-scale reading in continuous production.

Hold
Controlling cavity pressure after filling governs volumetric relaxation and crystalline morphology. Dynamic packing applies a high initial pressure to compress the melt, followed by a linear or stepped decay matching the volumetric contraction of the cooling matrix. Following a target cavity pressure curve instead of a constant hydraulic hold feeds fresh melt into the mold to counter shrinkage without generating high post-fill shear.
Hold-phase shear stresses severely distort glass-filled polyamides. Forcing material into an already freezing core makes partially immobilized glass fibers twist against one another, building high local residual stresses. Stepping down pressure dynamically prevents this late-stage alignment, letting the core freeze under isotropic hydrostatic conditions.

Where Does Dynamic Packing Alter Differential Shrinkage?
Dynamic pressure profiling alters density gradients between thin and thick wall sections. Under constant holding pressure, the cooling gate area overpacks while distant flow points starve. Stepping down cavity pressure reduces gate pressure before excess mass builds, balancing mass distribution across the part.
Controlled pressure decay narrows directional shrinkage differences. Packing PA66-GF30 at a steady 60 MPa cavity pressure lowers transverse shrinkage from 1.05% to 0.72%, while parallel shrinkage shifts slightly from 0.32% to 0.28%. Shrinking this gap directly reduces the internal bending moment that causes warpage.
| Control Profile | Peak Cavity Pressure (MPa) | Gate Area Pressure at Freeze (MPa) | Out-of-Plane Warp (mm) | Cpk (Flatness < 0.5 mm) |
|---|---|---|---|---|
| Hydraulic Hold (Machine Controlled) | 85.4 | 72.1 | 1.42 | 0.62 |
| Decoupled II (Position Switchover) | 74.2 | 58.6 | 0.88 | 1.08 |
| Decoupled III (Cavity Switchover, Flat Hold) | 62.0 | 61.5 | 0.54 | 1.31 |
| Decoupled III (Dynamic Decaying Hold) | 63.5 | 38.2 | 0.22 | 1.74 |
Deflection drops when holding pressure decays before gate freeze, provided the pressure remains high enough to prevent backflow into the runner system.
Cavity Pressure Decay and Gate Freeze Determination
Pinpointing gate freeze avoids unnecessary cycle time and stops structural damage. Gate seal studies using cavity pressure traces mark the freeze point when cavity pressure decay decouples from machine holding pressure. Holding hydraulic pressure after gate seal provides no density benefit, merely heating oil and wasting power.
Releasing pressure before gate seal causes melt backflow. If machine pressure drops while the gate core is still molten, pressurized resin flows backward into the cold runner, causing voids and sink marks near the gate. This reverse flow forces glass fibers to realign backward, introducing severe stress concentration and cracking.
- Establish fill velocity profiles using short-shot series until the part reaches 95% volumetric capacity without packing.
- Identify transfer pressure thresholds using end-of-cavity transducers to trigger switchover as the melt front arrives.
- Increment hold time stages in 0.5-second steps, recording part weights and cavity pressure decay curves.
- Plot part weight against hold duration to find where the curve flattens, indicating gate freeze.
- Program dynamic hold decay to reduce cavity pressure 30% to 40% over the final third of the gate seal window.
Poor holding pressure control leads to permanent warpage, failure to hold GD&T dimensions, and field fractures under cyclic thermal loads.


Gate
Feed system design dictates how glass fibers align as they enter the cavity. Edge gates create diverging radial flow fronts that sweep fibers into circumferential rings, whereas wide film gates produce unidirectional linear alignment. Combining decoupled cavity pressure control with proper gate geometry limits anisotropic shrinkage before packing begins.
Valve-gated hot runners allow active control over melt delivery. Sequential gating opens individual pins only as the advancing melt front reaches each nozzle location. This eliminates weld lines and prevents the fiber tumbling caused by colliding flow fronts.
A tool drawing that lacks specified sensor pocket tolerances makes cavity pressure monitoring unexecutable at production sign-off.
Feed System Balancing and Volumetric Control
Imbalanced multi-cavity runners generate uneven pressure profiles across identical parts. The cavity closest to the sprue fills first and overpacks, while the furthest cavity fills late and starves. Mounting pressure sensors in every cavity lets servo-driven valve pins choke or open melt channels dynamically, balancing peak pressure and packing curves across the entire mold frame.
Runner diameter directly governs packing pressure transmission. Undersized runners freeze before the gate seals, blocking pressure transmission and making sensor feedback useless. Cold runners for 30% glass-filled polyamides require full-round or trapezoidal profiles sized to maintain pressure transmission throughout the hold cycle.

Sequential Valve Gating Pressure Optimization
Opening valve pins too early drops manifold pressure instantly, disrupting the melt front. Pressure sensors placed just upstream of secondary gates detect primary melt front arrival, signaling the actuator to open at equalized pressure. This avoids hesitation marks and stops perpendicular fiber misalignment at the junction.
Closing valve pins based on local cavity pressure prevents overpacking near the gate vestige. Once the pressure integral reaches target in a given zone, its valve pin advances into the gate land to seal the cavity mechanically. The machine then directs full hydraulic effort to open gates in thicker sections.
- Direct hot runner tips eliminate regrind and minimize thermal degradation in heat-sensitive polyamides.
- Submarine tunnel gates degate automatically during mold opening. High shear through small tunnel orifices can break glass fibers, reducing average length below 0.2 mm and lowering tensile strength.
- Fan gates with flared transitions distribute melt evenly across wide, flat parts, aligning fibers along one axis to simplify warpage prediction.
- Diaphragm gates for cylindrical parts produce radial fiber alignment, preventing ovality in high-precision bearing sleeves.
It remains uncertain whether closed-loop valve pin positioning can dynamically compensate for lot-to-lot fiber aspect ratio degradation without manual sensor threshold recalibration.


Debit
Adding cavity pressure transducers increases initial tooling costs but reduces scrap and downtime. A four-cavity tool equipped with four direct piezoelectric sensors, charge amplifiers, and interface hardware adds $18,000 to $28,000 in capital outlay. For high-volume PA66-GF30 electrical connectors or structural housings, that expense offsets scrap rates that frequently exceed 8% on unmonitored tools with tight tolerances.
Tool amortization often covers sensor costs within the first year of production. Running a 300-ton press at $85 per hour builds up financial waste quickly when parts warp out of specification on unattended shifts. Automated pressure sorting gates reject bad shots instantly, keeping warped components off assembly lines.
Sensor Amortisation against Scrap Reductions
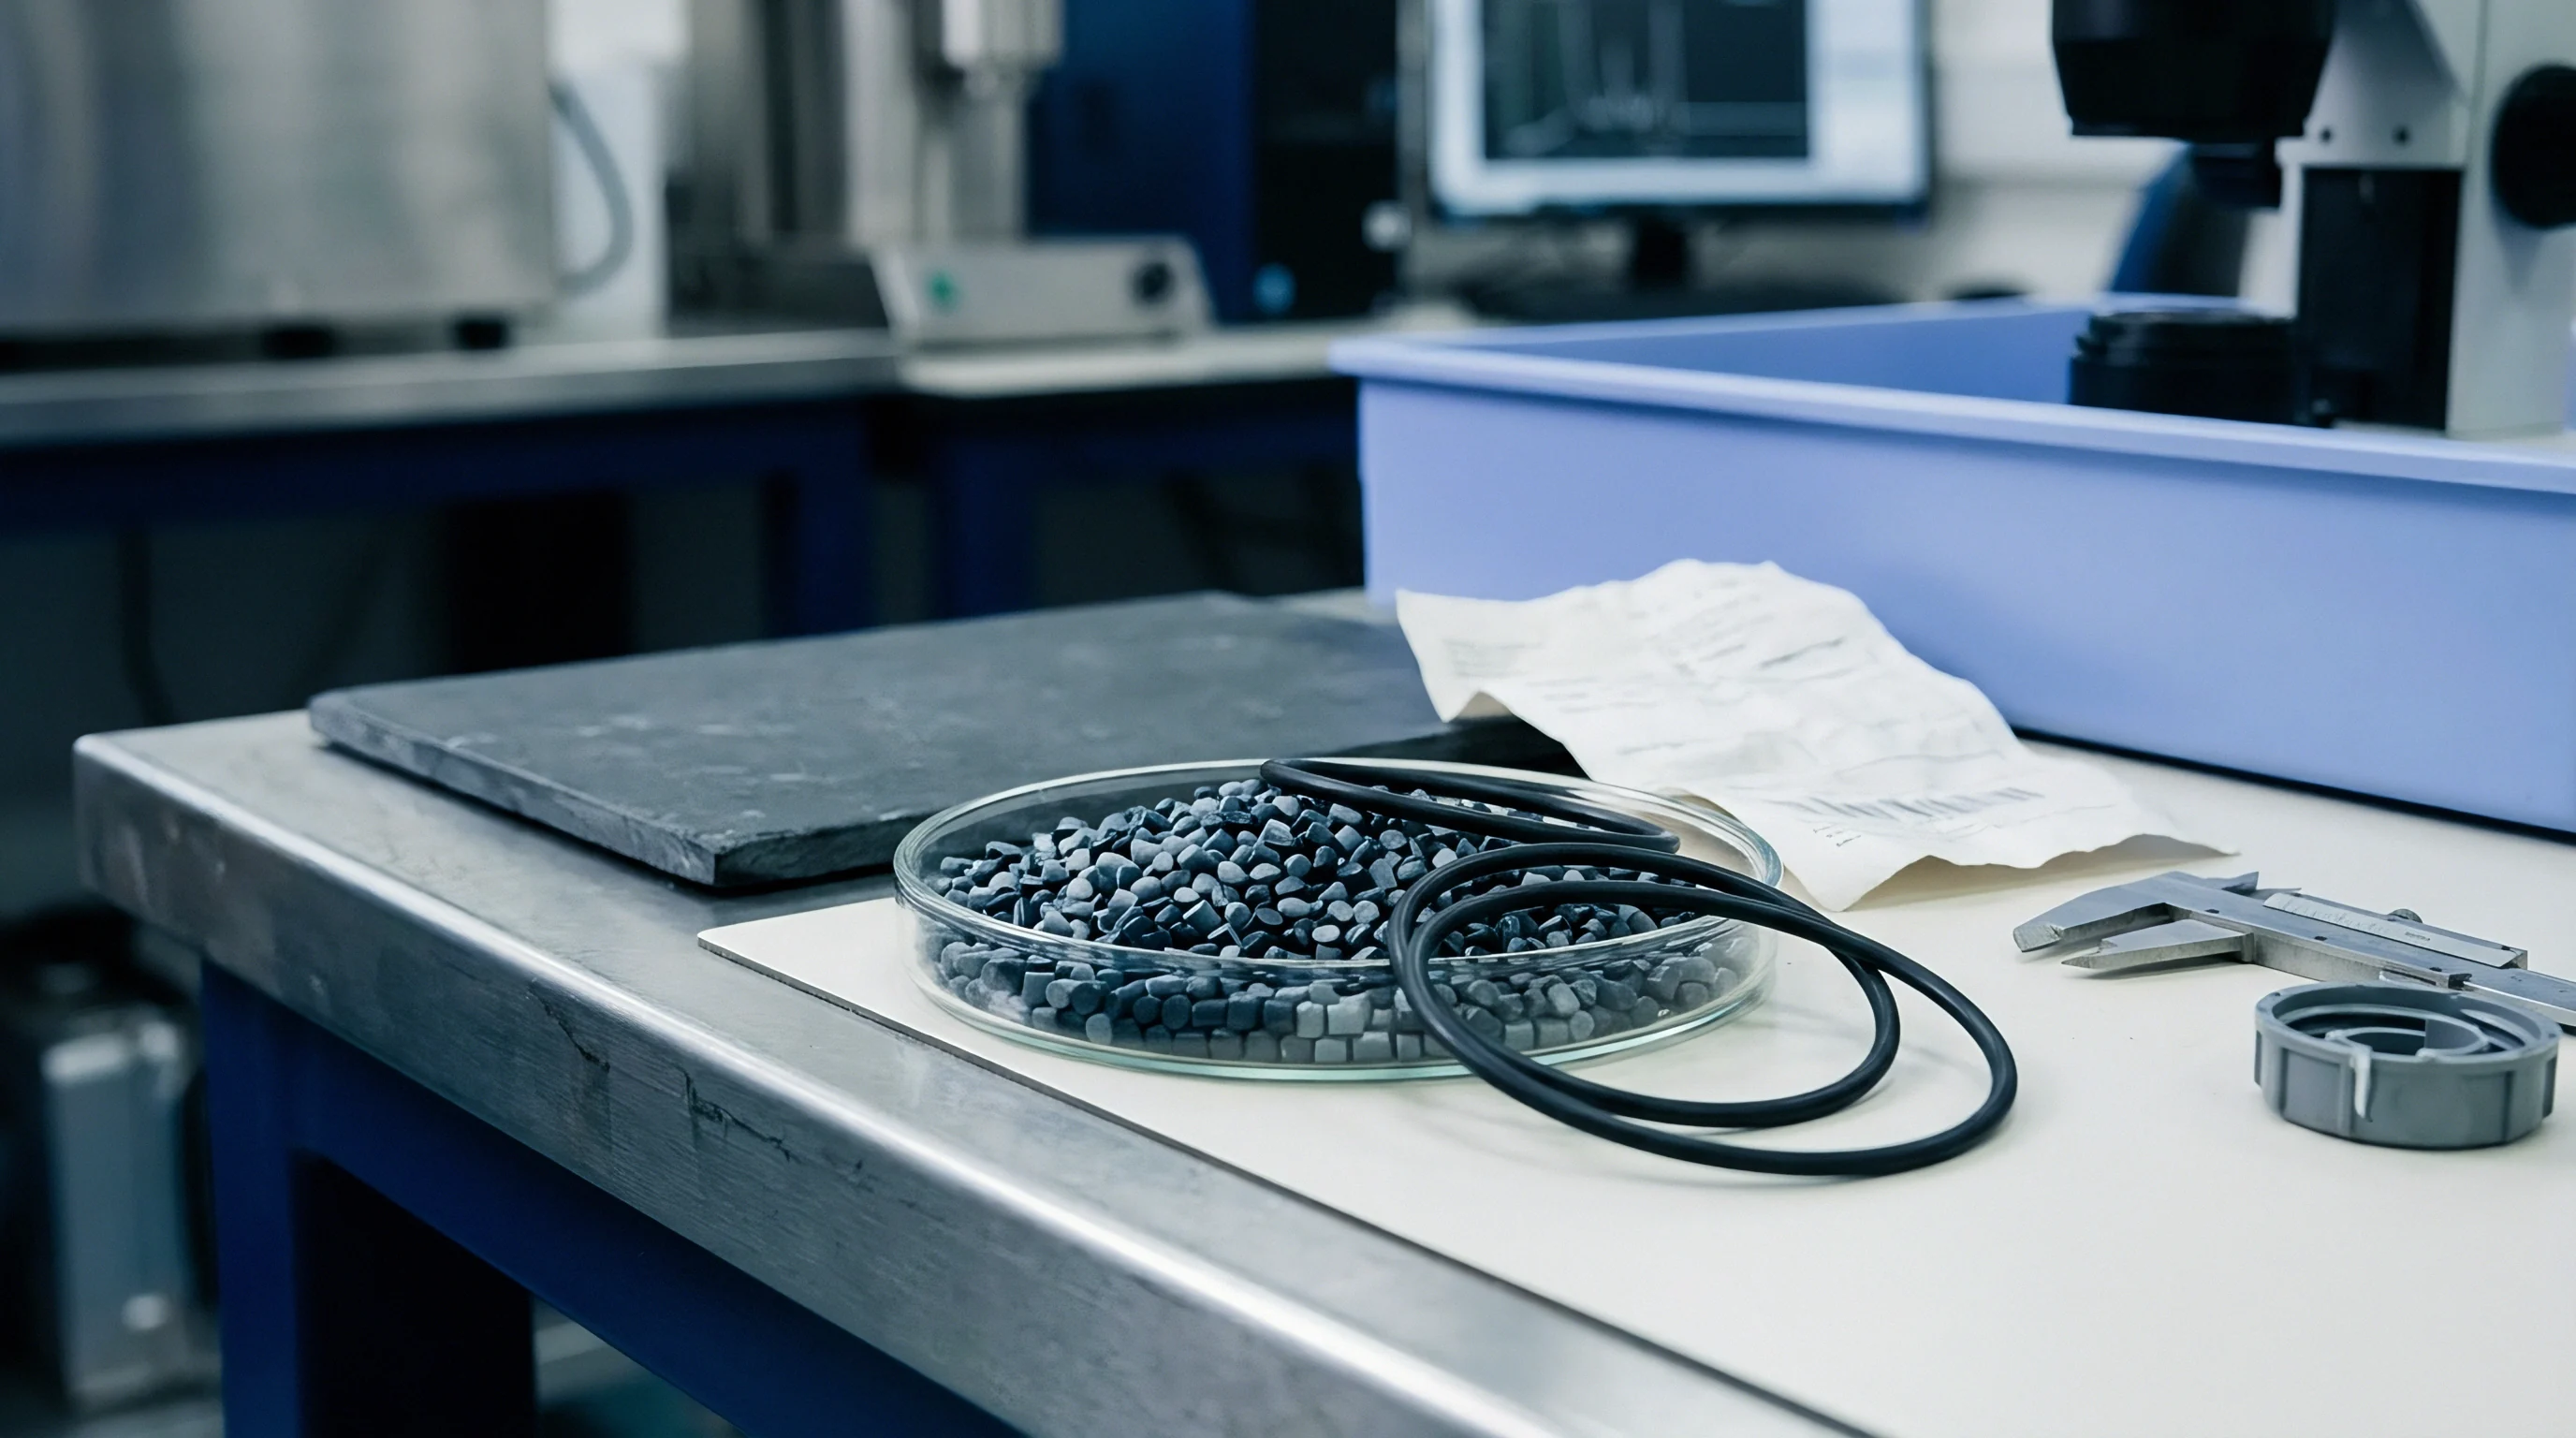
Consider an annual volume of 500,000 PA66-GF30 components molded at $4.20 per kilogram with a shot weight of 180 grams. A standard setup averaging 6.5% scrap discards 32,500 parts a year ~ costing $24,570 in lost resin and regrind degradation, plus 54 machine hours worth $4,590. Decoupled III cavity pressure control drops scrap below 0.5%, saving over $26,000 annually per four-cavity mold.
Sorting parts by cavity pressure curve integration ensures only dimensionally compliant components enter packaging. If the pressure integral drifts beyond statistical limits (typically +/- 3 standard deviations), an end-of-arm robot diverts that shot to a quarantine bin without stopping the press.
| Process Architecture | Tooling Cost Premium ($) | Process Scrap Rate (%) | Annual Machine Waste Hours | Cpk on Planar Flatness |
|---|---|---|---|---|
| Standard Hydraulic Holding | 0 | 7.8 | 65.0 | 0.71 |
| Decoupled II (Screw Position) | 3,500 | 3.2 | 26.7 | 1.14 |
| Decoupled III (Cavity Transducers) | 22,000 | 0.4 | 3.3 | 1.68 |
| Decoupled III with Dynamic Hot Runner | 38,500 | 0.2 | 1.7 | 1.92 |
Capability indices increase under transducer governance, bringing lot-to-lot dimensional stability into line with strict automotive quality standards.
Process Capability Verification for Flatness Sign-Off
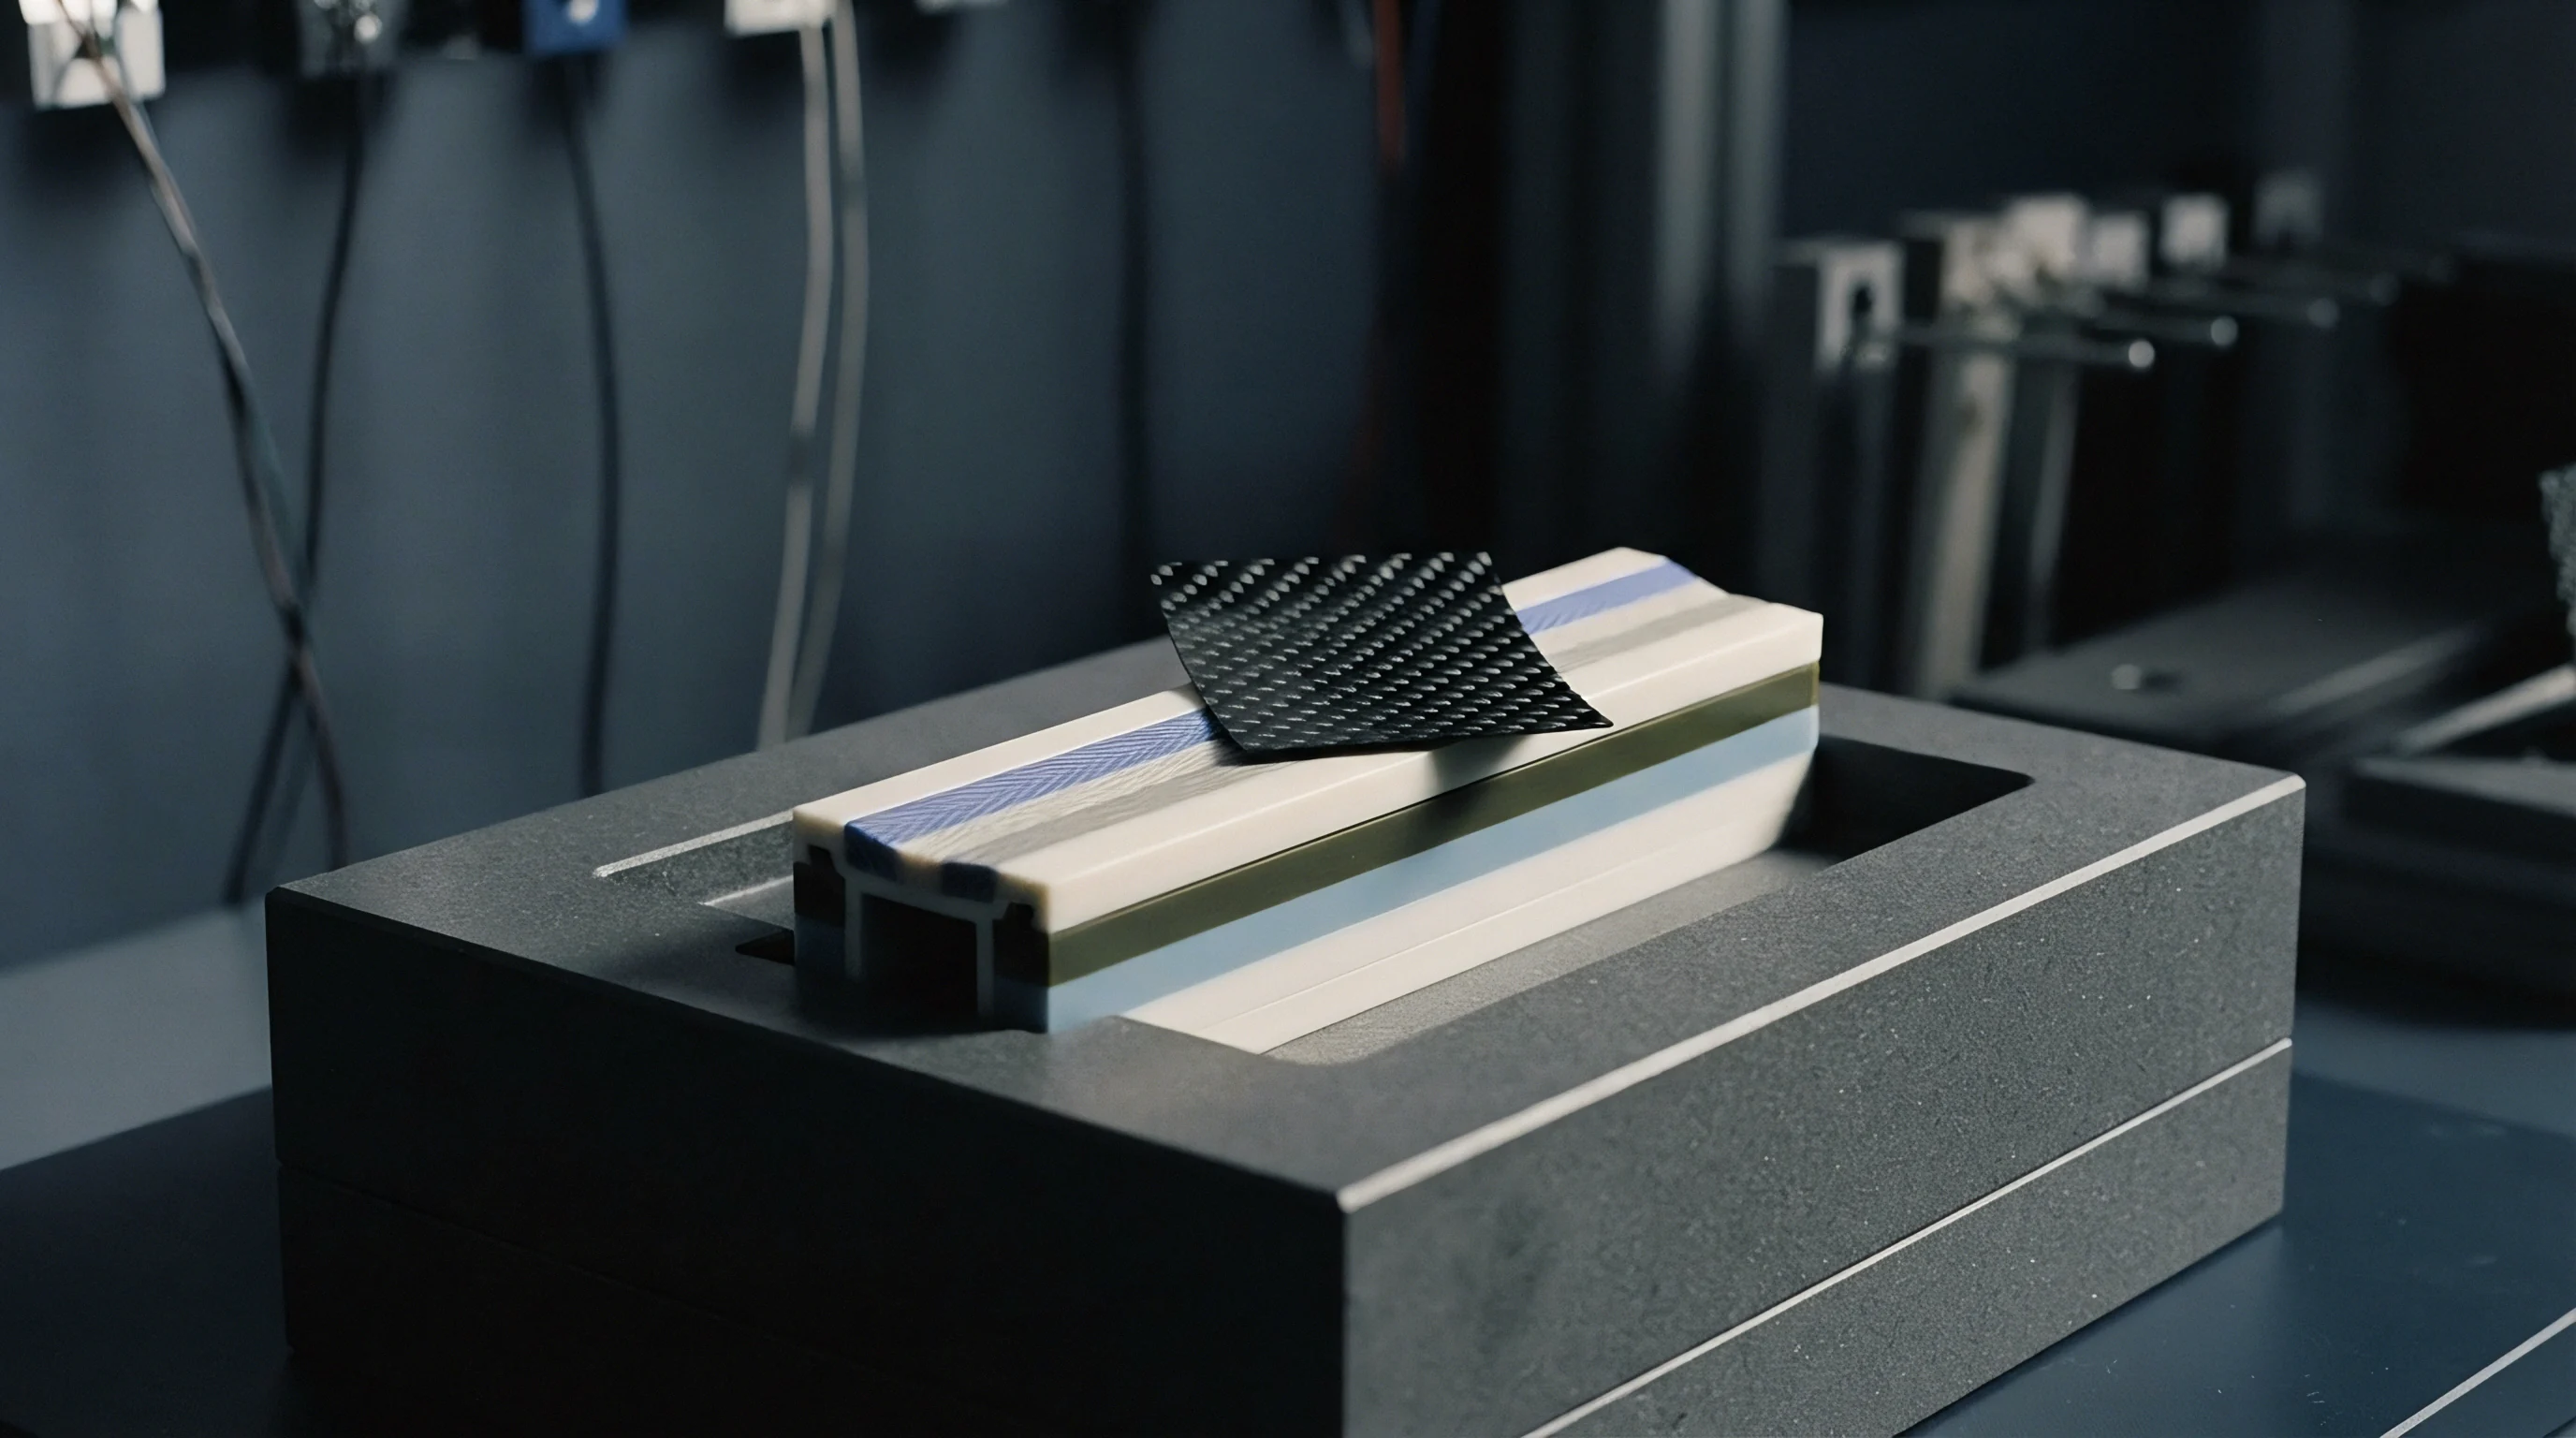
Sourcing contracts require process capability studies before tooling acceptance. For critical dimensions under DIN 16742 tolerance group TG4, suppliers must show a Cpk above 1.33 over a continuous 300-part run. Without cavity pressure feedback, thermal drift across shifts causes dimensional shifts that drop Cpk below 1.0, incurring penalties and tooling revision costs.
Verifying mold capability requires recording cavity pressure metrics alongside CMM inspection data. Correlating peak pressure and pressure integrals with measured flatness creates a digital record for each production lot. Tool transfer agreements can then use cavity pressure profiles as binding acceptance criteria, making sure contract molders match verified process conditions on other presses.
Under ISO 9001 procurement frameworks, final capital release for tooling requires documented capability showing a Cpk greater than 1.67 using cavity pressure switchover data.