Polymer Interfacial Heat Transfer Coefficient Calibration under Packing Pressure
Calibrating pressure-dependent interfacial heat transfer coefficients eliminates cooling simulation drift and stabilizes cycle times within tight tolerance limits.
Contact
Melt injection forces molten resin against chilled tool steel under high mechanical pressure. Steel extracts thermal energy rapidly. As molten polymer hits the metal wall, thermal resistance across the microscopic boundary governs the temperature evolution of both polymer and mould.
Injection moulders and tooling engineers designate this thermal boundary property as the interfacial heat transfer coefficient, denoted as h_int. In academic literature and commercial numerical simulation codes, engineers frequently set this coefficient to a static default value between 1000 and 2000 W/(m²·K). Commercial injection moulding operates far from steady state.
Packing pressure shifts between 200 bar and 1400 bar inside the tool cavity, altering the microscopic contact area between the rough tool steel and the viscoelastic polymer melt.

Thermal Resistance across the Solidifying Boundary
Molten plastic enters the tool cavity at temperatures exceeding two hundred degrees Celsius. Cavity pressure alters this conductance. At low pressure during early cavity fill, molten resin touches only the highest asperities of the machined steel surface.
Microscopic air pockets remain trapped within the surface roughness valleys. Air exhibits a thermal conductivity of approximately 0.026 W/(m·K), acting as a thermal insulator. When packing pressure ramps up after volumetric filling, mechanical force pushes the compliant polymer melt into these microscopic roughness valleys.
The contact area expands toward complete contact. The polymer skin stiffens. This physical expansion elevates the interfacial heat transfer coefficient from roughly 300 W/(m²·K) to values surpassing 3500 W/(m²·K) under intense hydraulic holding forces.
Under holding pressures of 800 bar, the interfacial heat transfer coefficient for polypropylene reaches 3200 W/(m²·K) against hardened tool steel.
Thermal resistance at this boundary determines skin layer freeze rates. A high heat transfer coefficient extracts heat swiftly, creating a dense, highly oriented frozen skin. When holding pressure drops or when gate freeze cuts off pressure transmission, thermal contraction causes the polymer to shrink away from the cavity wall.
An air gap opens. This microscopic detachment drops the heat transfer coefficient back down toward 150 to 400 W/(m²·K). Numerical cooling simulations that rely on an uncalibrated, constant heat transfer coefficient fail to predict this steep transition.
The predicted part temperature profile drifts away from reality, corrupting calculations of volumetric shrinkage, residual stress accumulation, and warpage.
| Resin Type | Cavity Pressure (bar) | Tool Surface Finish | Measured h_int (W/(m²·K)) | Physical Interface State |
|---|---|---|---|---|
| Polypropylene (PP) | 100 | SPI A2 Polish (Ra 0.05 µm) | 650 | Partial asperity contact |
| Polypropylene (PP) | 600 | SPI A2 Polish (Ra 0.05 µm) | 2400 | Conformal contact under packing |
| Polypropylene (PP) | 1200 | SPI A2 Polish (Ra 0.05 µm) | 3800 | Maximum asperity compression |
| Polycarbonate (PC) | 150 | EDM Texture (Ra 1.6 µm) | 420 | Entrapped micro-voids at asperities |
| Polycarbonate (PC) | 800 | EDM Texture (Ra 1.6 µm) | 1950 | Partial void collapse |
| Polyoxymethylene (POM) | 50 (Detached) | Ground (Ra 0.4 µm) | 210 | Clearance gap from crystallization |
Omitting dynamic contact resistance produces cooling predictions that underestimate cycle duration by twenty percent, distorting clamp allocation and yielding out-of-spec warped components.
Rig
Precise measurement demands thermal instrumentation positioned within hundredths of a millimeter from the cavity wall. Surface thermocouples capture this transition. Standard mineral-insulated thermocouples buried three millimeters below the water line register damped, delayed temperature waves useless for millisecond-scale interfacial dynamics.
A specialized instrumented test mould integrates coaxial, fast-response eroding thermocouples alongside piezoelectric pressure sensors to track interfacial events simultaneously.
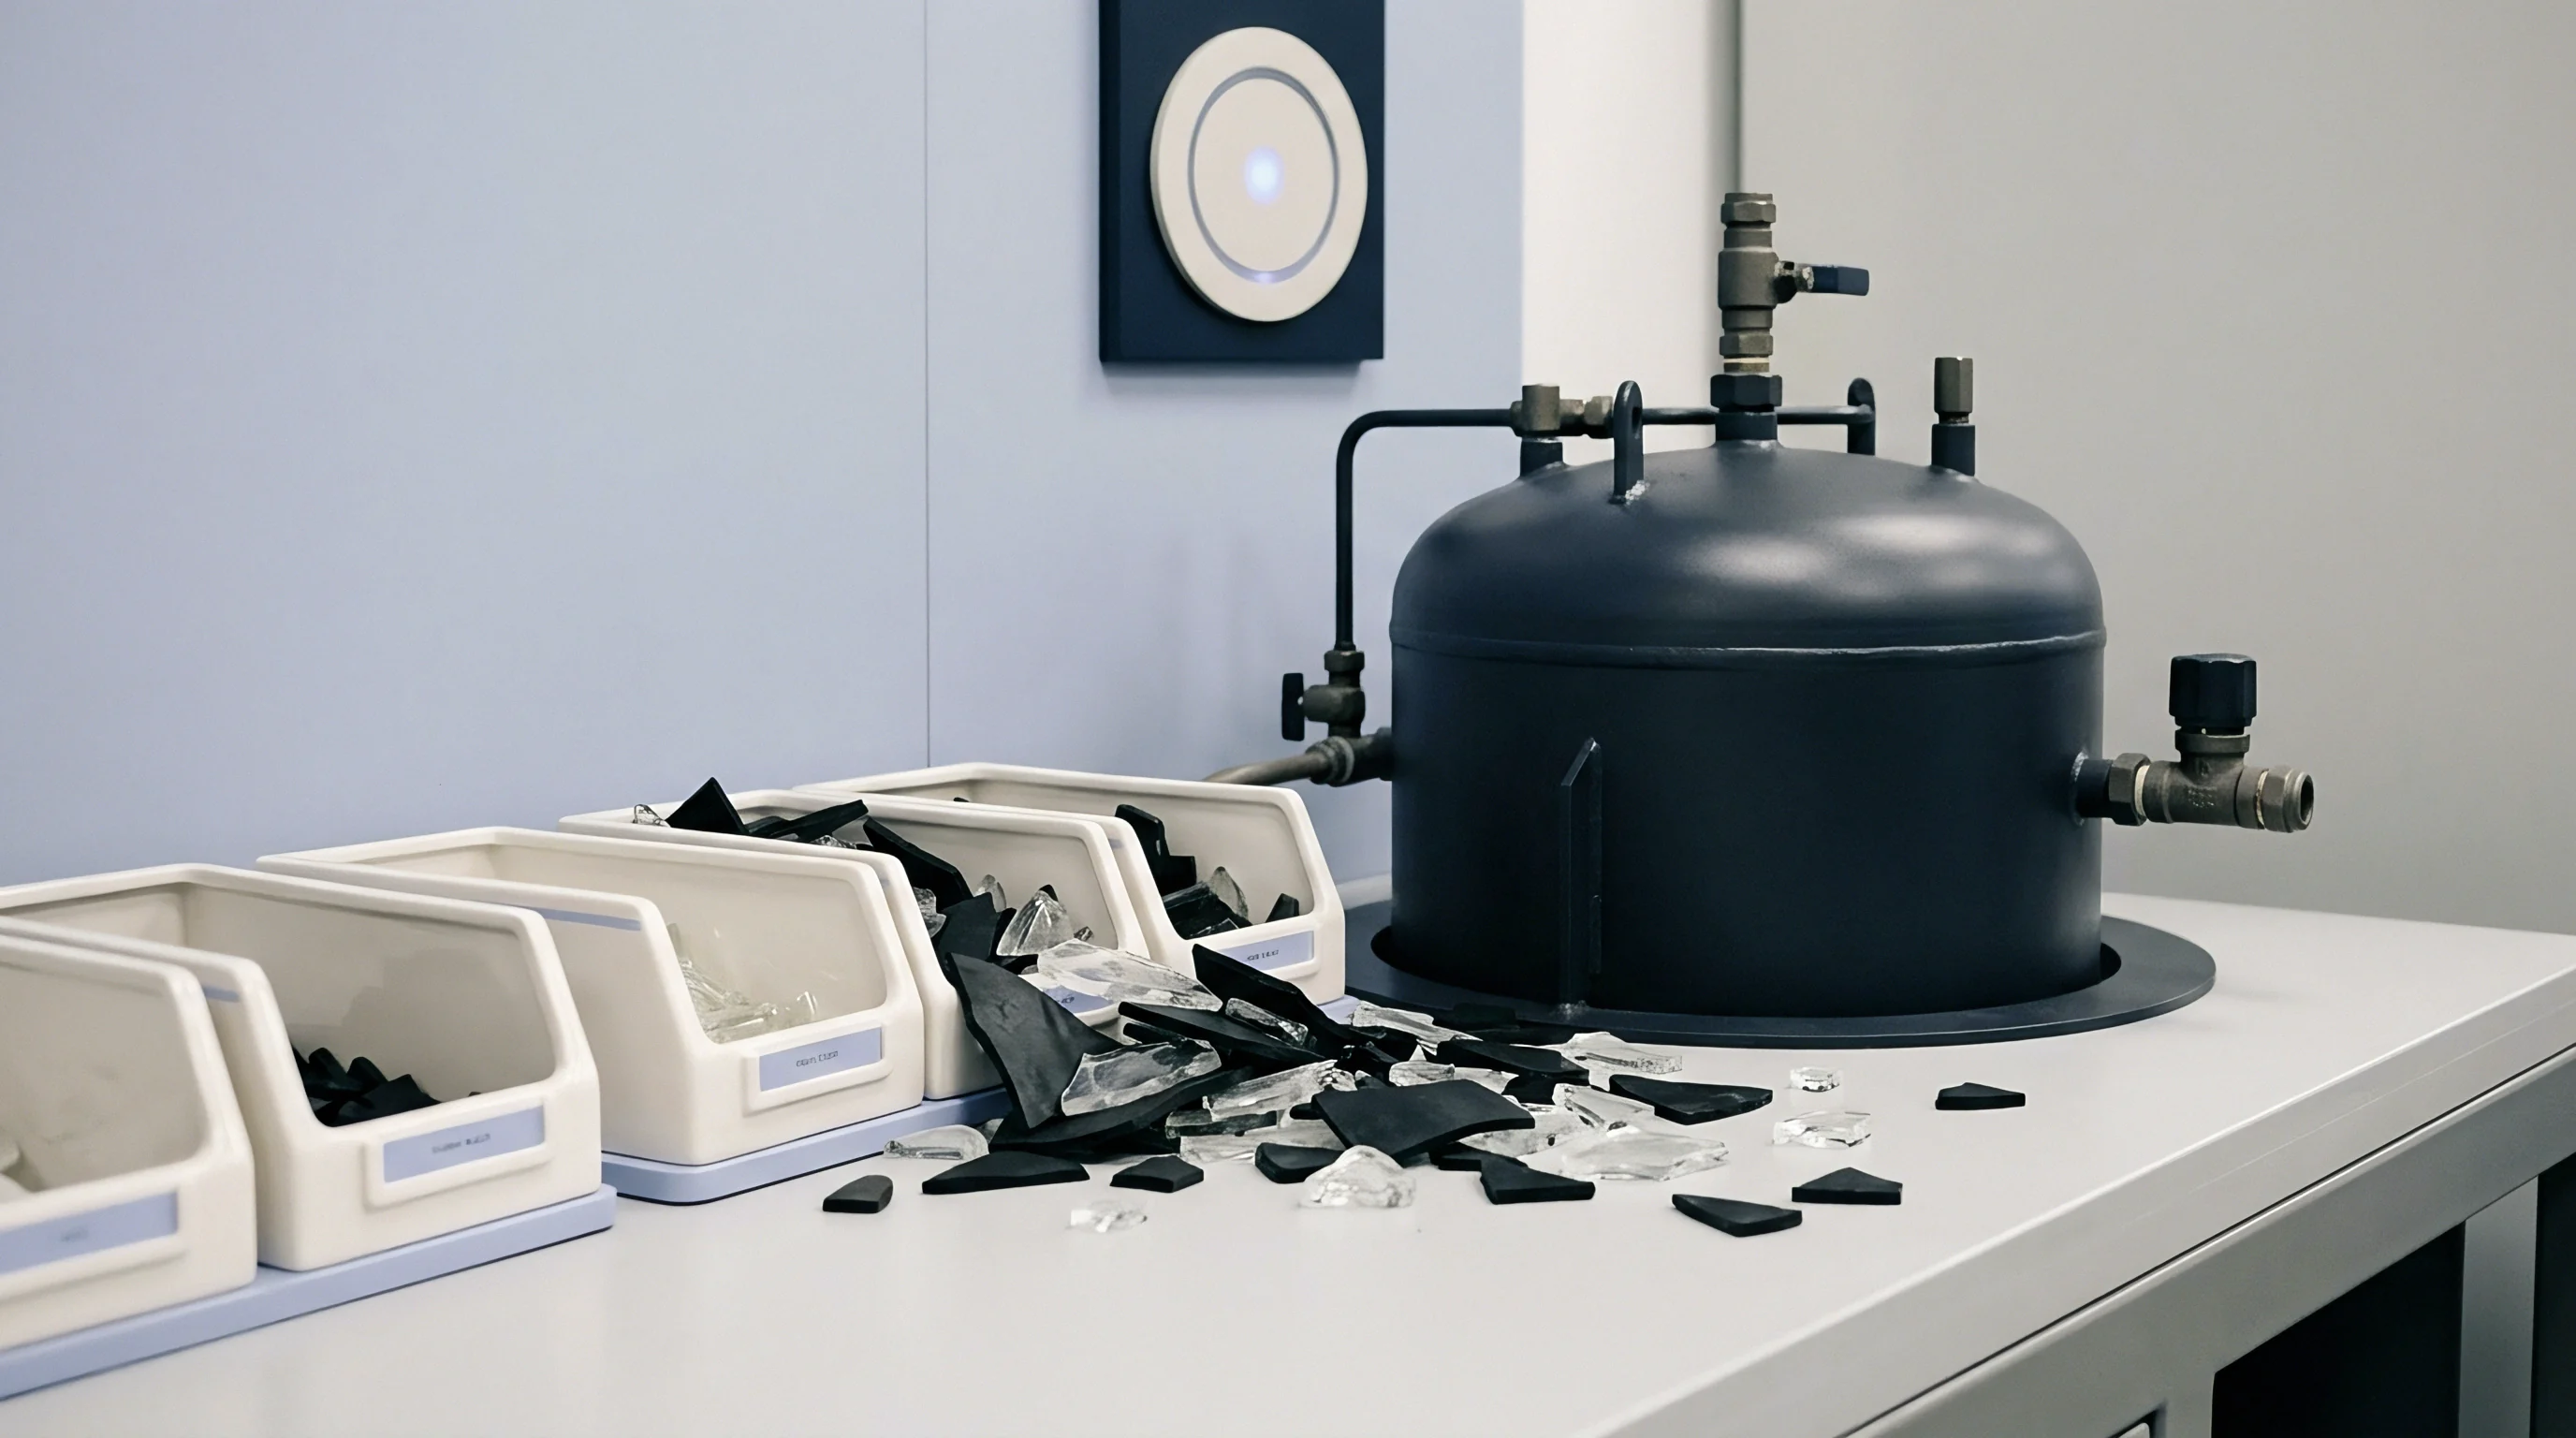
Instrumented Tooling Architecture
Cavity inserts fitted with coaxial miniature thermocouples record rapid thermal transients. The measuring junction sits directly flush with the cavity surface, exposed to direct melt impingement. These eroding junctions deliver response times below ten microseconds.
Directly adjacent to the thermal probe, a quartz piezoelectric sensor captures cavity pressure up to 2000 bar with minimal temperature drift. Positioning both sensors within four millimeters of each other provides localized, synchronized thermal and mechanical data streams.
- Coaxial Thermocouple Probes record instantaneous surface temperature profiles without distorting local steel thermal conductivity.
- Piezoelectric Transducers track localized holding pressure drops with microsecond rise times.
- High-Speed Acquisition Hardware digitizes analog voltages at sampling frequencies between ten and fifty kilohertz.
- Secondary Subsurface Sensors measure baseline steel temperature gradients along the heat flux vector toward cooling channels.
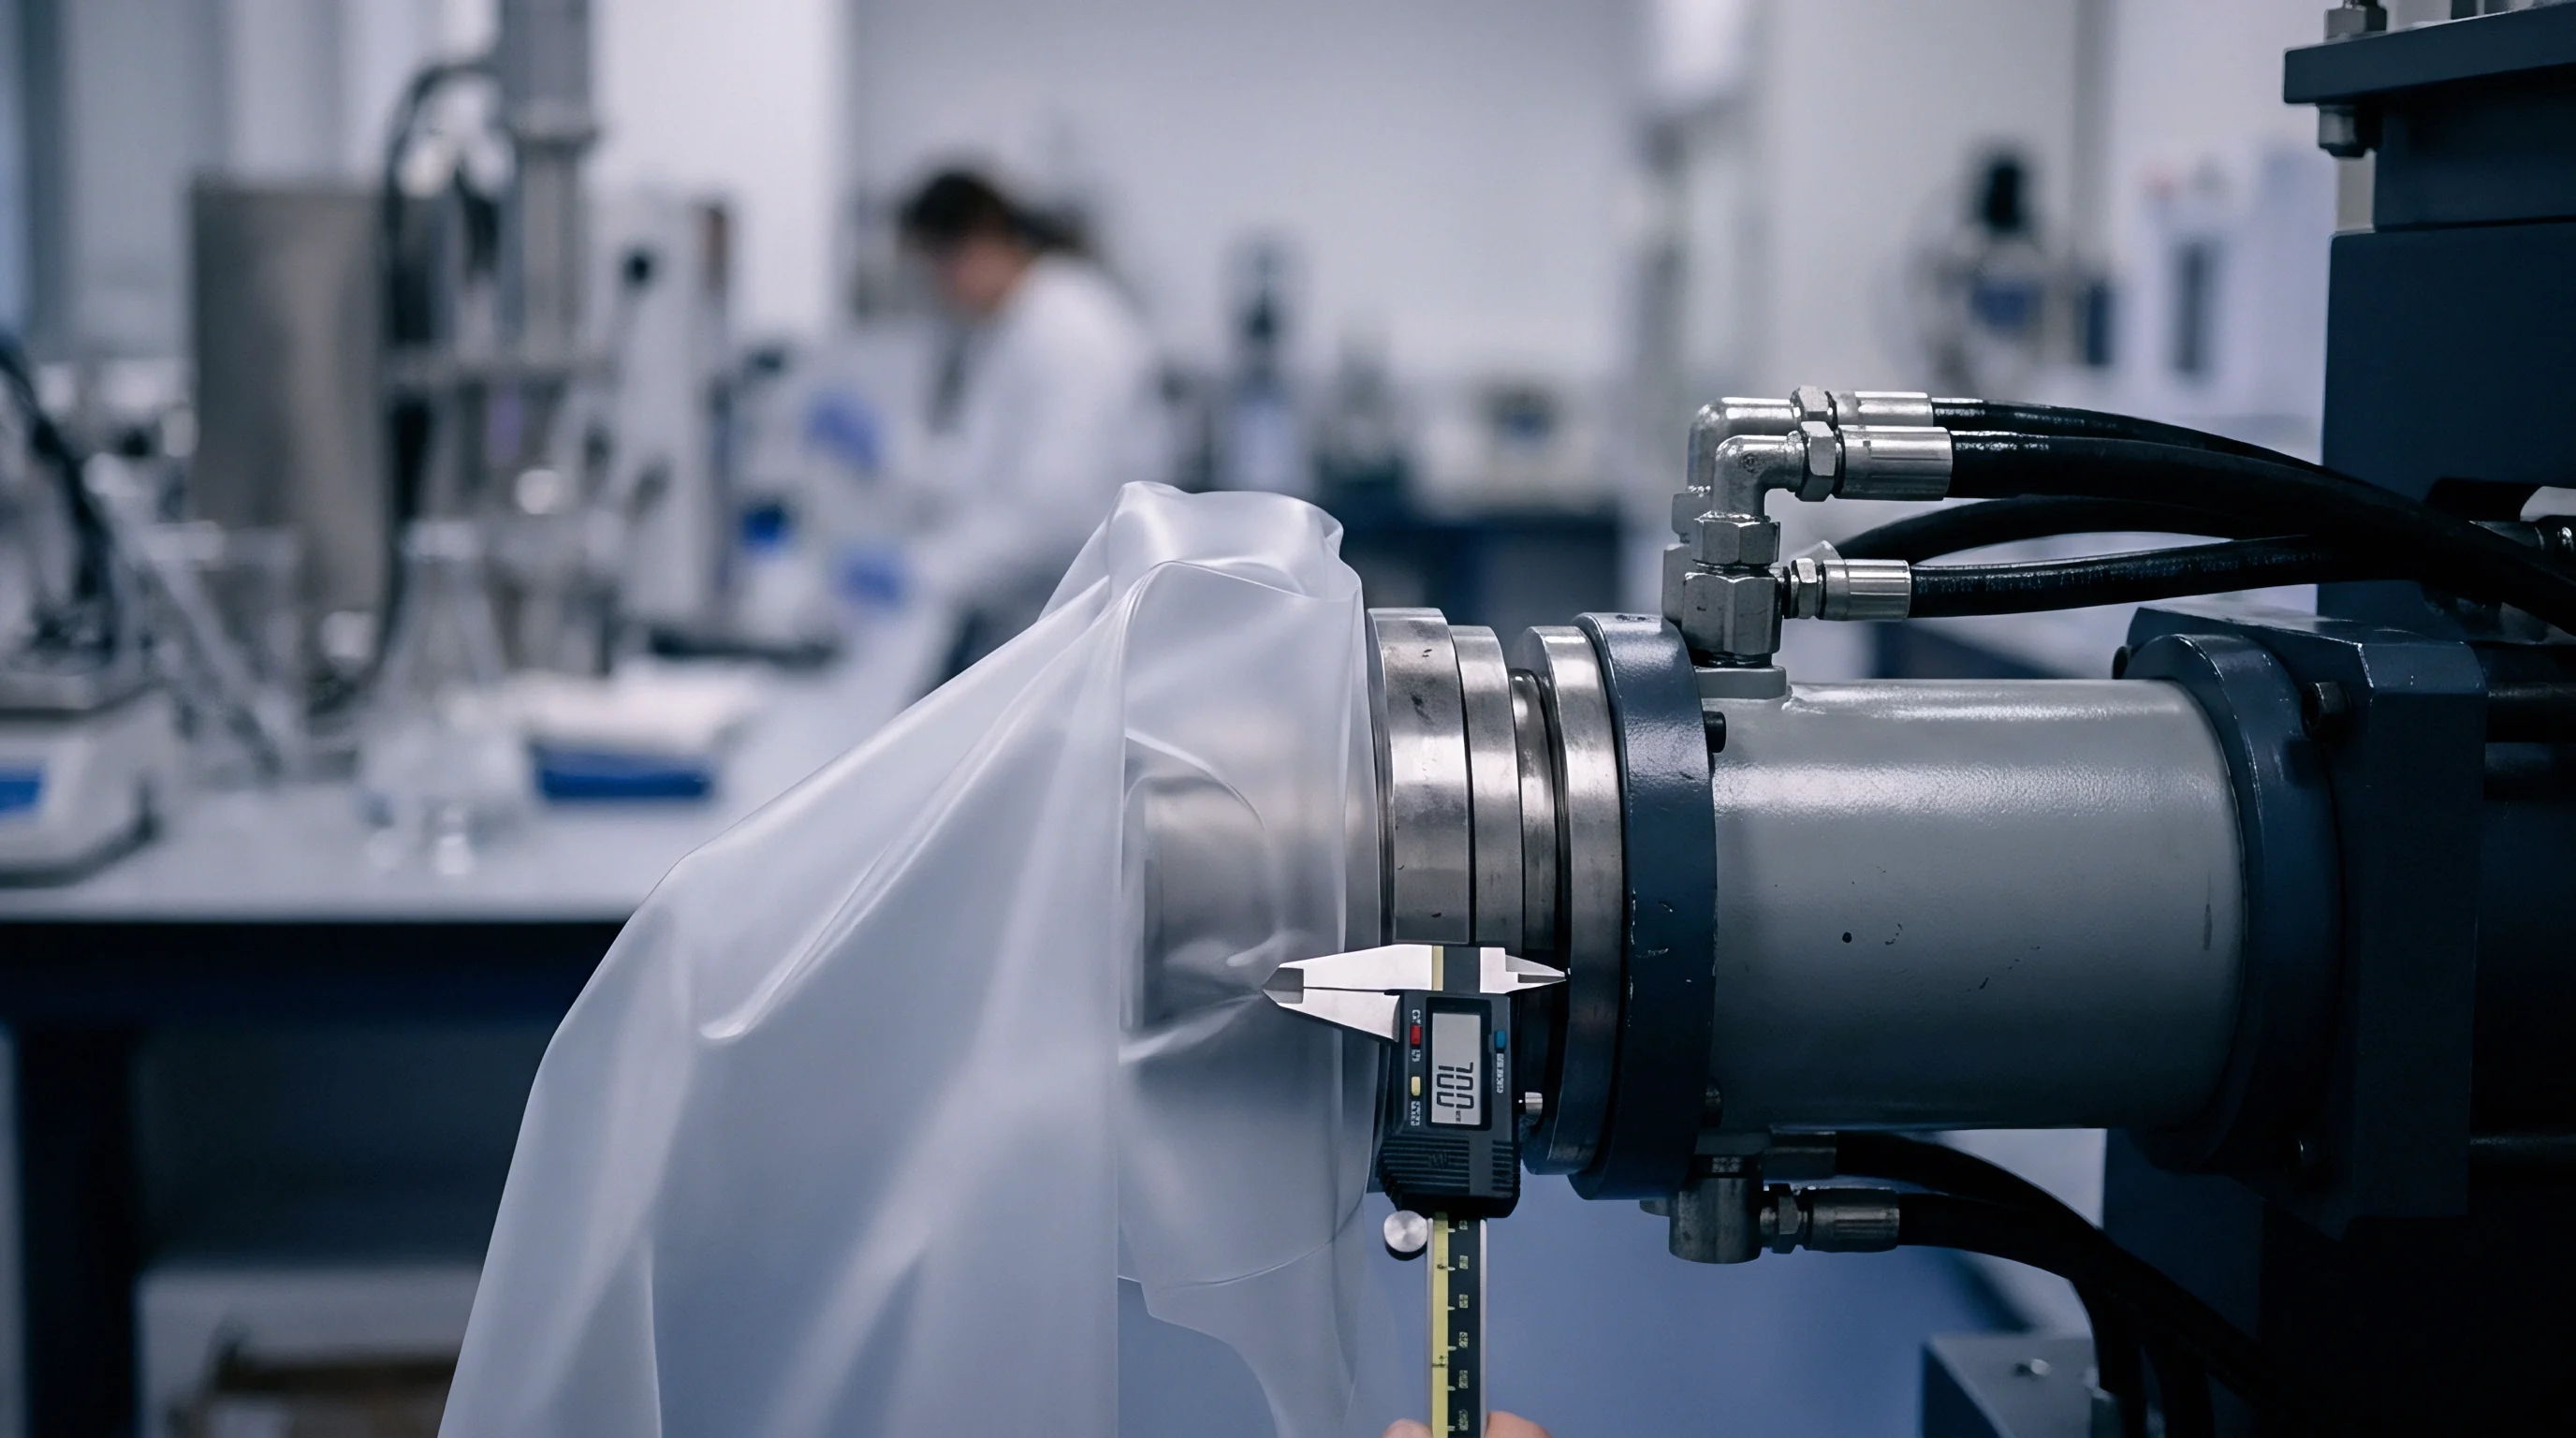
Which Inversion Routine Resolves Dynamic Contact Resistance?
Inverse boundary value procedures translate interior sensor measurements into surface flux values. One cannot place a thermocouple junction directly within the polymer-metal mathematical dividing line without altering the boundary itself. Measurements occur in the tooling steel.
An acquisition system gathers the raw millivolt curves during the cycle: rapid thermal spikes upon initial melt contact, steady heat rejection during the packing plateau, and thermal deceleration as cooling continues. Gate freeze alters thermal dynamics.
The moulder asserts that standard cavity thermistors provide adequate thermal verification without specialized flush sensors.

Inversion
Determining dynamic thermal conductance across the steel boundary relies on transient temperature history recorded during cooling. Transient heat conduction within the mould steel follows linear diffusion mechanics. Inside the solidifying polymer, heat transfer involves nonlinear thermal conductivity, temperature-dependent specific heat capacity, and latent heat release from crystallization.
Calculating interfacial heat transfer coefficients demands solving the Inverse Heat Conduction Problem, commonly designated as IHCP.
Sequential Function Estimation Method
Thermal conduction models inside hardened steel obey transient diffusion mechanics. In a one-dimensional domain perpendicular to the cavity surface, the heat equation relates the time rate of steel temperature change to spatial temperature curvature through steel thermal diffusivity. Beck sequential function specification methods resolve this inverse boundary problem.
Direct numerical inversion of transient temperature signals amplifies raw measurement noise, creating extreme oscillations in calculated surface heat flux. Beck algorithm stabilizes calculations by utilizing several future time steps to estimate the current surface heat flux.
The calculation sequence evaluates future temperature intervals, minimizing a least-squares error function between measured thermocouple outputs and temperatures computed from a forward conduction model. Once the algorithm calculates the surface heat flux and instantaneous tool surface temperature, it establishes the interfacial heat transfer coefficient by dividing the calculated heat flux by the temperature difference between the bulk polymer melt and the cavity steel surface. Holding pressure maintains mechanical contact.
Pressure decay alters this equation instantaneously.
A three-point future time step specification in Beck inversion suppresses raw thermocouple voltage noise while retaining microsecond thermal shock resolution.

Will Thermal Shrinkage Break Interfacial Contact Prematurely?
Density changes across polymer phase transitions dictate volumetric reduction rates. Polyolefins and semi-crystalline engineering resins like polyamide, polybutylene terephthalate, and polyoxymethylene exhibit volumetric shrinkage between twelve and eighteen percent. Microscopic air voids resist conduction.
As long as cavity pressure remains elevated above 300 bar, hydraulic packing force compensates for specific volume reduction by forcing additional polymer chains through the gate. Interfacial conductance stays elevated.
| Material Family | Specific Volume Change (%) | Peak Packing Pressure (bar) | Conductance At Peak (W/(m²·K)) | Conductance At Detachment (W/(m²·K)) |
|---|---|---|---|---|
| High-Density Polyethylene (HDPE) | 15.2 | 750 | 2900 | 180 |
| Polypropylene Homopolymer (PP) | 13.8 | 800 | 3100 | 210 |
| Polyamide 66 (PA66 30% GF) | 5.4 | 900 | 3600 | 450 |
| Acrylonitrile Butadiene Styrene (ABS) | 6.1 | 650 | 1850 | 290 |
| Polycarbonate (PC Unfilled) | 5.8 | 700 | 2100 | 320 |
| Polyether Ether Ketone (PEEK) | 9.6 | 1100 | 4200 | 380 |
Glass-fiber reinforcement restricts isotropic contraction. Shrinkage separates the solidifying resin. Filled resins retain mechanical contact longer against the cavity core, yet they pull away faster from cavity side walls.
Amorphous materials contract more predictably. Differential cooling introduces residual stress. When gate freezing seals the cavity, pressure plummets to atmospheric levels within two to five seconds, causing immediate drops in the calibrated interfacial conductance.
Whether non-linear inverse routines can accurately separate polymer crystallization enthalpy from pure boundary resistance during rapid packing remains an unresolved challenge in commercial tooling qualification.

Gap
Microscopic surface irregularities on machined cavity plates create void spaces between polymer chains and tool steel. Polished cavity inserts accelerate heat dissipation. The mechanics of heat transfer under holding pressure involve coupled micro-contact mechanics and gas conduction.
Solidified polymer skin experiences elastic and plastic compression against steel peaks. Increasing packing pressure deforms these polymer asperities, driving the real contact area toward the apparent macroscopic surface area.

Air Entrapment and Microscopic Asperity Flattening
Cavity surface topography consists of microscopic peaks and valleys generated through electrical discharge machining or diamond polishing. Trapped gases within these valleys possess low thermal conductivity. High packing force flattens the compliant molten polymer skin into these microscopic depressions, displacing gas pockets toward microscopic venting channels along the parting line.
- Dynamic Filling Contact establishes initial boundary contact under shear flow with minimal packing pressure, yielding baseline heat transfer coefficients near 500 W/(m²·K).
- Packing Consolidation compresses molten core material into micro-valleys, escalating conductance to values between 2500 and 4500 W/(m²·K).
- Pressure Dissipation occurs as the runner or gate freezes, initiating localized stress relaxation while conductance declines to 1200 W/(m²·K).
- Thermal Contraction Cleavage pulls the solidifying skin completely off cavity walls, leaving an insulating air gap that restricts conductance to 200 W/(m²·K).
Flow Path Pressure Attenuation
Hydraulic force delivered at the injection nozzle experiences steady dissipation along the runner system. Gate geometry governs holding efficiency. In long thin-walled geometries, a nozzle packing pressure of 1000 bar often delivers merely 300 bar to the end of the flow path.
The interfacial heat transfer coefficient varies dramatically as a function of distance from the gate.
Local interfacial conductance varies by more than three hundred percent across a single part between the gate zone and the end of fill.
Near the gate, extended high pressure maintains intimate steel contact, forcing rapid cooling and dense crystallization. At flow extremities, low local packing pressure permits premature air gap formation. The local heat transfer coefficient collapses early in the cycle.
The part retains heat longer at the flow end than near the gate, creating severe temperature gradients across the part thickness and driving out-of-plane twist and warpage.
Higher packing pressure delays detachment while smooth polishing accelerates conduction.

Ledger
Tooling investment decisions hinge on predictable press cycle times and strict part tolerances. Cycle time dictates production economics. Standard commercial quotes routinely estimate cooling time using textbook thermal diffusivity values combined with perfect mould contact assumptions.
Tool steel conductivity dictates baseline flow. In real production runs, imperfect boundary conductance lengthens the required cooling duration before parts can eject without pin push-through or post-moulding distortion.
Cycle Time Penalties and Tool Steel Sizing
Cooling phase duration accounts for sixty to seventy-five percent of overall moulding duration. Take an eight-cavity tool producing a precision polyoxymethylene gear housing with a nominal wall thickness of 2.8 millimeters. Press clamp tonnage restricts cavity area.
Assume an annual commitment of two million mouldings running on an automated 150-tonne injection moulding cell priced at seventy-five dollars per press hour.
A conventional filling simulation utilizing a static interfacial heat transfer coefficient of 2000 W/(m²·K) predicts a safe ejection cooling time of 11.2 seconds, resulting in a total dry cycle time of 16.4 seconds. When calibrated pressure-dependent heat transfer data is introduced, accounting for holding pressure drop and premature gap formation, the actual calculated cooling time rises to 14.8 seconds. Total cycle time expands to 20.0 seconds.
| Cooling Calculation Basis | Cooling Time (s) | Total Cycle (s) | Annual Press Hours | Annual Machine Cost ($) | Piece Cost Variance ($) |
|---|---|---|---|---|---|
| Uncalibrated Static Simulation (h_int = 2000) | 11.2 | 16.4 | 1,139 | 85,425 | Baseline Reference |
| Calibrated Dynamic Pressure Model | 14.8 | 20.0 | 1,389 | 104,175 | +0.0094 per part |
| Calibrated Model with Conformal P-20 Core | 12.1 | 17.3 | 1,201 | 90,075 | +0.0023 per part |
| Calibrated Model with Beryllium-Copper Insert | 9.8 | 15.0 | 1,042 | 78,150 | -0.0036 per part |
| Data calculated for an eight-cavity tool across 2,000,000 components annually at a 75 dollar machine-hour rate. | |||||

Commercial Specifications for RFQ Sourcing Packages
Procurement documents often omit interface heat transfer parameters entirely. Tool buyers regularly sign purchase orders containing cycle time estimates generated from unrealistic thermal simulations. When the toolmaker trials the mould, the parts fail ejection criteria at the quoted cycle time because the polymer core remains rubbery and hot.
A contract that specifies cycle time without defining resin grade and cavity pressure conditions leaves the buyer unprotected against cooling rate disputes.
Extending the press cooling time rectifies part stability, but it destroys quoted component pricing. Buyers facing tight tolerances must insist on tool steel selections and cooling layouts designed against dynamic heat transfer assumptions rather than idealized models.
- Documented Inverse Calibration Data confirms that the toolmaker ran thermal calibration on equivalent tool steel and surface roughness grades.
- Cavity Pressure Threshold Specifications establish the minimum packing pressure held across the entire cavity until gate freeze occurs.
- Alloy Insert Provisioning specifies copper-beryllium or aluminum-bronze cores in zones where thermal shrinkage creates premature air gaps.
- Dimensional Signoff Gates bind part tolerance signoff to steady-state continuous runs operating at quoted cycle speeds.
Standard DIN 16742 Clause 5.2 defines tolerance group assignments, forcing suppliers to absorb tooling rework costs when thermal shrinkage exceeds specified limits.