Dynamic Cavity Pressure Effects on Polymer Interfacial Heat Transfer Coefficients
Dynamic cavity pressure drives micro-asperity deformation to boost polymer interfacial thermal conductance tenfold, demanding pressure-dependent heat transfer models for cycle optimization.
Squeeze
The rate of solidification at the mold interface dictates cycle time, dimensional stability, and internal stress. As molten thermoplastic enters an arm-cavity during injection, the gap between the liquid polymer matrix at 200 to 380 degrees Celsius and the steel wall at 20 to 140 degrees Celsius generates an intense thermal flux. Boundary conductance is hardly static ~ the interfacial heat transfer coefficient can shift by three orders of magnitude over a single moulding cycle.
Peak cavity pressure forces liquid polymer into micro-asperities on the steel face, collapsing micro-air pockets and maximizing contact area. That drop in interfacial contact resistance allows rapid heat transfer into the tool steel cooling lines.
Pressure inside the impression evolves in distinct phases. During filling, dynamic pressure pushes the flow front forward, bringing liquid into initial contact with the cavity steel. Pressures here stay moderate ~ typically 10 to 30 MPa, depending on wall thickness, flow path length, and melt viscosity.
Heat transfer across the boundary remains relatively low at this point because the polymer skin freezes quickly without enough packing force to press into the steel micro-topography. Once full, the machine switches to packing pressure, raising local cavity pressure to between 40 and 120 MPa and driving the cooling skin into the steel surface features.
Micro-contact mechanics govern heat transfer during this high-pressure phase. Steel polished to an SPI A2 finish has peak-to-valley roughness around 0.05 micrometers, while textured surfaces like VDI 27 exceed 2.2 micrometers. Under high hydrostatic pressure, the viscoelastic polymer melt yields and deforms into micro-valleys on the steel wall.
Air caught in these valleys compresses or dissolves directly into the matrix. Heat moves through two parallel paths: direct metal-to-polymer contacts and thin pockets of compressed gas. Direct metal contact transfers heat two orders of magnitude faster than conduction through trapped gas gaps.
Elevating local packing pressure from 15 MPa to 80 MPa increases the interfacial thermal conductance from 450 W/m²K to 3200 W/m²K during the initial 1.8 seconds of wall contact.
Interfacial conductance directly dictates how fast the frozen polymer skin thickens. Higher heat transfer accelerates core cooling, cutting the residence time needed before ejection. In tool trials, raising packing pressure from 30 MPa to 70 MPa reduced frozen layer growth times by twenty-two percent in polypropylene test geometries.
Maintaining that elevated pressure holds mechanical contact even as the cooling polymer shell contracts. Once packing pressure drops or gate seal occurs, cavity pressure begins an irreversible decay that changes interface dynamics completely.
Asperity Deformation Mechanisms at High Packing Forces
Deformation of the solidifying polymer skin against steel roughness peaks follows non-linear viscoelastic contact rules. Right at contact, melt temperature sits well above the glass transition or melting point, giving the polymer chains high mobility. Low yield stress lets the melt conform under light force.
But as heat flows into the steel, the polymer layer right against the wall cools within milliseconds, passing through its phase transition. Local elastic modulus jumps three orders of magnitude, turning the soft interface into a rigid skin. High packing force must arrive before this skin solidifies; late packing cannot flatten frozen asperities, leaving microscopic air pockets that act as thermal insulators.
Viscoelastic creep allows minor contact expansion if pressure stays high. Once skin temperature drops well below crystallization or glass transition thresholds, plastic deformation stops altogether, and real contact area hits an asymptote. On smooth tool surfaces, measurements show contact surface fraction rising from fifteen percent at zero pressure to nearly ninety-eight percent under 100 MPa cavity pressure.
Textured cavities demand far higher force to reach equivalent contact because of their deep topography valleys.

Piezo Thermal Response of Molten Thermoplastics
Applying pressure alters the intrinsic physical properties of the melt in addition to modifying boundary geometry. Hydrostatic pressure compresses free volume, shifting both glass transition temperature and crystallization kinetics upward. Under 100 MPa cavity pressure, the glass transition temperature of amorphous materials rises by 15 to 25 Kelvin, triggering solidification at higher thermal energy states.
Semicrystalline resins crystallize at higher temperatures when compressed, accelerating latent heat release during phase change. Bulk thermal conductivity also increases slightly under hydrostatic compression, giving a small extra boost to heat removal.
When the gate freezes, dynamic pressure decay breaks this high-conductance regime. Once material in the runner or gate solidifies, hydraulic pressure from the screw can no longer reach the cavity. As the part core continues to solidify, it shrinks and gains density.
Without incoming melt to compensate, cavity pressure falls toward ambient. The compressed skin relaxes, and localized thermal stresses begin pulling the polymer away from the steel on a micro scale.
Breakdown of interfacial heat transfer occurs across distinct pressure regimes during the injection cycle:
- Hydrodynamic Conduction Phase occurs during cavity filling, where low static pressure yields transient contact dominated by shear heating and thin skin formation.
- Consolidated Contact Phase establishes peak interfacial heat transfer coefficients between 2000 and 5000 W/m²K under full packing pressure.
- Pressure Decay Phase begins when gate seal cuts off melt replenishment, dropping local conductance down to intermediate values around 800 W/m²K.
- Clearance Gap Phase marks total detachment, where heat transfer drops below 150 W/m²K and relies entirely on inefficient gas conduction and radiation across the air gap.
Ignoring dynamic heat transfer leads to gross errors in cycle time estimation and cooling channel design. A process built on static assumptions risks opening the tool too early ~ ejecting parts while core temperatures remain above safe structural thresholds, which causes distortion, sink marks, or sidewall blowouts.
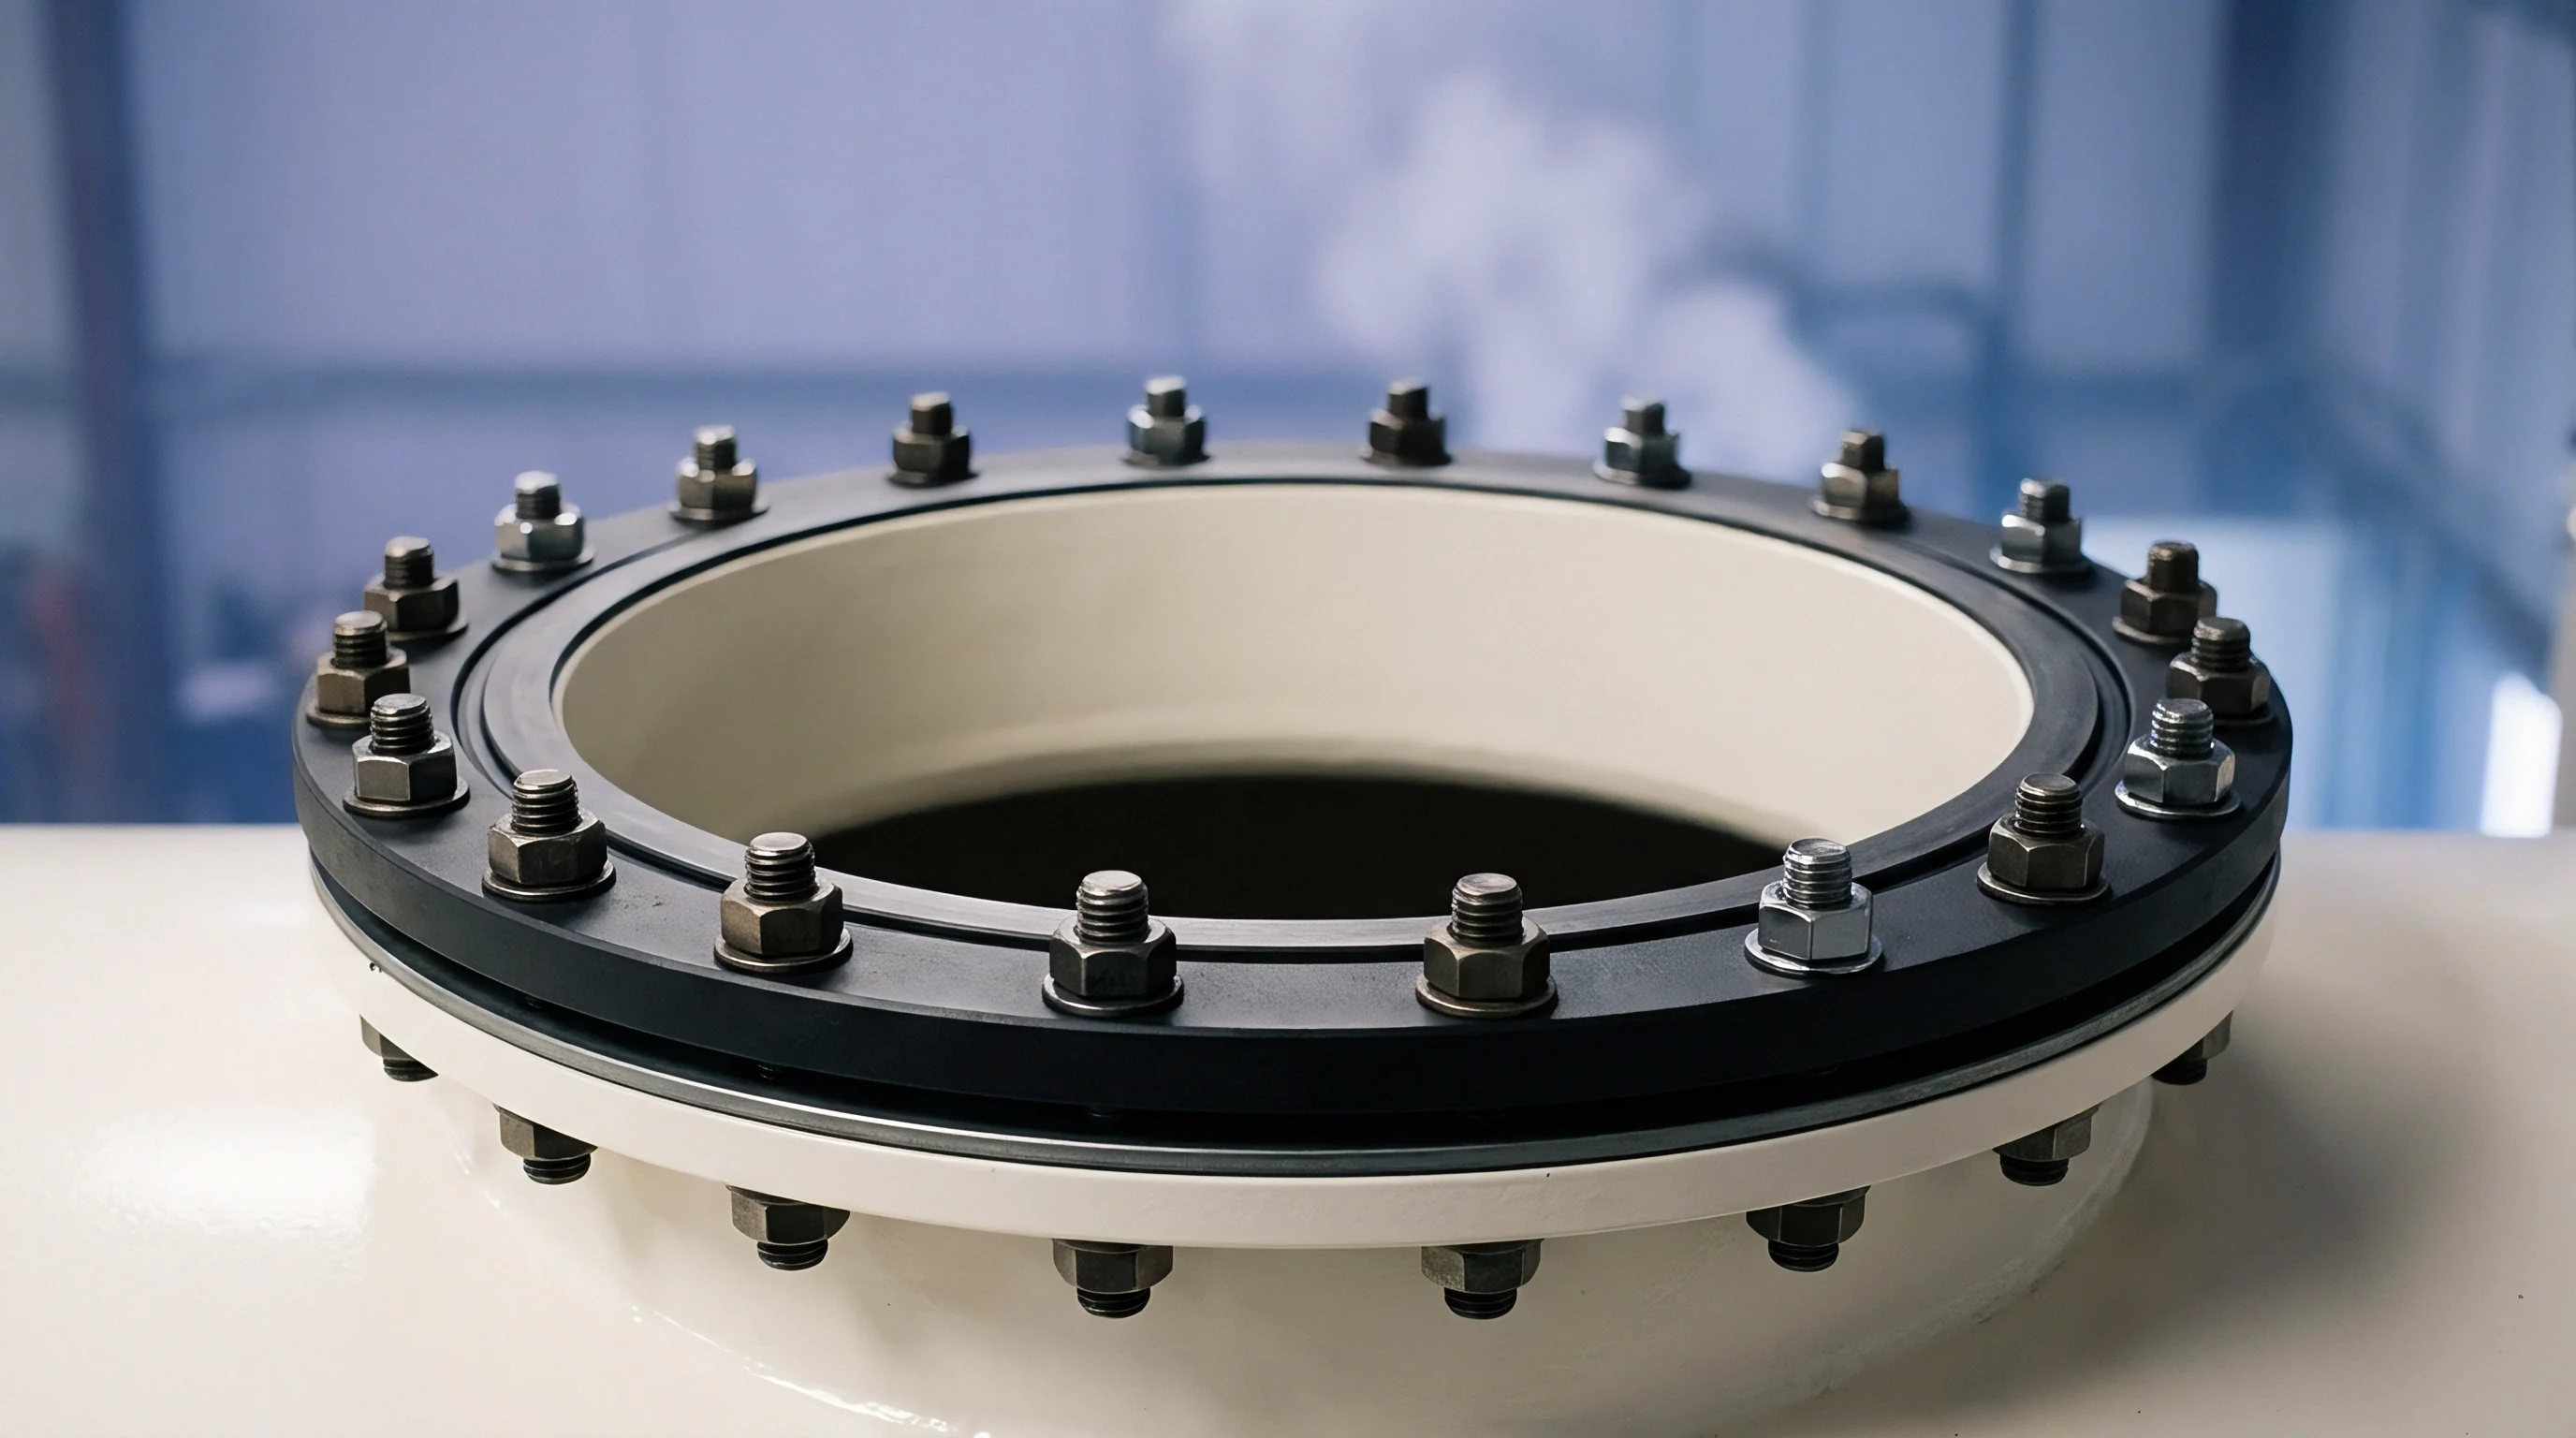
Conductance
Thermal transport across the boundary layer depends directly on micro-topography at the metal surface and polymer chain mobility. Interfacial thermal conductance measures energy transfer across the junction per unit area and temperature differential. Measuring it accurately requires dynamic testing; static bench tests miss the steep transient temperature gradients and pressure histories inherent to high-pressure processing.
Tool designers rely on these figures to size cooling channels, pick steel alloys, and estimate thermal recovery times between shots.
Tool steel selection alters the temperature gradient right at the boundary. Highly conductive metals ~ like beryllium-copper or premium copper-nickel-silicon alloys ~ pull heat away instantly, keeping surface temperatures lower than standard P20 or H13 steels under identical cooling flow. That colder boundary rapidly freezes the touching polymer layer and increases its resistance to deformation.
Paradoxically, an overly cold tool surface can reduce total contact area if the polymer skin freezes before peak packing pressure establishes full intimate contact. Balancing tool wall temperature against packing speed ensures optimum micro-asperity compliance before the skin freezes solid.
Surface finish dictates the physical void volume remaining at the interface under pressure. A mirror-polished steel face offers continuous planar contact, minimizing the displacement needed for polymer to touch across the area. By contrast, chemical etching, wire EDM, and shot-peened finishes create complex three-dimensional void structures where bridging polymer leaves trapped air pockets.
Air has a thermal conductivity near 0.026 W/mK, compared to 0.15 ~ 0.35 W/mK for typical unreinforced polymer melts and 25 ~ 45 W/mK for tool steel. Trapped air gaps act as thermal barriers, cutting local heat transfer coefficients by orders of magnitude.
Compliance with ISO 294 specification mandates cavity pressure transducer calibration before evaluating thermal contact resistance curves.
Polymer chemistry determines sensitivity to boundary pressure variations. Semi-crystalline resins like polypropylene, polyamide 66, and polyoxymethylene shrink substantially during crystallization as random chains align into dense lattices. Amorphous polymers like polycarbonate, ABS, and polysulfone show linear density changes governed strictly by thermal expansion coefficients.
Because of this, semi-crystalline materials require sustained, high packing pressure to maintain thermal contact during crystallization, while amorphous grades hold contact across broader pressure ranges.
| Polymer Family | Tool Finish Grade | Filling Pressure h_i (W/m²K) | Packing Pressure h_i (W/m²K) | Gap Phase h_i (W/m²K) |
|---|---|---|---|---|
| Polypropylene (Unreinforced) | SPI A2 (Polished) | 380 | 2850 | 110 |
| Polypropylene (Unreinforced) | VDI 27 (Textured) | 210 | 1650 | 75 |
| Polyamide 66 (30% Glass) | SPI A2 (Polished) | 520 | 3900 | 140 |
| Polyamide 66 (30% Glass) | VDI 27 (Textured) | 290 | 2400 | 85 |
| Polycarbonate (Unfilled) | SPI A2 (Polished) | 410 | 2200 | 125 |
| Polycarbonate (Unfilled) | VDI 27 (Textured) | 240 | 1350 | 80 |
| PEEK (Unfilled) | SPI A2 (Polished) | 680 | 4500 | 160 |
| Values measured using fast-response piezo sensors and surface thermocouples under ISO 20753 specimen geometries with tool temperature set at 60 degrees Celsius for commodity grades and 160 degrees Celsius for high-temperature grades. | ||||
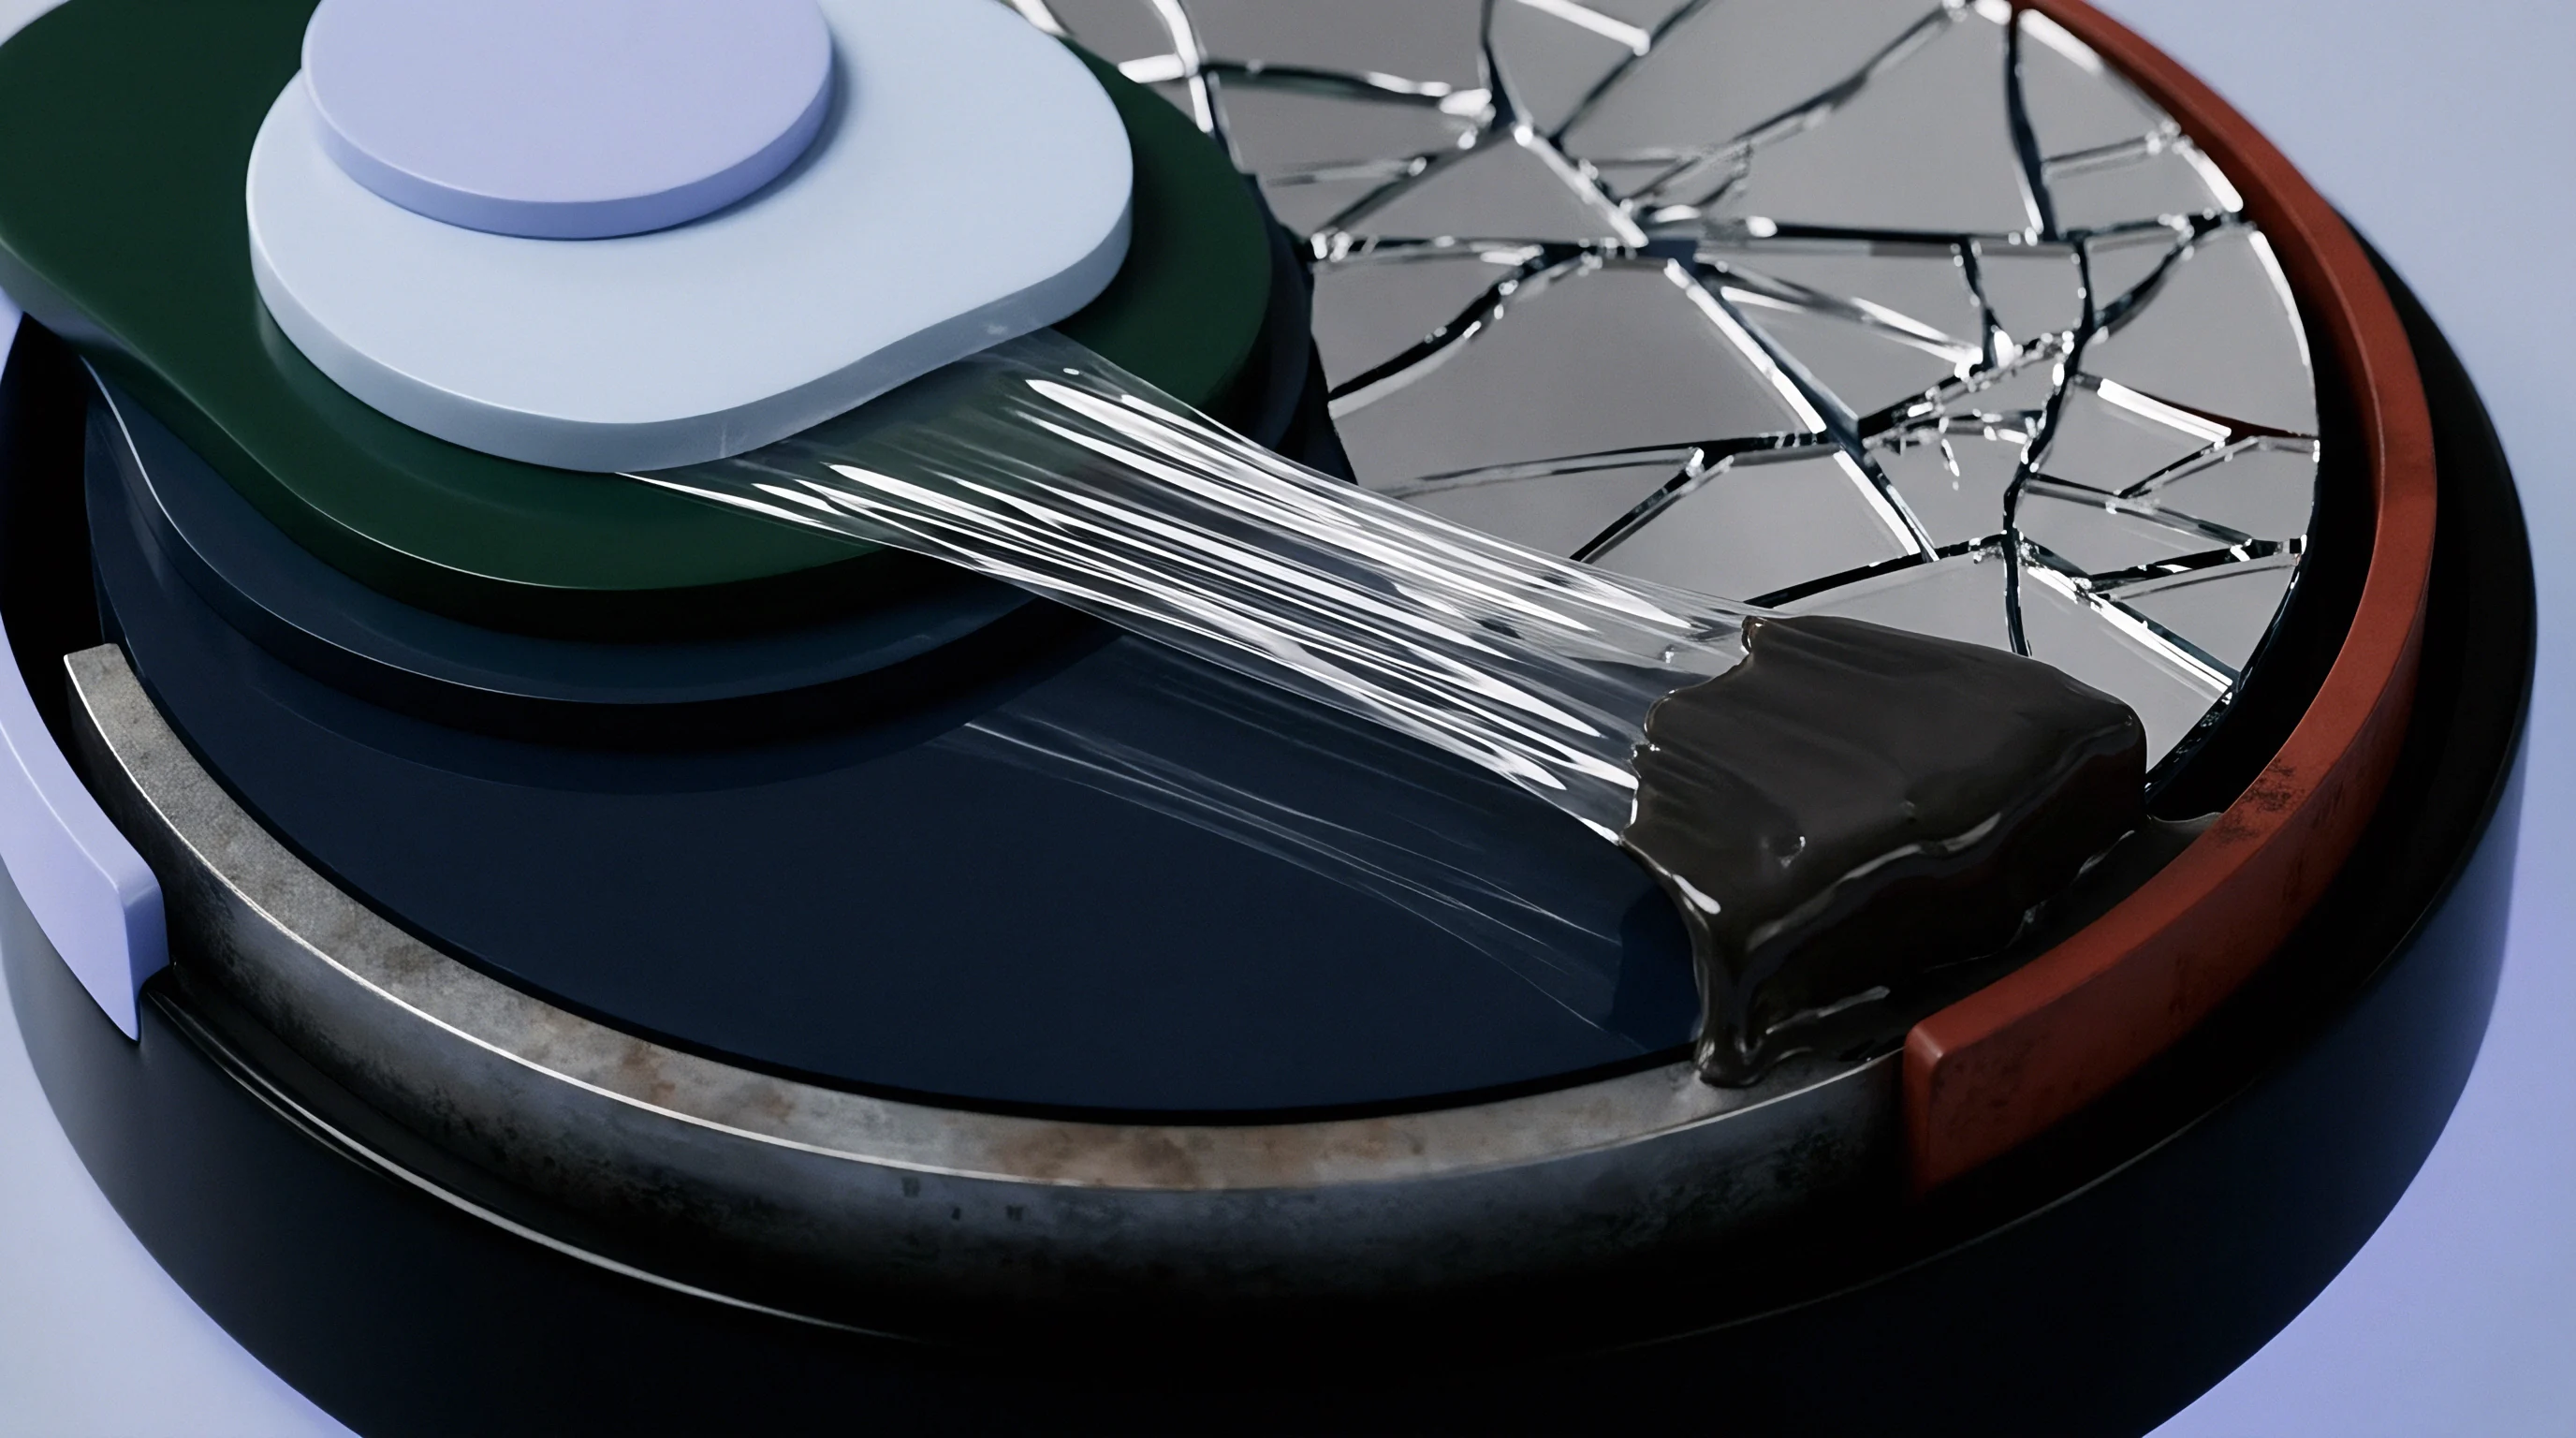
Surface Finish Impact on Boundary Contact Area
Surface topography dictates the resistance polymer melt encounters during compaction. Standard roughness metrics like center-line average roughness ignore peak spacing and slope steepness. Spatial parameters ~ such as mean peak spacing and root-mean-square slope ~ give a clearer picture of how well polymer will seat.
Under equal packing force, narrow, steep valleys prevent melt penetration and leave micro air pockets trapped at the bottom. Polishing the tool reduces valley depth, allowing complete polymer wet-out across the steel under standard hydraulic pressure.
Specialized coatings like titanium nitride, diamond-like carbon, and chrome plating alter surface energy along with topography. Low-energy coatings reduce polymer adhesion for easier ejection, but they can sometimes hinder melt wetting during initial filling. Wetting angles below ninety degrees help polymer spread over micro-roughness peaks, increasing real contact area before freezing.
Mold releases and surface contamination leave low-conductivity films that severely degrade interfacial conductance, even under high hydraulic pressure.

Morphological Differences in Semicrystalline and Amorphous Polymers
Semicrystalline polymers show a distinct step-change in thermal transport properties at their freezing point. Latent heat of fusion must cross the interface during crystallization, pinning boundary temperature near the crystallization point during a prolonged dwell. High interfacial conductance through this phase speeds up latent heat removal and completes the phase change sooner.
Slower heat removal leaves the core soft longer, extending required clamp time.
Amorphous materials undergo a continuous glass transition without latent heat step-changes. Thermal diffusivity shifts smoothly as temperature drops, so heat transfer depends mainly on local density gains from packing pressure. Fillers change these dynamics significantly: glass fiber, carbon fiber, and mineral loaded resins increase bulk thermal conductivity but raise melt viscosity.
Fiber orientation along cavity walls creates anisotropic conductivity zones, conducting heat faster along the flow path than through the wall thickness.
Tooling documentation must state specific physical constraints when defining boundary cooling protocols:
- Specified Cavity Surface Topography defined via SPI or VDI standards along with allowable peak spacing tolerances.
- Pressure Dependent Conductance Curves mapped across the target polymer grade’s processing temperature window.
- Minimum Gate Freeze Thresholds establishing the precise time limit for effective pressure transmission into the core.
- Cooling Line Distance Requirements fixing the maximum allowable distance between cavity steel and water circuits.
When a toolmaker blames cycle delays on cooling water flow, the underlying issue is often lost micro-contact area from insufficient packing pressure through an undersized gate.

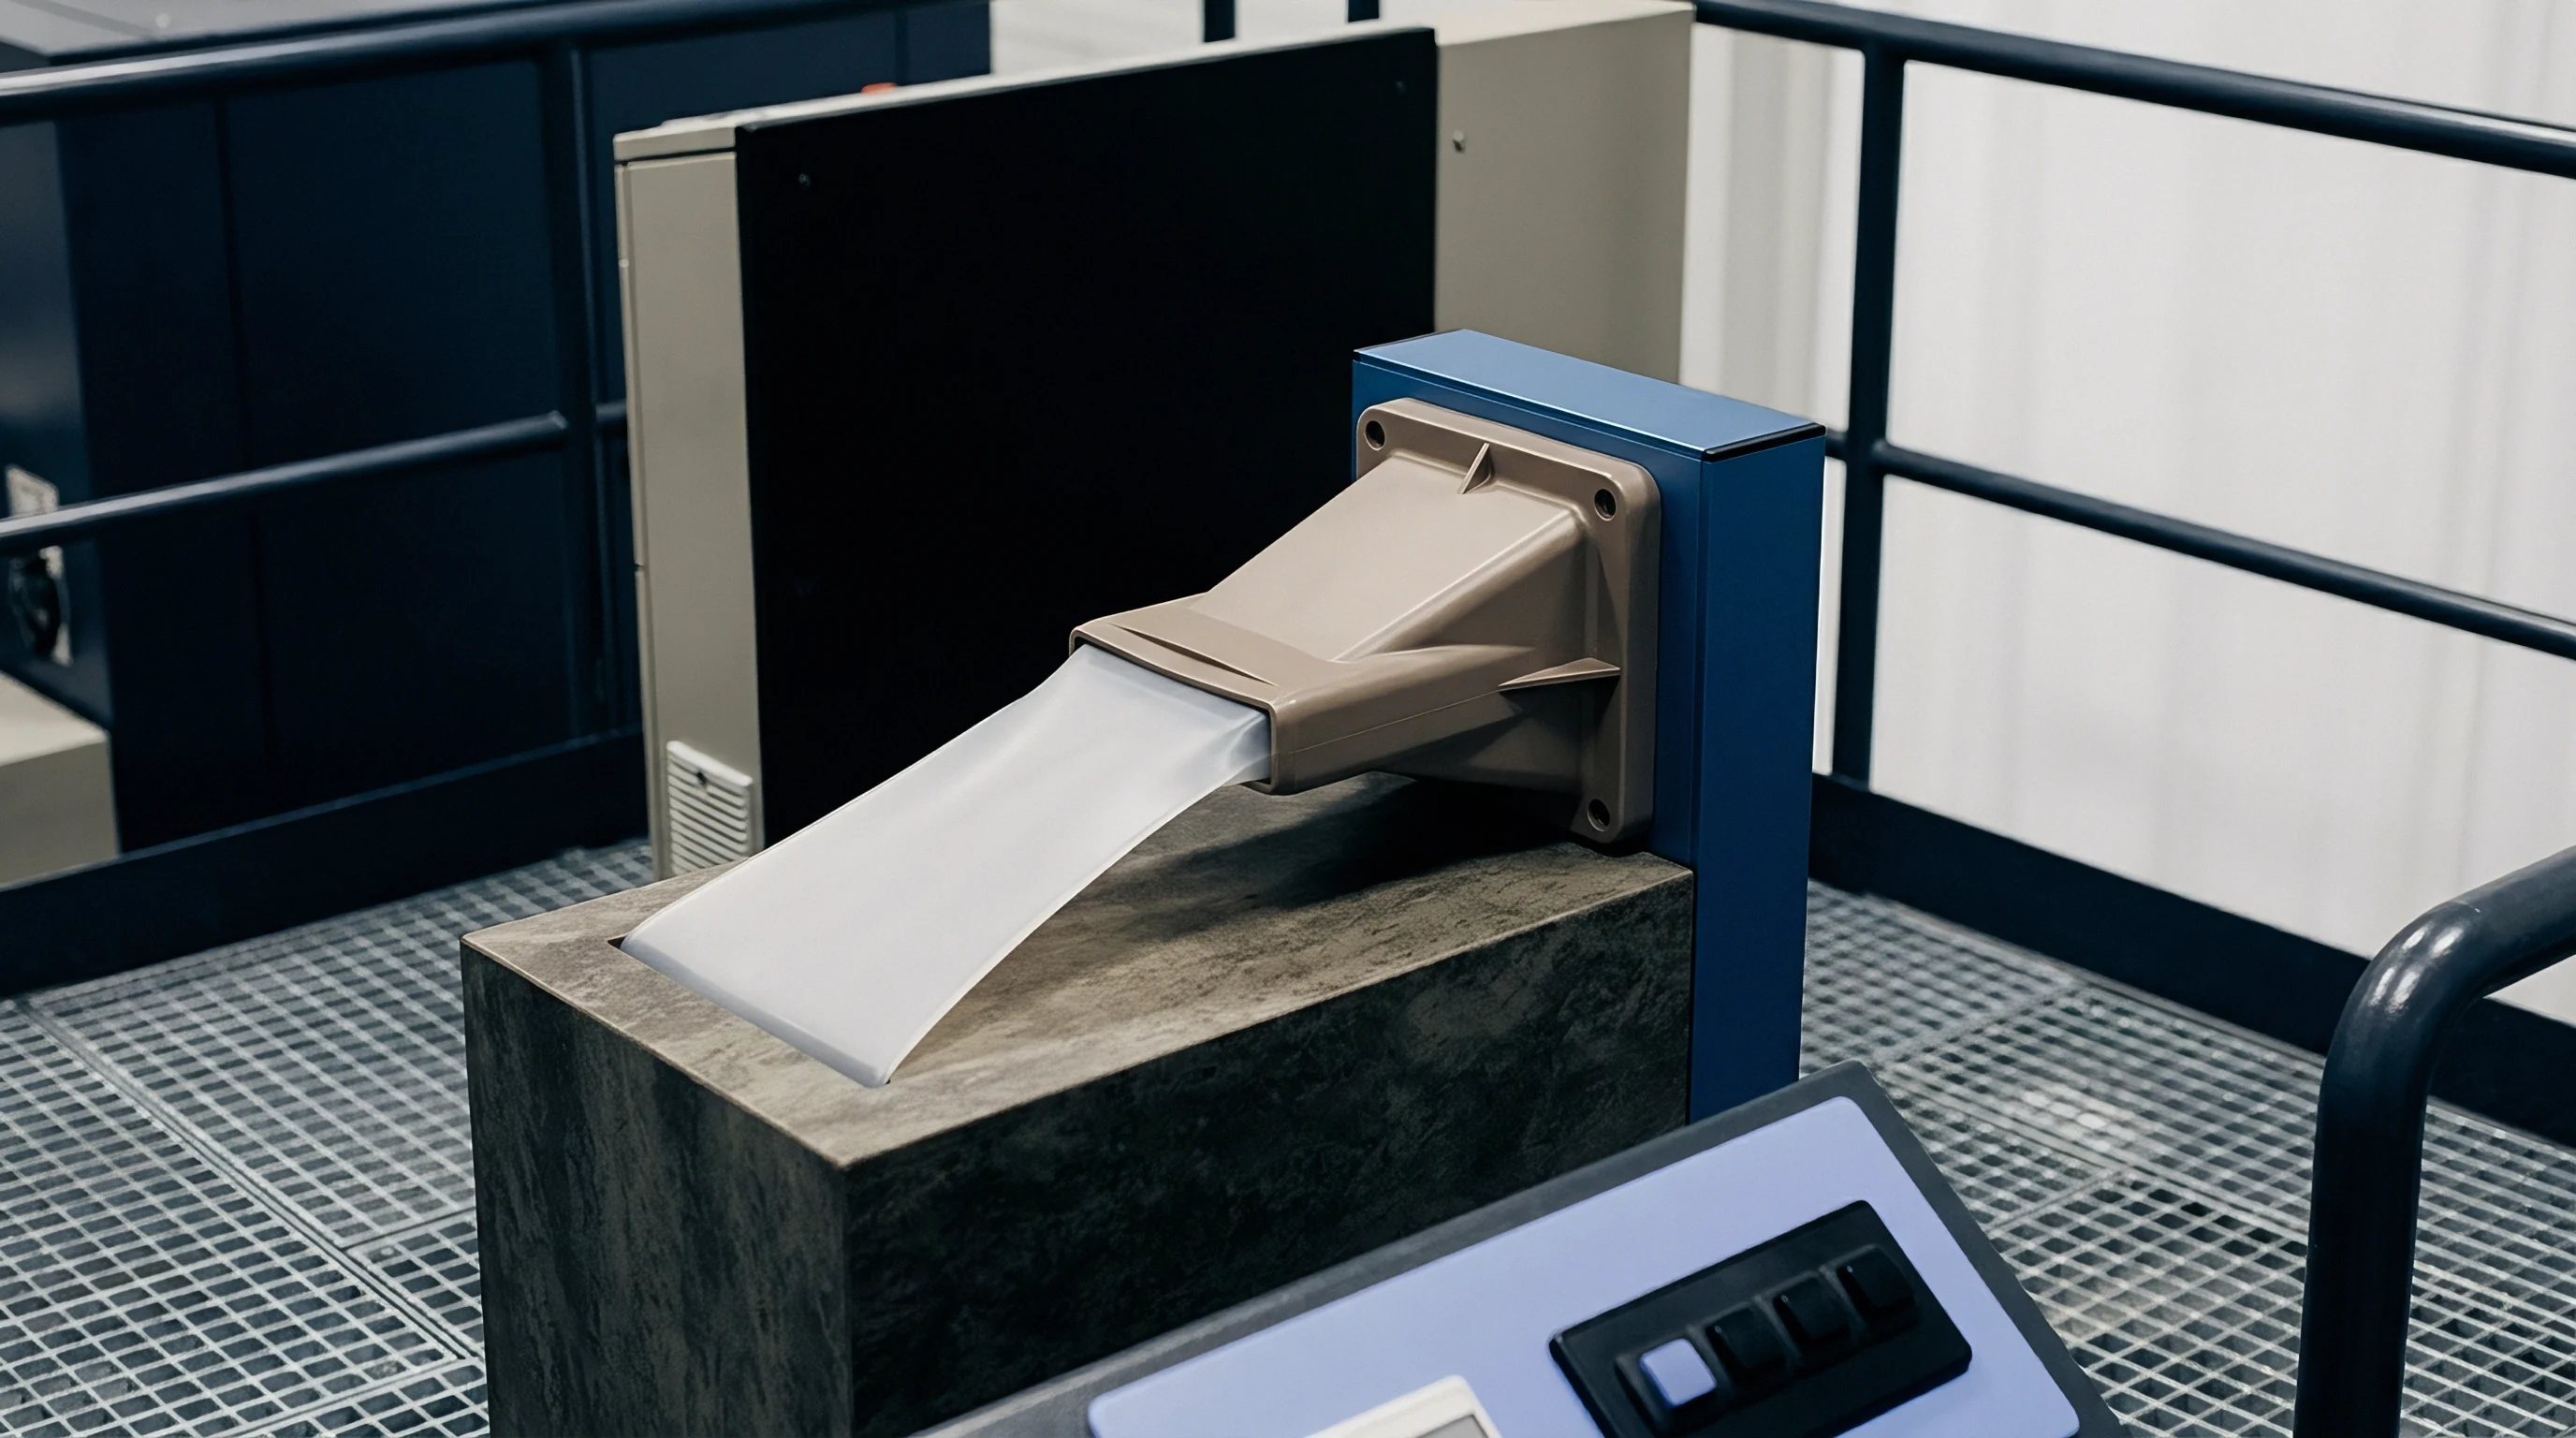
Shrinkage
Volumetric contraction during crystallization induces detachment between the cooling shell and the tool wall. Thermal contraction starts the moment melt touches steel, but packing pressure offsets volumetric loss by forcing extra material into the cavity. Once the gate freezes or cavity pressure drops below internal melt forces, shrinkage wins out over mechanical pressure.
The polymer skin pulls off the metal on a micro scale, forming a clearance gap. Replacing direct solid contact with stagnant gas causes interfacial conductance to collapse.
Gap formation is rarely uniform across complex shapes. Flat surfaces tend to pull away evenly, creating predictable insulating air gaps. Conversely, internal corners and features wrapped around male core pins shrink tight onto the steel as they contract.
That mechanical clamping holds contact pressure high throughout cooling, while external cavity walls opposite the core pull away entirely ~ creating a sharp thermal imbalance across the wall section.
Thermal asymmetry across part thickness generates severe differential cooling stresses. The side touching steel cools rapidly into a dense, highly oriented skin. The detached side loses heat slowly through the air gap, trapping thermal energy in the core.
This imbalance causes uneven shrinkage across the wall thickness, resulting in post-moulding warpage, bow, and twist. Correcting it requires precise dynamic modeling of the pressure-dependent detachment phase.
Cooling cycle duration drops substantially when holding pressure maintains intimate tool steel contact until core temperature reaches the heat deflection threshold.
Once detachment occurs, air gap thickness dictates heat flux. Micro-gaps usually measure 5 to 50 micrometers in early cooling, opening wider as the part solidifies and shrinks toward its neutral dimensions. Heat transfer across micro-gaps occurs mostly by conduction through trapped gas; radiation contributes under five percent at normal processing temperatures below 300 degrees Celsius.
Because static gas has low thermal conductivity, heat flux drops 80 to 95 percent the moment a continuous air film forms.
Thermal Air Gap Formation Post Gate Freeze
Gate seal is the exact transition point where dynamic pressure control ends. Until the gate freezes, the injection unit maintains pressure against the cooling mass, packing in material to offset density changes. Once frozen, the cavity mass is locked.
As internal temperature keeps dropping, thermal contraction proceeds according to the material’s specific volume curve across temperature and pressure.
Internal cavity pressure falls rapidly after gate seal. As gauge pressure approaches zero, the polymer skin loses its mechanical clamping force against the steel topography, and elastic strain stored in the skin relaxes inward. Local separation starts where thermal gradients or wall thickness variations produce peak shrinkage.
This thermal gap acts as an insulating blanket, slowing heat loss from the liquid core and forcing longer mold lock times.

Should Cavity Pressure Traces Dictate Cooling Time Signoff?
Relying on arbitrary timers to open the press risks ejecting parts before they achieve dimensional stability. In-cavity pressure sensors show precisely when boundary detachment occurs across critical part zones. Monitoring decay curves lets process engineers set cooling times based on actual contact loss rather than conservative guesswork.
When traces confirm sustained contact across functional surfaces, press open commands can trigger safely ~ trimming unnecessary dwell time out of production.
Executing an empirical process window validation for thermal contact optimization demands disciplined step-by-step procedures press-side:
- Install piezoelectric cavity pressure sensors directly behind key nominal wall sections, gate locations, and last-to-fill flow end zones.
- Establish a decoupled moulding process, setting fill speed to achieve ninety-five percent cavity filling without packing assistance.
- Apply incremental packing pressure steps while recording cavity pressure decay curves and measuring part weight stability to confirm gate seal timing.
- Monitor the precise time offset between hydraulic pressure drop and cavity pressure transducer zero-line return across all sensing locations.
- Correlate part warpage measurements against cavity pressure contact duration to identify minimum holding pressure thresholds required for surface contact.
Parts ejected immediately after gap formation retain substantial core heat. That heat migrates outward post-ejection, softening the outer skin and causing sink marks on functional surfaces.

Computation
Simulation models frequently simplify boundary conditions by assigning static heat transfer rates to cavity walls. Commercial mold filling software routinely defaults to a single interfacial heat transfer coefficient ~ typically between 1000 and 1500 W/m²K ~ across injection, packing, and cooling. This simplification creates sharp discrepancies between simulated thermal profiles and actual press measurements.
Real cavities experience dynamic coefficients ranging from under 200 W/m²K during filling up to 4000 W/m²K under peak packing, falling to 100 W/m²K after gap formation.
Predicting part warpage and final dimensions accurately requires incorporating pressure-dependent thermal contact resistance algorithms into the numerical solver. Heat transfer modeling at the polymer-tool interface relies on Fourier’s law coupled with a dynamic contact resistance factor:
q = h_i(P, T, Surface) (T_polymer_surface – T_tool_surface)
The variable coefficient h_i adjusts dynamically at every surface node based on local pressure, surface temperature, and gap distance. Empirical relationships formulate this pressure dependency using exponential saturation or piecewise step equations:
h_i(P) = h_gap + (h_max – h_gap) (1 – exp(-beta P_cavity))
Where h_gap represents thermal conductance across the air gap after separation, h_max is maximum contact conductance under full pressure, beta is an empirical pressure sensitivity constant from test data, and P_cavity is local pressure at the surface coordinate.
Assuming constant thermal contact causes software to overestimate heat removal during filling and post-gate freeze while underestimating heat flux during peak packing. Overestimating heat loss during filling leads solvers to predict artificially high melt viscosity, prompting engineers to specify unnecessarily high melt temperatures or oversized machines. Post-gate freeze, overestimating heat loss yields unrealistically fast core cooling predictions that fail on the factory floor.
Predicting volumetric warpage with static boundary coefficients yields dimensional errors exceeding thirty percent in thick wall structural ribs.
Integrating pressure-dependent boundary algorithms into finite element solvers alters predicted thermal stress distributions throughout the component. In one automotive structural cover analysis, introducing dynamic boundary equations shifted the predicted maximum warpage location by over fourteen millimeters compared to static calculations. Capturing true cooling rates is essential for predicting volumetric shrinkage, skin-core residual stresses, and post-moulding relaxation.
| Performance Metric | Static h_i Model (1250 W/m²K) | Dynamic h_i(P) Model | Physical Tool Measurement | Static Model Variance (%) | Dynamic Model Variance (%) |
|---|---|---|---|---|---|
| Time to Core Freezing (s) | 14.2 | 18.6 | 18.9 | -24.8% | -1.5% |
| Peak Cavity Wall Temp (°C) | 82.4 | 104.1 | 106.5 | -22.6% | -2.2% |
| Maximum Part Warpage (mm) | 1.12 | 2.45 | 2.52 | -54.3% | -2.7% |
| Optimal Packing Time (s) | 6.5 | 9.2 | 9.5 | -31.5% | -3.1% |
| Volumetric Shrinkage (%) | 4.1% | 6.3% | 6.5% | -36.9% | -3.0% |
Mathematical Formulation of Dynamic Boundary Conductance
Formulating pressure-dependent boundary terms requires coupling mechanical and thermal governing equations in the solver. Boundary resistance models calculate instantaneous contact area fractions from polymer elastic modulus, pressure, and surface topography. This contact fraction directly scales thermal conductance between air gap insulation and solid metallic contact.
Solvers evaluate these equations iteratively at every time step across all cavity boundary nodes. When local node pressure is zero, the software applies air gap conductance based on node displacement vectors. As pressure mounts during packing, it calculates contact area expansion and ramps up thermal conductance.
This coupling between mechanical deformation and thermal transport increases compute times, but provides true physical accuracy.

Simulation Discrepancies in Commercial Injection Software
Default material databases in commercial software rarely include calibrated pressure-dependent contact parameters. Engineers who rely on default outputs without checking boundary conditions accept implicit errors in cooling calculations. Improving accuracy requires importing empirical test data that maps heat transfer coefficients against pressure and interface temperature gradients.
Custom user subroutines can override default boundary values. Implementing contact resistance routines ensures solver runs reflect physical tool finishes, steel conductivities, and dynamic pressure decay profiles measured directly on production tooling.
Worked Thermal Analysis of Semi Crystalline Engine Cover
An automotive engine cover molded from 30% glass-reinforced polyamide 66 illustrates the practical impact of dynamic boundary conditions. Wall thickness varies from 2.5 millimeters across nominal areas to 5.0 millimeters at main mounting bosses. The tool uses conventional P20 steel cavity inserts cooled by drilled oil circuits at 90 degrees Celsius.
Under a constant boundary model (h_i = 1250 W/m²K), simulation predicted complete boss core solidification in 15 seconds, suggesting a 22-second cycle time. Running the press on this recommendation produced severe sink marks and internal voiding in the 5.0-millimeter bosses. Thermal imaging during initial tool trials showed post-ejection surface temperatures far above predicted values.
Re-running the simulation with dynamic, pressure-dependent boundary terms altered the predicted thermal profile completely. During filling, low initial cavity pressure yields an interfacial coefficient near 300 W/m²K, so the melt flows with less skin freezing than static models predict. Applying 75 MPa packing pressure then drives conductance up to 3800 W/m²K, accelerating heat removal during early holding.
Because the thick boss features sit far from the gate, local packing pressure drops rapidly when thin nominal walls freeze off. Conductance at the boss zone collapses to 200 W/m²K while the inner core is still molten. This early air gap thermally insulates the core, extending true freezing time to 21.8 seconds.
Dynamic simulation correctly highlighted the need for localized conformal cooling or altered gate placement to sustain cavity pressure until the boss core fully solidifies.
How do mold designers resolve discrepancies between calculated tool steel cooling capacity and variable thermal boundary contact losses without extending physical tool trial iterations?


Margin
Machine cycle time dictates hourly press rates and unit costs in volume production. In injection moulding, cooling accounts for sixty to eighty percent of total cycle time. Padding cooling timers to buffer against dimensional instability inflates piece prices and ties up press capacity.
Optimizing heat transfer by maintaining cavity pressure until parts stabilize thermally cuts dwell time, expanding margins for molders and OEMs alike.
Tooling investments must balance the cost of cavity pressure sensors and advanced cooling against piece-price savings over the production run. Installing pressure transducers behind critical features requires hardware, pocket machining, and signal integration. However, using real-time cavity pressure data to control packing and ejection guarantees quality while operating at the physical limit of thermal heat removal.
Consider an automated cell running a four-cavity packaging tool on a 300-ton press at an hourly rate of 85.00 USD. Initial toolmaker estimates put target cycle time at 16.0 seconds. Installing direct cavity pressure control enables precise management of contact resistance, maintaining packing contact and allowing safe ejection at 13.5 seconds without warpage.
Shaving 2.5 seconds off the cycle boosts hourly output from 900 to 1066 parts, dropping unit cost by fifteen percent and saving over 45000 USD annually on a single tool across two shifts.
Amortizing specialized tooling features against total production volume demonstrates clear financial thresholds where pressure-optimized thermal management pays dividends:
Tooling Amortization = (Sensor Hardware Cost + Conformal Channel Sinking) / Total Planned Part Volume
When volume exceeds 250000 units annually, added tooling investments for pressure monitoring amortize to fractions of a cent per part while generating large savings in press time. For lower-volume parts, optimizing packing pressure profiles press-side can yield substantial cycle reductions without modifying tool steel.
Cycle Time Reduction through Real Time Pressure Management
Real-time cavity pressure feedback turns an open-loop timer-driven press into a closed-loop, physically responsive cell. Standard machines switch from fill to pack based on screw position and hold packing pressure for a fixed duration set on the HMI. If melt viscosity shifts due to regrind or lot variation, fixed timers under-pack or over-pack the cavity, throwing off thermal contact timing.
Closed-loop control monitors transducers inside the impression and adjusts hydraulic output dynamically to maintain target cavity pressure despite viscosity shifts. Sustaining uniform cavity pressure maintains consistent micro-asperity contact, stabilizing heat transfer shot after shot. Quality control moves from post-moulding inspection to in-process verification, cutting scrap from sink marks, voids, and warpage.

Tooling Sensor Investment against Amortized Piece Cost
Procuring new tooling demands strict contractual specs around cooling performance. Quotes frequently promise cycle times based on simplified cooling calculations without checking pressure transmission limits. RFQs should require toolmakers to submit thermal-mechanical simulations using pressure-dependent heat transfer boundary conditions before cutting steel.
Sourcing contracts should explicitly state acceptance criteria based on cavity pressure stability and uniform heat removal. Standardized verification clauses protect buyers from accepting tools that fail quoted cycle times because of thermal contact resistance.
To enforce these thermal performance standards, purchase specifications must embed unambiguous technical acceptance clauses directly into tooling contracts:
Tooling qualification protocols demand that the supplier demonstrate stable cavity pressure transmission across all cavity impressions, holding local pressure above 45 MPa for a minimum of 4.0 seconds post-filling, while maintaining part dimensional compliance under DIN 16742 TG6 tolerances at the specified minimum contract cycle time during a continuous eight-hour run.