Quantifying Structural Shear Thinning Discrepancies across Bimodal High Density Polyethylene Pipeline Compound Deliveries
Bimodal HDPE shear thinning variations alter die swelling and sag resistance, forcing wall thickness adjustments and increasing landed pipe cost.


Viscosity
Bimodal high-density polyethylene pipeline compounds balance environmental stress crack resistance and processability through two distinct molecular weight populations made in dual reactors. The low-molecular-weight fraction keeps the melt fluid and lowers extruder motor torque under high shear. The high-molecular-weight fraction provides the dense chain entanglements and short-chain branching that dictate long-term hydrostatic strength under ISO 9080 classifications.
Shifts in the ratio between these two polymer populations alter non-Newtonian flow, directly changing shear thinning efficiency during pipe extrusion.
Single-point melt flow measurements taken under static loads fail to show shear thinning differences between resin lots. A single value reflects flow at only one nominal shear rate, hiding broader shifts in molecular weight distribution and long-chain branching tails. Bimodal polymer chains align parallel to streamlines when forced through narrow die gaps at shear rates above 100 s⁻¹.
As a result, resin deliveries with identical melt flow rates often show very different apparent viscosities under real processing conditions, causing stability issues on high-throughput extrusion lines.
Subtle shifts in the high-molecular-weight tail alter melt elasticity and the melt strength governing sag without changing the single-point melt flow rate. When compound deliveries show poor shear thinning efficiency, barrel pressures rise, melt temperatures climb, and extrudate stability degrades. Pinpointing the molecular cause of these flow variations requires mapping non-linear shear behavior across the full shear rate range of the extrusion equipment.

Molecular Weight Distribution Architecture in Dual Reactor PE100
Polymerization across sequential slurry loop or gas-phase reactors creates a low mass matrix paired with an ultra-high molar mass fraction carrying short-chain branching. The low-molecular-weight homopolymer fraction has a narrow molecular weight distribution, with weight-average molar masses between 10,000 g/mol and 30,000 g/mol. This phase acts as an internal lubricant during processing, lowering zero-shear viscosity and reducing energy draw during melting and conveyance.
The high-molecular-weight copolymer fraction reaches weight-average molar masses between 200,000 g/mol and 600,000 g/mol. Comonomers like 1-butene or 1-hexene incorporate mainly into these long chains, concentrating hexyl or butyl side branches along the high molar mass backbone. These branches interrupt crystallite folding and form tie molecules across adjacent lamellae, providing high resistance to slow crack growth.
Shear thinning varies whenever reactor conditions shift the mass ratio between the two phases or alter the heavy fraction’s molecular weight tail.

Non-Newtonian Flow Curves and Shear Rate Sensitivity
At typical pipe processing shear rates between 100 s⁻¹ and 1000 s⁻¹, polymer chains uncoil and line up along extrusion streamlines, reducing resistance to flow. Bimodal polyethylenes exhibit pseudoplastic behavior, where viscosity drops continuously as shear rate rises. The slope of this drop defines the shear thinning index ~ a direct measure of how readily chain entanglements disentangle under mechanical stress.
Resin lots with a broader molecular weight distribution begin shear thinning at lower critical shear rates than narrower lots. If a delivery contains an exaggerated high-molecular-weight tail, entanglements need more mechanical energy to separate, shifting the transition from the Newtonian plateau to lower shear rates. Dies running at constant volumetric throughput face higher wall shear stresses when processing material with sluggish shear thinning response.

Carreau-Yasuda Mathematical Modeling Parameters
Fitting experimental data across six decades of frequency yields four structural parameters that define steady shear behavior across plant operating temperatures. The Carreau-Yasuda fluid model expresses complex shear viscosity through shear rate, zero-shear viscosity, relaxation time, and power-law index:
η(γ) = η₀ · ^((n – 1) / a)
Here, η₀ is the zero-shear viscosity in Pa·s, λ is the characteristic relaxation time in seconds, a is the Yasuda parameter governing transition curvature between Newtonian and power-law regimes, and n is the dimensionless power-law slope index. Higher polydispersity pushes n lower, increasing pseudoplastic behavior. A resin lot where the power-law index shifts upward from 0.22 to 0.28 demands noticeably higher die pressure to maintain the same linear line speed.
Broader high-molecular-weight tails lower high-shear extrusion pressure but worsen sag resistance during thick-wall pipe cooling.
Tracking these mathematical parameters across incoming shipments offers a clear way to catch structural variations before resin enters plant silos. Table 1 outlines representative rheological and structural parameters measured across standard PE100 and advanced PE100-RC pipe compound batches.
| Compound Grade | Zero-Shear Viscosity η₀ (Pa·s) | Relaxation Time λ (s) | Power-Law Index n | Shear Thinning Ratio (η₀.₁ / η₁₀₀) | Polydispersity Index (Mw/Mn) |
|---|---|---|---|---|---|
| PE100 Standard Lot A | 185,000 | 1.45 | 0.245 | 14.8 | 14.2 |
| PE100 Standard Lot B | 210,000 | 1.82 | 0.268 | 12.1 | 12.8 |
| PE100-RC High-Stress Lot C | 265,000 | 2.35 | 0.210 | 18.5 | 18.5 |
| PE100-RC Standard Lot D | 240,000 | 2.10 | 0.225 | 16.2 | 16.8 |
| Data measured via small-amplitude oscillatory shear under ISO 6721-10 at 190 °C using 25 mm parallel plate geometry under nitrogen purge. | |||||
Rheological properties directly dictate compound behavior inside processing equipment. High zero-shear viscosity keeps the molten profile from sagging during vacuum calibration, while a steep power-law index keeps head pressures under control. When structural variations shift these parameters, operators end up constantly tweaking temperature profiles and line speeds.
Rheological failures during high-speed pipe extrusion reveal specific structural mechanisms inside the resin lot:
- Melt Fracture Instabilities develop when wall shear stress exceeds critical limits, causing sharkskin or gross extrudate distortion.
- Parison Sagging Defects happen when low zero-shear viscosity lets gravity pull the molten polymer downward before cooling finishes on large-diameter pipe.
- Extrudate Swell Fluctuations stem from inconsistent elastic strain energy in long chains, creating uncompensated wall thickness variations downstream.
- Pressure Driven Thermal Spikes build up when poor shear thinning increases viscous dissipation inside the die land, degrading thermal stabilizers.
Small variations in high-shear viscosity fall comfortably within standard plant tolerances and leave the nominal melt index printed on certificates of analysis unchanged, despite altering real extrusion performance.

Die
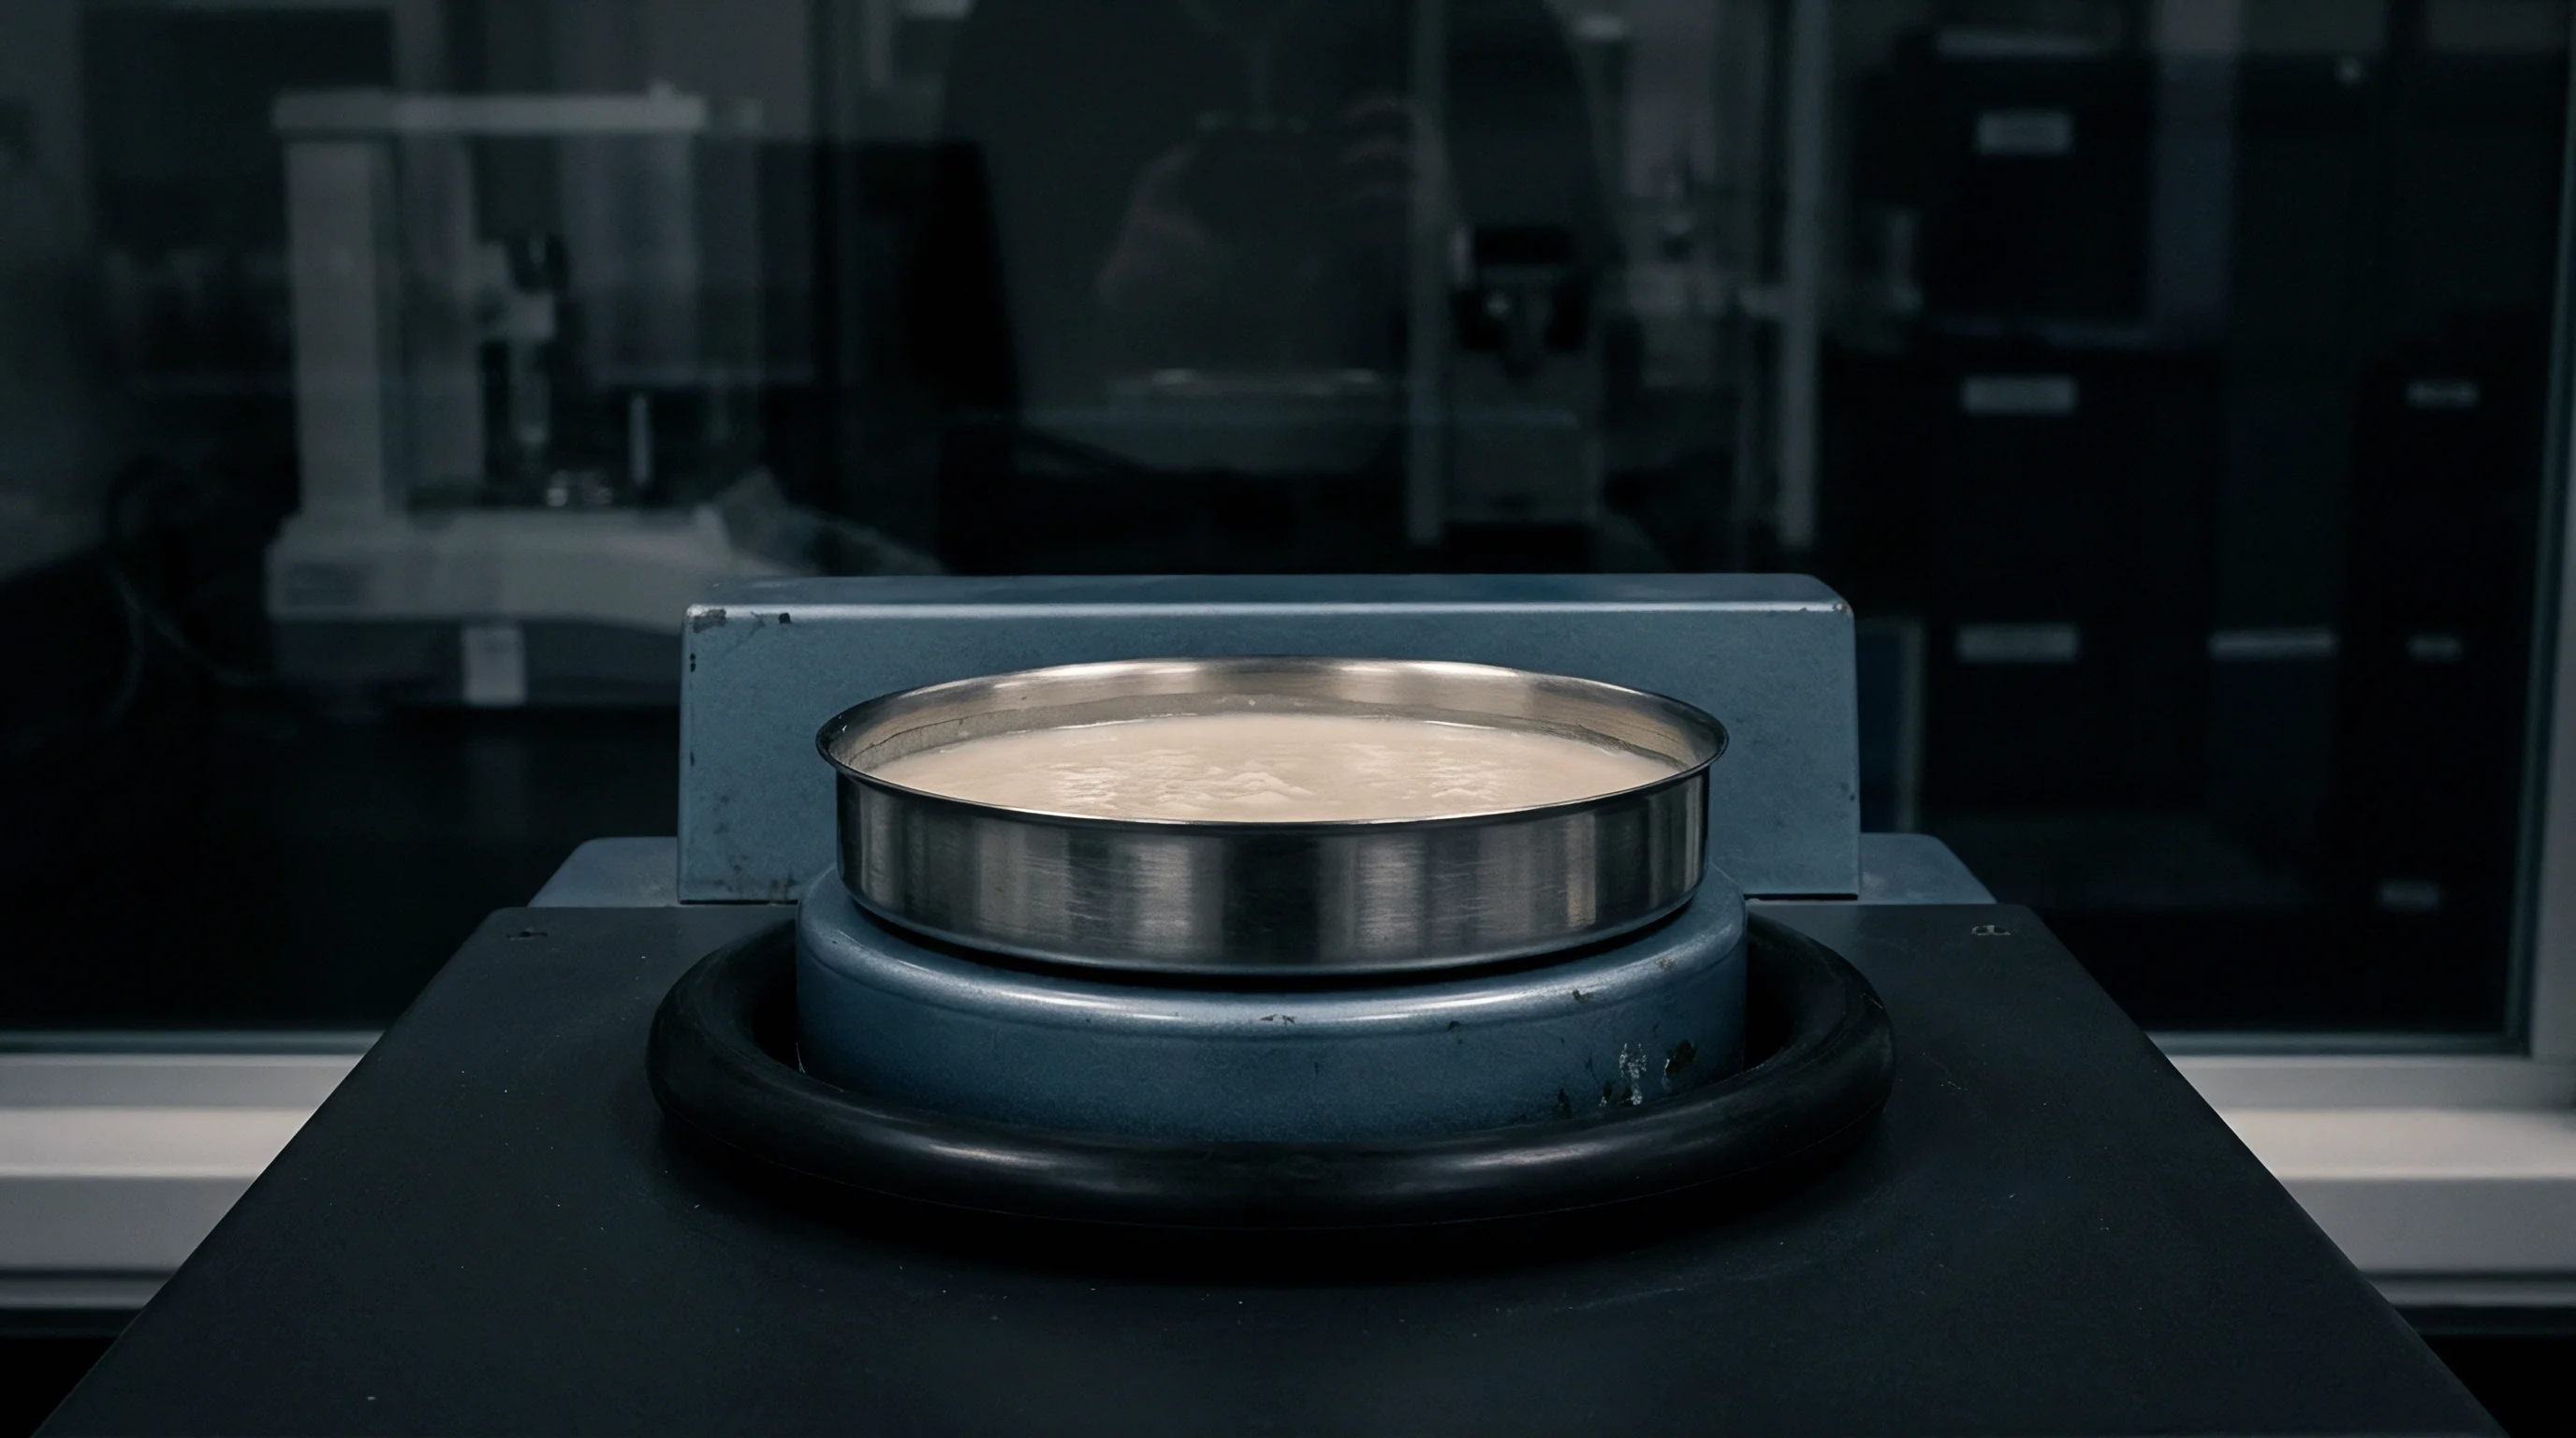
Extrusion tooling for large-diameter pressure pipe subjects bimodal compounds to heavy shear in the die land. Melt enters the die ring through spider legs or spiral distributors that blend velocity profiles and prevent weld lines. Shear rates inside spiral channels run from 50 s⁻¹ to well over 400 s⁻¹, putting the polymer squarely in its shear-thinning region.
Variations in pseudoplasticity disrupt the balanced flow distribution planned for the die.
A resin lot with weak shear thinning sensitivity encounters higher resistance inside the die, driving head pressure spikes and uneven flow around the circumference. The molten tube exits the die into a vacuum calibration sleeve where pipe dimensions freeze. Elastic strain built up in the die land relaxes right at the exit, causing extrudate swell that pushes dimensions beyond the sizing sleeve limits.
Uncontrolled swell leads to surface scoring, heavy drag in the vacuum tank, and locked-in circumferential stress.
Single-point index values miss these structural shifts entirely. Holding tight pipe wall symmetry requires consistent non-linear flow under high shear. Small changes in high-molecular-weight entanglement density alter relaxation times, shifting where swell occurs relative to the entrance of the calibration sleeve.

Extrudate Swell and Polymer Chain Entanglement
Elastic energy stored during high-shear deformation inside the die relaxes immediately upon exit, swelling the molten profile. The degree of extrudate swell scales directly with the ratio of first normal stress difference to shear stress in the die channel. Bimodal polyethylenes with prominent high-molecular-weight tails generate higher normal stress differences at equivalent shear rates, increasing swell ratios.
Standard extrudate swell measurements compare melt expansion against die gap dimensions. When resin batches vary in shear thinning behavior, swell ratios drift unpredictably between runs. An unexpected jump in swell increases profile thickness right as it enters the vacuum sleeve, driving up contact friction and gouging axial scratches along the pipe surface.

Parison Sag in Heavy Wall Pipe Extrusion
Gravity pulling down on thick molten walls between the vacuum tank entrance and internal cooling mandrel creates vertical wall thickness variations. Producing heavy-wall 1200 mm SDR 11 pipe requires high melt strength to hold shape until the polymer freezes. Sag resistance depends entirely on low-shear and zero-shear viscosity at very low deformation rates between 0.01 s⁻¹ and 0.1 s⁻¹.
A zero-shear viscosity value of 180,000 Pa·s at 190 °C reflects small-amplitude oscillatory shear measurements fitted to the Carreau-Yasuda model across a frequency sweep from 0.01 to 100 rad/s under ISO 6721-10. This figure drops if thermal degradation or cross-linking occurs during long residence times in the barrel. When resin lots fall short on zero-shear viscosity despite normal melt flow rates, the molten polymer sags before freezing ~ yielding thick bottoms and thin tops that breach ISO 4427 wall thickness tolerances.
Melt Fracture and Wall Slip Thresholds
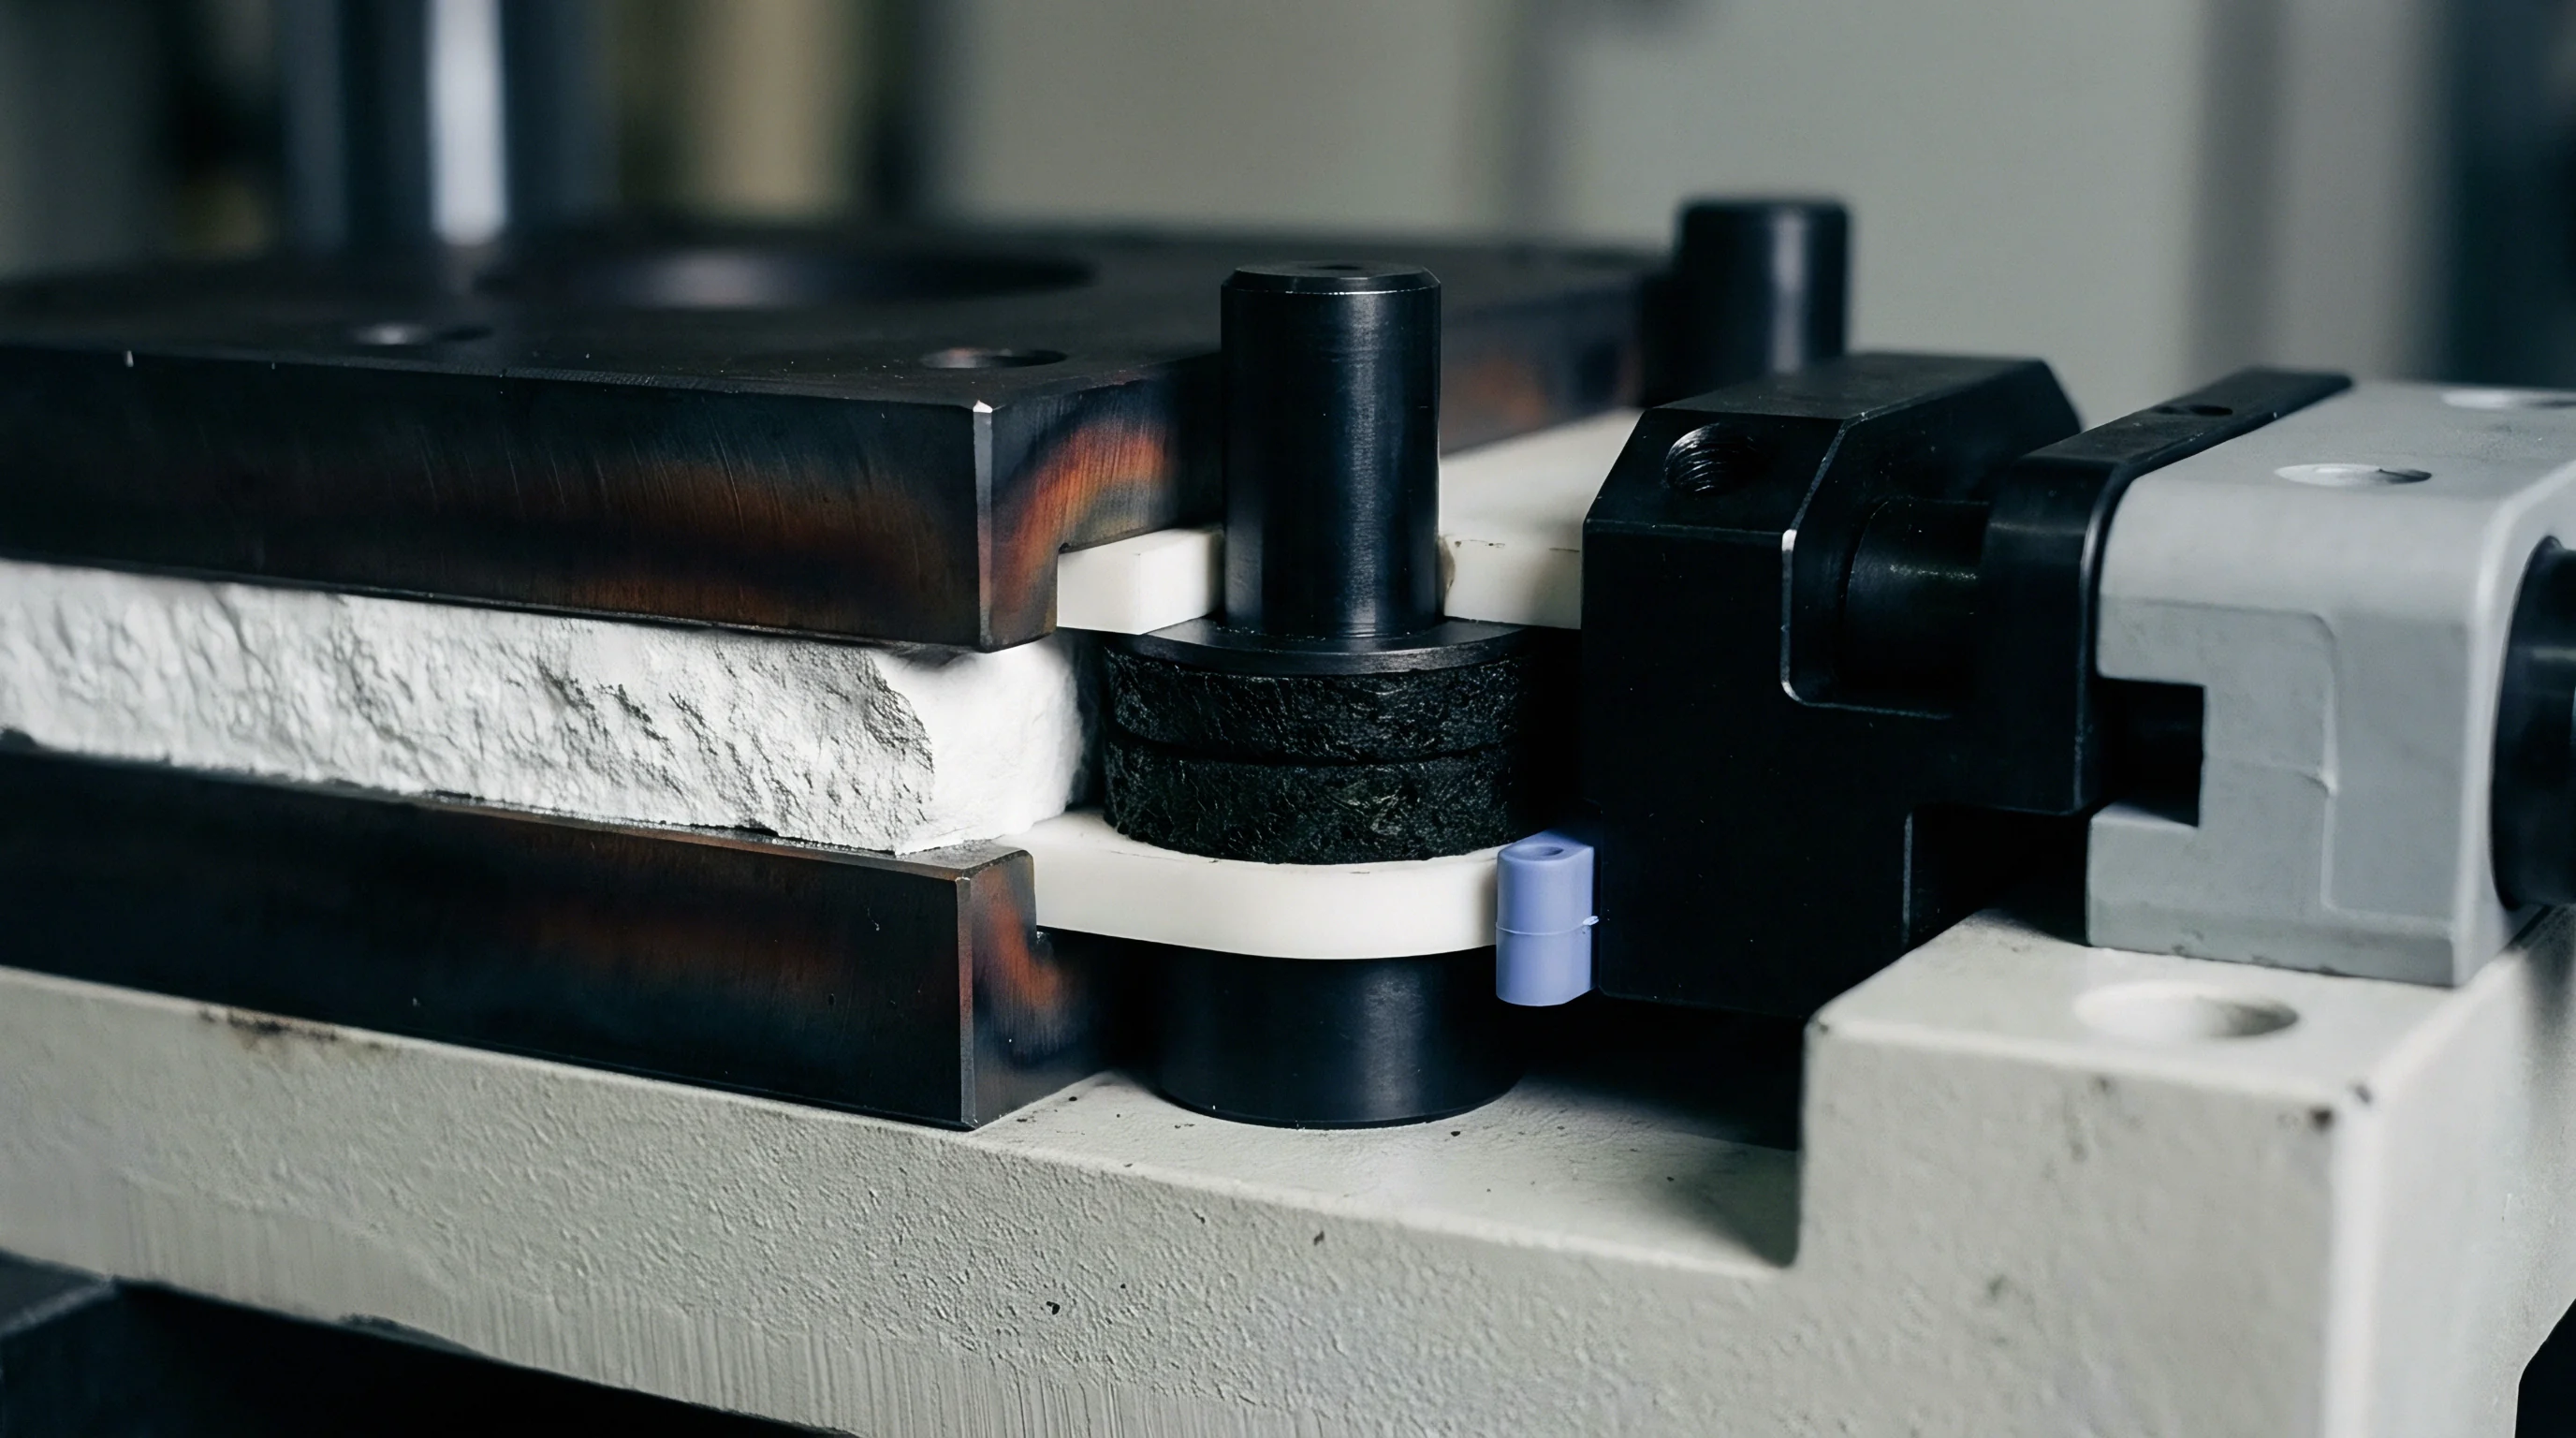
Exceeding critical shear stresses around 0.15 MPa at the die wall triggers periodic stick-slip behavior that distorts the pipe surface. Wall slip happens when long polymer chains disentangle from the metal interface along the die land. Pseudoplastic compounds with broad relaxation time distributions show early wall slip, shifting flow from a parabolic profile toward plug flow.
At a shear rate of 100 s⁻¹ and 190 °C, a 15 percent drop in viscosity increases pipe wall eccentricity beyond allowable ISO 4427 tolerances.
While wall slip lowers total pressure drop across the die, it ruins surface finish. Melt fracture starts as a subtle loss of surface gloss and worsens into periodic sharkskin ridges when die shear rates pass critical thresholds. Shipments with poor shear thinning hit these stress limits at lower output speeds, capping overall line throughput.
Ignoring non-linear melt elasticity during die sizing leaves operators constantly adjusting vacuum tank calibration, driving up scrap rates and dimensional rejections on thick-wall runs.


Bench
Routine material inspection at pipe plants relies heavily on single-point melt flow rate tests under fixed loads. Testing under ISO 1133 typically uses 190 °C with 5 kg or 21.6 kg loads. While quick, these tests miss non-linear flow behavior at industrial shear rates.
A single melt index number blends low-shear and high-shear behavior into one value, masking real differences in shear thinning between incoming resin lots.
Proper characterization takes dynamic mechanical analysis and capillary rheometry across broad shear ranges. Oscillatory shear measures complex viscosity, storage modulus, and loss modulus from 0.01 rad/s to 500 rad/s. Capillary rheometry extends data into production regimes up to 10,000 s⁻¹, reproducing the shear stresses generated inside extruder die channels.
Polymer chains align under high shear, and high-shear viscosity dictates barrel pressure. Catching structural variations on laboratory test benches requires test protocols that separate low-shear melt strength from high-shear thinning performance.

Melt Flow Rate Limits under ISO 1133 Standards
Testing compound lots at 190 °C with a 5 kg or 21.6 kg mass gives a rough gauge of average molecular weight, but hides variations in high-shear processing. The Melt Flow Ratio ~ MFR (21.6 kg) divided by MFR (5 kg) ~ is often used as a quick indicator of molecular weight distribution width. For example, a lot with an MFR (5 kg) of 0.25 g/10 min and an MFR (21.6 kg) of 9.0 g/10 min yields a flow ratio of 36.
This ratio is far too crude to detect subtle shifts in the ultra-high-molecular-weight tail. Two bimodal compounds can show identical flow ratios yet have completely different apparent viscosities at a shear rate of 500 s⁻¹. Relying solely on ISO 1133 melt index approval allows off-spec resin shipments to pass receiving inspection, pushing process instability straight onto the factory floor.

Does Capillary Rheometry Superiorly Isolate High Shear Viscosity Drops?
Small-strain oscillatory testing operates within linear viscoelastic limits, while pressure-driven capillary rheometry captures high-rate non-linear flow. Capillary units force molten polymer through tungsten carbide dies with length-to-diameter ratios from 10:1 to 30:1. Measuring pressure drop across the capillary die allows precise calculation of wall shear stress and apparent shear rate.
Capillary rheometry resolves non-linear behavior clearly. Applying Bagley corrections removes entrance and exit pressure drops, while Rabinowitsch corrections adjust shear rates for non-Newtonian velocity profiles. High-pressure capillary testing pinpoints shear thinning discrepancies early, flagging lots with early thinning or excessive resistance before material hits production lines.

Zero Shear Extrapolation and Cox-Merz Rule Validity
The empirical equivalence between dynamic angular frequency and steady shear rate breaks down in broad polydispersity polyethylenes because of complex molecular alignment. The Cox-Merz rule assumes dynamic complex viscosity at frequency ω equals steady shear viscosity at shear rate γ. In bimodal PE100 resins with dense chain entanglements, this rule breaks down above 10 rad/s.
Variations in molecular structure cause unpredictable departures from Cox-Merz predictions. Resins with broader high-molecular-weight tails show lower steady shear viscosity than dynamic measurements predict, driven by strain-induced disentanglement. Quality control procedures need empirical correction factors when using lab oscillatory data to estimate die pressure drops.
To establish reliable incoming material verification on laboratory test benches, quality control teams implement a standardized capillary rheometry testing sequence:
- Dry compound samples in a vacuum oven at 80 °C for four hours to remove surface moisture prior to heating.
- Pack molten resin into the rheometer barrel at 190 °C using standardized rods to eliminate air pockets.
- Hold the sample for six minutes to ensure complete melting and uniform temperature throughout the barrel.
- Drive the piston at set speeds to record pressure drops across three capillary dies with different length-to-diameter ratios.
- Apply Bagley corrections to separate true wall shear stress from entrance pressure losses.
- Calculate corrected shear rates using Rabinowitsch factors derived from the log flow curve slopes.
- Plot corrected apparent viscosity against shear rate to build non-linear flow curves for direct lot comparison.
Evaluating rheological test techniques requires understanding their explicit shear rate boundaries, target diagnostic outputs, and technical limitations. Table 2 compares four standard laboratory methods used to evaluate pipe compounds.
| Test Method | Standard Reference | Shear Rate / Frequency Range | Primary Diagnostic Output | Sensitivity to MWD Tail |
|---|---|---|---|---|
| Melt Mass-Flow Rate (MFR) | ISO 1133-1 / ASTM D1238 | 1 s⁻¹ to 10 s⁻¹ (static load) | Single-point melt index (g/10 min) | Low |
| High-Load Melt Index (HLMI) | ISO 1133-2 Condition G | 10 s⁻¹ to 50 s⁻¹ (21.6 kg) | High-load flow index (g/10 min) | Moderate |
| Dynamic Oscillatory Shear | ISO 6721-10 / ASTM D4440 | 0.01 rad/s to 500 rad/s | η₀, Storage G’, Loss G” Moduli | Very High |
| Capillary Rheometry | ISO 3835 / ASTM D3835 | 10 s⁻¹ to 10,000 s⁻¹ | Apparent Viscosity, Wall Slip, Swell | High |
| Summary of testing protocols utilized for incoming quality verification and structural compound profiling in pipe manufacturing plants. | ||||
Incorporating mandatory dynamic strain sweep testing under ISO 6721-10 into material delivery specifications forces suppliers to guarantee zero-shear viscosity ranges prior to shipment.

Discharge
Resin producers deliver bimodal polyethylene in bulk railcars or sealed octabins, where lot consistency sets baseline extrusion stability. Pneumatic conveying of bulk pellets causes particle attrition, creating dust and streamers that clog feed hoppers. Transcontinental rail transit also causes physical segregation inside hopper compartments: vibration settles smaller or denser pellets near bottom discharge valves while larger pellets stay near top loading hatches.
Unloading segregated resin directly into storage silos introduces material gradients during extruder feeding. A single railcar often holds batches produced across different reactor runs. When suppliers blend off-spec fluff with wide-spec masterbatches to hit target density, individual pellets end up with distinct differences in shear thinning behavior.
Silo segregation destroys batch consistency. Whether in buried municipal water mains or subsea oil lines where steel pipe uses heavy concrete weight coatings and heat-shrink anti-corrosion sleeves, polymer performance depends on how high-molecular-weight entanglements behave under stress. Catching structural variations during railcar discharge prevents costly processing disruptions downstream.

Silo Stratification and Batch Blending Dynamics
Pneumatic loading into plant silos separates pellets by size and density, creating variations as resin feeds into the extruder. Funnel flow inside tall silos compounds the problem: central core pellets discharge quickly while material along outer walls stays stagnant for long periods. This uneven discharge exaggerates shear thinning shifts between processing runs.
As a result, extruders receive alternating surges of material with different high-molecular-weight fractions. Line controllers try to offset pressure fluctuations by constantly adjusting screw speed. These ongoing speed changes upset melt temperature profiles, making wall thickness control even harder.

Certificate of Analysis Discrepancies and Testing Windows
Certificates of Analysis provided by resin suppliers show melt flow rate and density values recorded hours before final packaging. While the COA confirms a shipment meets basic parameters, it leaves out shear thinning performance entirely. On top of that, supplier sampling often blends multiple reactor lots into a single composite value.
Composite samples hide batch-to-batch variation within individual railcars. High-shear melt viscosity can vary by 14 percent despite identical melt index figures on the COA. An estimated 8 percent variation in high-shear viscosity between top and bottom discharge gates is hard to confirm with full statistical rigor given sparse transfer-line sampling, but the operational impact is clear.
Buyers protect line stability by requiring three-point core sampling across each compartment before unloading into silos.
Incoming Inspection Protocols and Rejection Thresholds
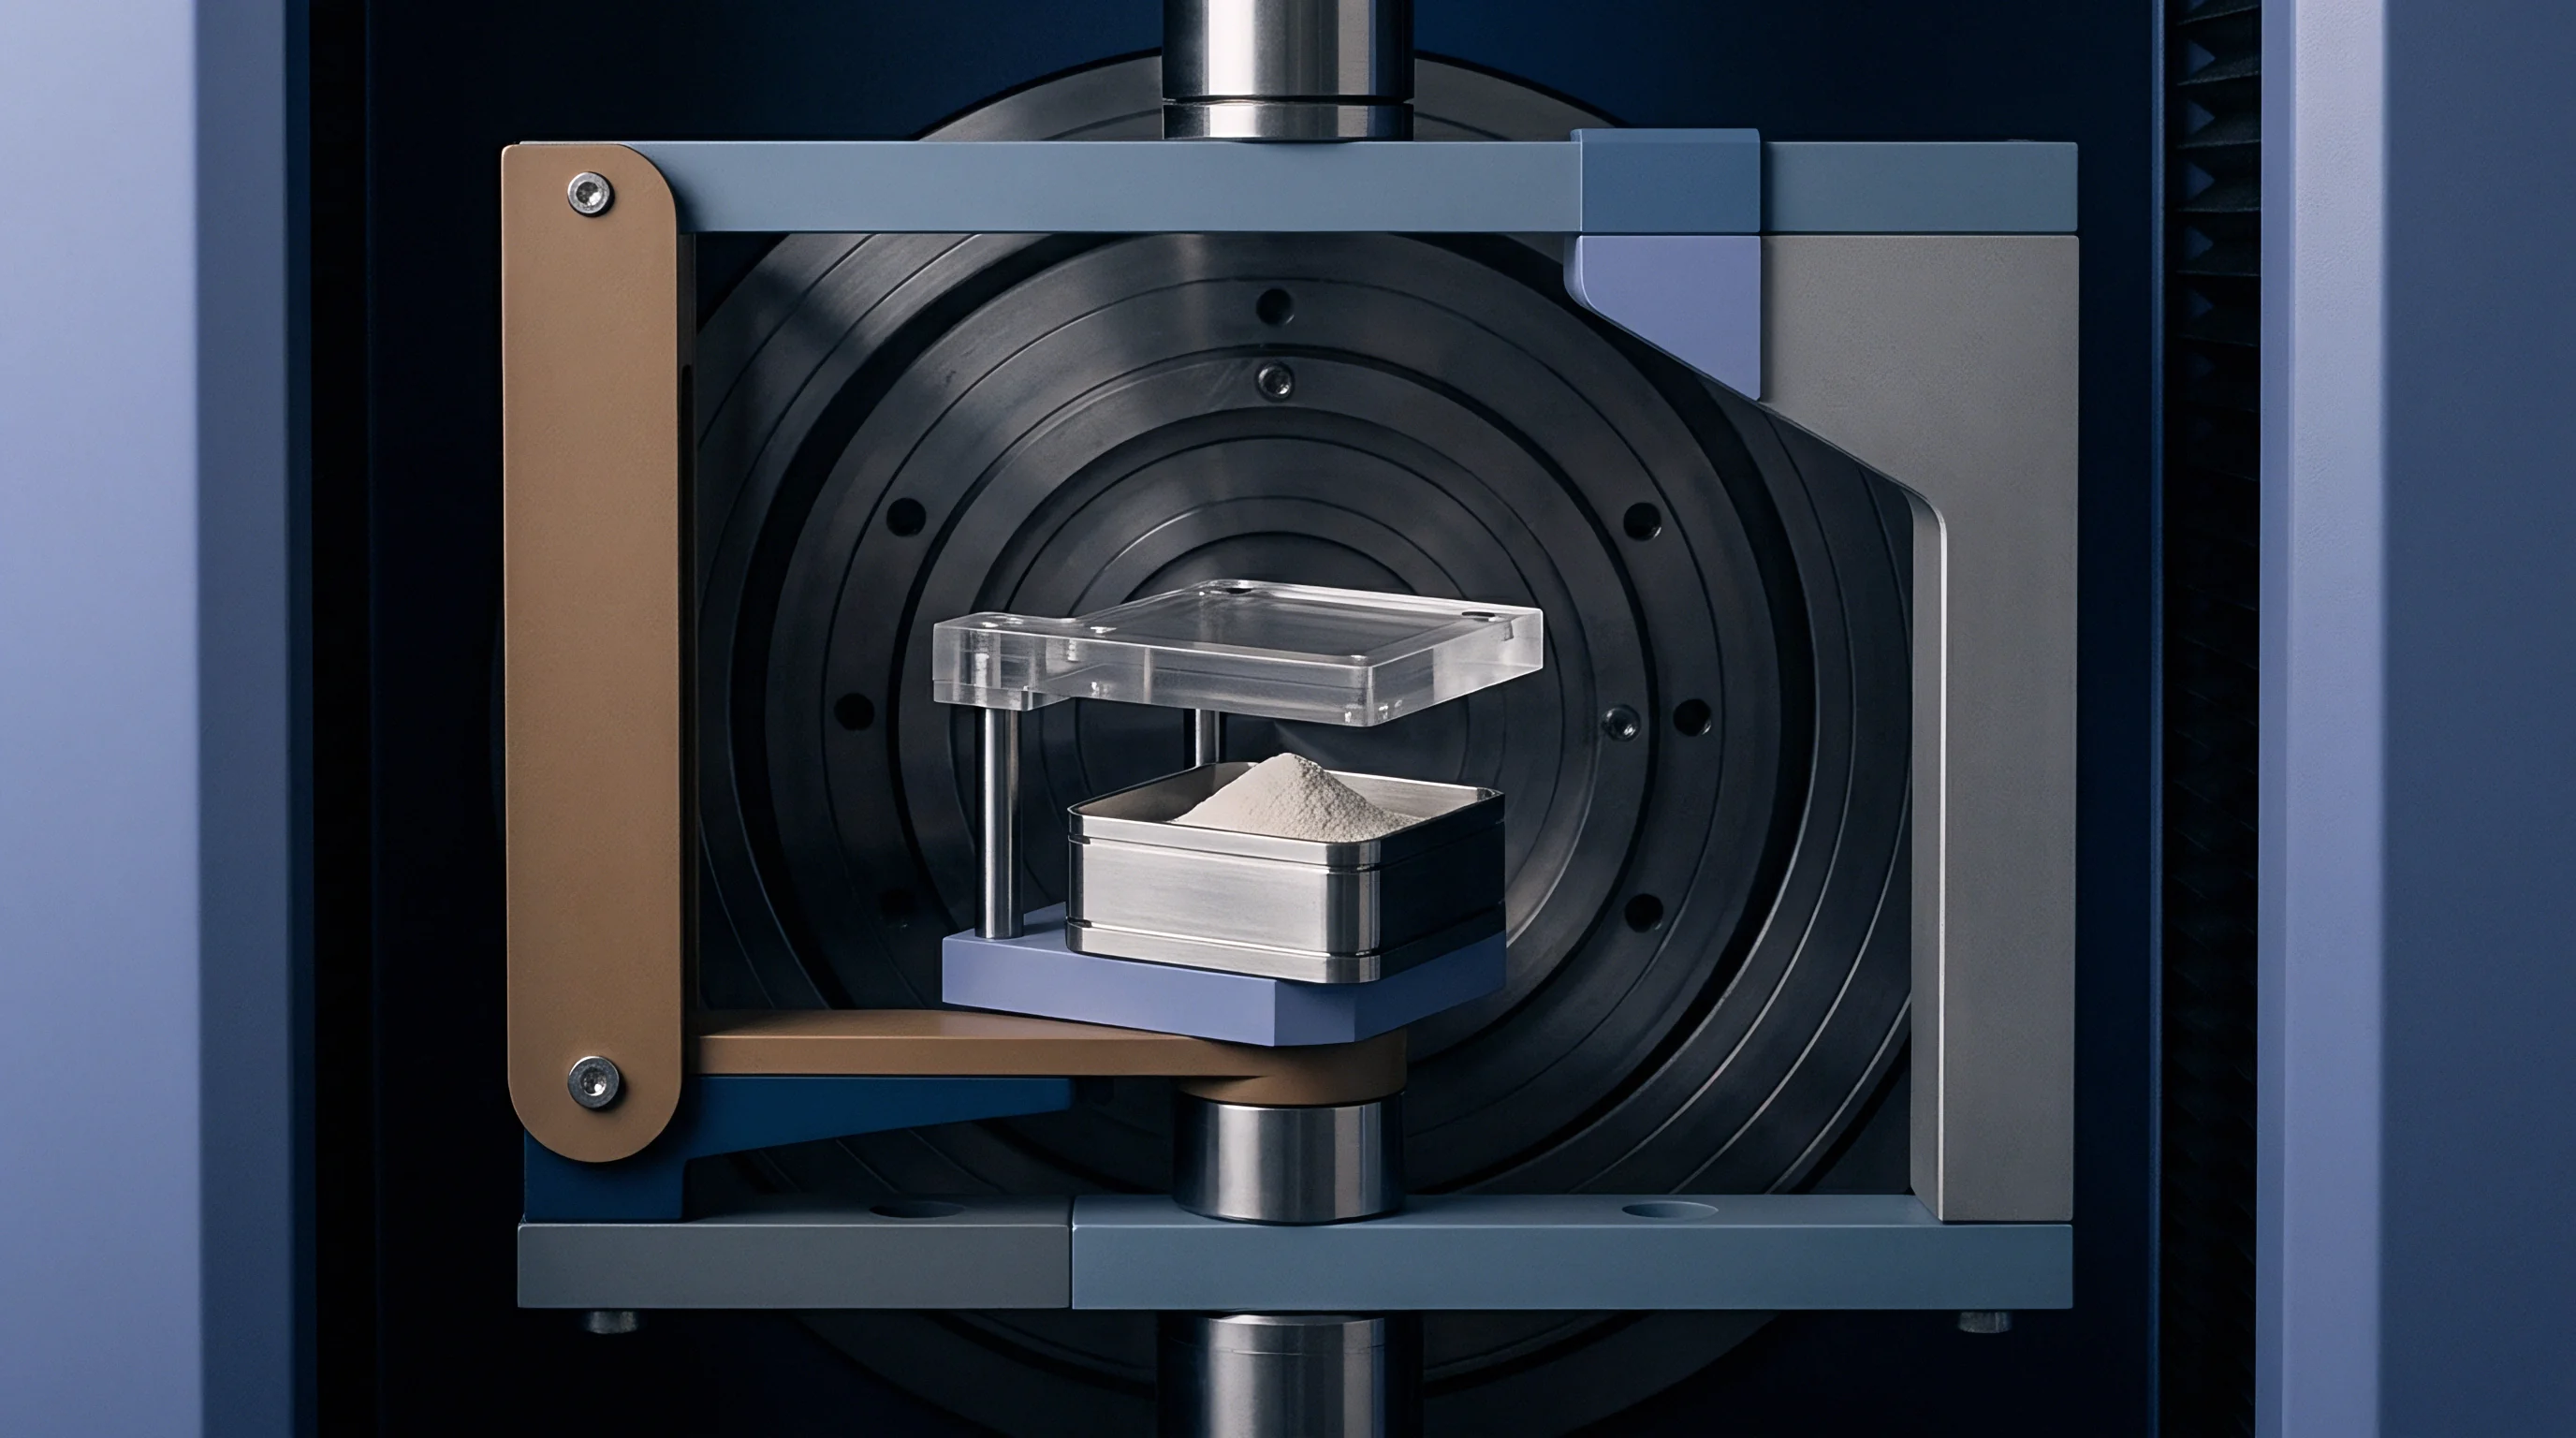
Plant QC teams build rapid screening protocols using high-load melt flow ratios and strain hardening modulus measurements to flag out-of-spec lots early. Strain hardening tests on compression-molded plaques at 80 °C assess the high-molecular-weight network without lengthy melt rheology sweeps. This tensile test measures stress-strain slope past the yield point, directly indicating tie-molecule density.
Batch-to-batch shifts in bimodal molecular weight distribution alter processability long before standard single-point melt flow measurements detect a change.
Linking strain hardening modulus to zero-shear viscosity creates a dependable receiving protocol. If strain hardening values fall below statistical control limits, QC isolates the railcar before unloading, preventing plant-wide inventory contamination.
Evaluating incoming bimodal HDPE compound deliveries requires systematic verification criteria to prevent off-spec processing failures:
- Multi-Zone Sampling Verification requires drawing core samples from top, middle, and bottom discharge compartments of bulk railcars before unloading approval.
- Melt Index Differential Screening compares 5 kg and 21.6 kg flow rates against master lot curves to verify structural molecular weight distribution consistency.
- Solid-State Strain Hardening Analysis evaluates tie-molecule density on compression-molded plaque samples to confirm slow crack growth performance limits.
- Dynamic Sweep Verification verifies that complex viscosity values at 0.1 rad/s and 100 rad/s remain within agreed contractual bands.
- Thermal History Profiling measures oxidation induction time under ISO 11357-6 to confirm stabilizer package integrity after heat processing cycles.
How long incoming inspection labs can maintain high-frequency rheological sweep testing without delaying railcar unloading cycles remains an operational challenge for high-volume extrusion plants.


Ledger
Variations in shear thinning directly hit plant profitability through reduced line output and material overweighting. Pipe extrusion lines run within tight tolerance bands set by water and gas standards. When a batch lacks adequate shear thinning, die head pressure climbs, forcing operators to slow down screw speed to prevent motor overload or polymer degradation.
Slowing screw speed cuts pipe output per hour, driving up fixed overhead costs per meter. Conversely, when resin thinning is too aggressive, melt strength collapses. That triggers gravitational sag, forcing operators to boost wall thickness settings.
Over-gauging pipe walls to meet minimum thickness rules consumes extra resin, eating away profit margins on long-term contracts.
Material giveaway eats margins while tight tolerances preserve line speed. Calculating the exact financial loss from shear thinning variations requires tracking power consumption, resin usage, and scrap generation across production runs.

Extruder Line Energy and Drive Power Consumption
Shifts in melt resistance at processing shear rates cause head pressure variations that alter power consumption per kilogram. Main drives work harder to turn high-torque screws against resistant polymer melt. When a resin lot shows elevated apparent viscosity at die shear rates, motor current climbs right along with it.
Specific energy consumption (kWh/kg) jumps when processing poorly thinning material. Extruders with 450 kW drives can see power draws jump by up to 45 kW when switching between resin lots that share the same nominal melt flow rate but differ in high-shear viscosity. That extra energy draw increases utility bills while accelerating mechanical wear on thrust bearings and gearboxes.

Wall Thickness Over-Gauging and Material Giveaway
To guarantee burst pressure compliance under utility standards, operators adjust target output when melt behavior changes. ISO 4427 sets strict minimum wall thickness limits for each pressure class but puts no cap on maximum thickness, provided ovality limits are met. To avoid producing thin-wall pipe when flow properties drift, line operators intentionally over-gauge target wall thickness by 3 to 5 percent above minimums.
Material giveaway adds up fast on major infrastructure jobs. The baseline estimate of 1.8 percent over-gauging is based on a 500 mm SDR 11 line running at 850 kg/h with annual resin consumption of 6,000 tonnes, using 2023 Eurozone energy and resin spot prices. A drop in energy rates below 0.08 Euro per kWh or resin prices under 1,100 Euro per tonne shifts this baseline.
Extra wall thickness adds unrecoverable material cost to every meter produced.

Scrap Generation Rates and Thermal History Degradation
Purging off-spec melt during line adjustments generates degraded purge scrap that cannot be reused in pressure pipe. Rheological shifts between resin lots cause dimensional hunting, as line speed controllers continually hunt for stable wall thickness. Pipe produced during these transition periods fails ultrasonic wall thickness checks and gets rejected.
Incorporating an explicit high-shear viscosity tolerance window into the ISO 4427 compound purchase specification eliminates uncompensated material rejections at incoming inspection.
Scrap pipe must be shredded and reground for non-pressure products or sold to recyclers at a steep discount. Regrinding bimodal polyethylene breaks ultra-high-molecular-weight chains, destroying original strain hardening properties and rendering the material unfit for pressure pipe lines.
Financial loss metrics scale rapidly when processing unstable bimodal compound shipments on high-capacity extrusion lines. Table 3 illustrates a financial impact model for a 1200 mm SDR 11 pipe production line operating at 1,200 kg/h throughput.
| Operational Variable | Baseline Compound (Nominal Rheology) | High-Viscosity Lot (Reduced Shear Thinning) | Low-Viscosity Lot (Excessive Sag) | Financial Net Variance |
|---|---|---|---|---|
| Extrusion Output Speed (kg/h) | 1,200 | 1,080 (-10%) | 1,200 (0%) | -120 kg/h lost production output |
| Specific Energy Consumption (kWh/kg) | 0.24 | 0.28 (+16.7%) | 0.23 (-4.2%) | +0.04 kWh/kg added power cost |
| Target Wall Thickness Setting (mm) | 109.1 (nominal) | 109.1 (nominal) | 113.5 (+4.0%) | +4.4 mm material giveaway |
| Annual Resin Cost Impact (€) | Base Line (€1,350/t) | +€48,000 (overhead load) | +€155,520 (resin weight) | +€155,520 direct resin loss |
| Scrap Generation Rate (%) | 1.2% | 3.5% (+2.3%) | 4.8% (+3.6%) | +€78,000 scrap downgrade value |
Procurement teams implement standardized financial adjustment models to recover operational losses caused by off-spec resin shipments:
- Document baseline line speed, barrel pressure, and power consumption benchmarks using reference master compound batches.
- Record real-time extrusion data during processing of disputed compound shipments, capturing pressure spikes and line speed reductions.
- Calculate total material giveaway costs by measuring average pipe weight per meter against theoretical design mass.
- Quantify added electrical utility charges by comparing drive motor kWh per kilogram logged during disputed processing runs.
- Submit formal commercial claim documentation requesting raw material price credit equal to calculated operational loss totals.
Procuring resin based solely on low nominal price per tonne guarantees higher operational expenditure through increased drive power consumption and unavoidable wall thickness over-gauging.


Dispute
Commercial supply contracts for bimodal polyethylene rely on technical datasheets that often leave out non-linear rheological parameters. Contracts typically define melt flow rate, density, carbon black content, and tensile yield strength while leaving high-shear viscosity unmentioned. When a shipment causes severe line instability, resin suppliers defend product quality simply by showing compliance with those basic datasheet values.
Resolving disputes over shear thinning variations requires legally binding specifications that include explicit rheological limits. Procurement contracts need to look beyond ISO 1133 single-point tests and set clear dynamic shear viscosity limits, zero-shear boundaries, and strain hardening thresholds. Putting these metrics in supply agreements removes ambiguity and gives buyers recourse when resin underperforms on the line.
Clear contract clauses prevent unexpected material shifts and hold suppliers accountable. Protecting extrusion economics takes precise technical terms that tie material acceptance directly to performance under real die shear rates.

ISO 4427 and ISO 4437 Standard Compliance Clauses
International pipeline standards specify density, carbon black dispersion, thermal stability, and hydrostatic strength, but leave processing shear behavior unaddressed. Standards like ISO 4427-1 and ISO 4437-1 categorize compound grades to ensure a 50-year service life under pressure, but they treat processability as the converter’s problem rather than a standardized resin requirement.
This gap leaves pipe producers exposed when suppliers adjust reactor conditions or catalyst packages. A resin lot can fully satisfy ISO 4427-1 and still be practically unprocessable on a high-speed line. Converters need supplemental rheological specifications in supply contracts to fill the gap.

Drafting Sourcing Specifications for Rheological Tolerance
Procurement teams insert multi-point shear viscosity targets into master contracts to protect operations from unannounced formulation changes. Specifying multi-point shear viscosity bands in purchase agreements ensures compound deliveries match tool design requirements. These contractual specifications set target values and percentage tolerances for complex viscosity at key dynamic frequencies.
A solid sourcing clause sets viscosity limits at low frequency (0.1 rad/s) and high frequency (100 rad/s) at 190 °C under ISO 6721-10. Capping zero-shear viscosity ensures proper flow through the die, while setting a floor on low-frequency viscosity prevents gravity sag during cooling. Having these numbers in the contract gives clear legal grounds for rejection at receiving.

Claim Resolution Procedures and Financial Adjustment Models
Filing commercial claims against resin suppliers takes documented laboratory proof that a lot breached contractual viscosity limits. When processing issues arise on the shop floor, engineers isolate the suspect railcar and draw representative core samples per ISO 11664. Independent accredited labs then run capillary and dynamic shear tests to build a formal non-conformance report.
Claim settlement agreements use clear price adjustment formulas tied to viscosity drift. If a delivered lot falls 5 to 10 percent outside agreed high-shear viscosity limits, the supplier absorbs a mandatory per-tonne discount to cover reduced line speeds. Deviations beyond 10 percent give the buyer full right of rejection, requiring the seller to replace the material and pay all freight and silo cleaning costs.
Setting precise technical parameters for non-Newtonian shear behavior turns subjective processing disputes into enforceable contract terms that protect resin buyers across every shipment.