Coupled Viscoelastic Thermomechanical Modeling of Micro Asperity Interfacial Thermal Gap Resistance Dynamics
Dynamic micro-gap formation drops interfacial heat transfer from 2800 to 240 W/(m²·K), adding unbudgeted cycle seconds unless checked by cavity pressure control.
Steel
Cavity pressure drives molten polymer into intimate contact with microscopic tool steel asperities during the first tenths of a second following injection. At this instant, peak cavity pressure forces the compliant melt into the valleys of the tool surface finish, suppressing the thermal boundary layer and establishing an initial interfacial heat transfer coefficient exceeding 2500 W/(m²·K). As the outer skin solidifies and cools below the glass transition temperature or crystallization window, volumetric contraction initiates.
The holding pressure decays across the pack-and-hold phase, the polymer yields elastically, and the contact points retreat. Microscopic air gaps nucleate within the tool topography valleys, dropping the effective heat transfer coefficient below 400 W/(m²·K) long before part ejection.
Tooling engineers frequently observe significant divergence between mold-filling cooling simulations and actual press cycle times. Standard finite element algorithms assign a static thermal contact resistance or a single step-down conduction value across the cavity boundary. Real production tools behave dynamically.
The polymer skin exhibits time-dependent viscoelastic relaxation under falling holding pressure, causing the true micro-contact area to contract continuously. Tool steel selection governs this mechanical interface through thermal effusivity and machining texture.
Tool steels exhibit distinct thermal conductivity values that dictate local heat extraction rates and temperature gradients at the asperity tips. High-conductivity mold materials pull heat from the polymer boundary rapidly, freezing the resin skin under higher local cavity pressure and preserving deeper micro-asperity penetration.
| Tool Steel Grade | Thermal Conductivity (W/m·K) | Hardness (HRC) | Standard SPI Finish Class | Arithmetic Mean Roughness Ra (µm) | Mean Peak Height Rz (µm) |
|---|---|---|---|---|---|
| 1.2343 (AISI H11) ESR | 29.5 | 48 to 52 | A-2 Diamond Polish | 0.03 to 0.05 | 0.20 to 0.35 |
| 1.2344 (AISI H13) Premium | 28.3 | 46 to 50 | A-3 Diamond Polish | 0.06 to 0.10 | 0.40 to 0.70 |
| 1.2083 (AISI 420) Stainless | 19.8 | 50 to 54 | B-1 Paper Polish | 0.12 to 0.20 | 0.80 to 1.40 |
| 1.2738 (P20+Ni) Prehardened | 33.5 | 30 to 34 | B-3 Paper Polish | 0.30 to 0.45 | 1.80 to 2.80 |
| Moldmax HH (Beryllium Copper) | 130.0 | 38 to 42 | A-1 Mirror Buff | 0.01 to 0.02 | 0.08 to 0.15 |
Asperity contact mechanics under transient solidification depend on the interaction between steel surface topography and the melt rheology. When the mold surface presents an electrical discharge machining texture, peak-to-valley distances exceed five micrometers. These peaks support the initial clamping and cavity loads over a minimal real contact area, amplifying local mechanical contact stresses.
In contrast, diamond-polished tool cavities distribute contact forces across wide plateaus, enabling immediate conduction across ninety percent of the nominal interfacial area during filling.
Prehardened 1.2738 tooling running an unpolished electrical discharge finish generates interfacial thermal gap resistances 4.2 times higher than diamond-buffed 1.2343 under identical 60 MPa packing conditions.
Melt-path freezing fixes the initial replication state. If the tool room cuts the cavity from stainless 1.2083 to resist corrosive flame-retardant off-gassing, the low thermal conductivity of the tool steel delays skin formation, permitting greater depth of asperity replication before the resin solidifies. The setter faces an immediate trade-off: deeper penetration into the tool texture increases early heat transfer, yet mechanically anchors the cooling polymer skin, causing severe shear stresses during mold opening.
Sourcing managers paying for multi-cavity tooling without defined tool steel and polishing standards discover that parts reject due to uneven thermal witness marks across cavities, directly inflating cycle times and rejecting lots on dimensional stability audits.

Relaxation
Polymer melt behaves as a non-linear viscoelastic fluid during mold filling and transitions into an amorphous or semi-crystalline viscoelastic solid during cooling. The microscopic contact profile between the polymer skin and the metallic tool asperities changes continuously as a function of time, local temperature, and instantaneous contact pressure. True contact area never reaches one hundred percent of the nominal mold surface.
Contact mechanics at this scale mirror Greenwood-Williamson rough surface models, modified by time-temperature superposition via Williams-Landel-Ferry (WLF) formulations or Arrhenius shifts.

What Governs True Contact Area under Cavity Pressure?
Applied cavity pressure flattens molten polymer peaks against hard steel asperities through instantaneous viscous flow and retarded elastic deformation. The generalized Maxwell model captures this stress relaxation across multiple discrete relaxation times. As packing pressure drops during screw decompression and gate freeze, the compressed polymer skin experiences elastic recovery while simultaneously undergoing volumetric thermal shrinkage.
Micro-voids appear around the flanks of the steel asperities.
Polymer chains lose mobility rapidly as the interfacial layer cools toward the glass transition temperature. The relaxation modulus shifts over several orders of magnitude within fractions of a second. Cavity pressure decay accelerates the detachment process.
- Viscous penetration occurs under peak packing pressure between 50 and 120 MPa, forcing the polymer melt into tool steel grinding grooves and polishing furrows.
- Skin vitrification locks the replicated micro-topography against the tool steel face while the core remains molten. Local shear stresses reach peak values.
- Hydrostatic decompression begins once the runner gate freezes, cutting the cavity off from machine cushion replenishment and initiating bulk isotropic contraction.
- Interfacial void nucleation takes place at microscopic valley bottoms where local tensile stress exceeds polymer-steel adhesive affinity.
- Asperity detachment propagates across the nominal surface area, leaving isolated mechanical contact spots surrounded by stagnant gas pockets.
The reduction in fractional contact area alters the boundary resistance profile. Heat transfer across the contact zones occurs via solid-state conduction through the asperities, while heat transfer across the non-contact zones relies on conduction through the trapped gas film and radiative emission across the microscopic gap.
| Resin Designation | Base Polymer Type | Glass Transition Tg (°C) | WLF C1 Parameter | WLF C2 Parameter (K) | Linear Thermal Shrinkage Parallel (%) | Linear Thermal Shrinkage Perpendicular (%) |
|---|---|---|---|---|---|---|
| PA66 GF30 | Polyamide 66 30% Glass | 65 | 12.8 | 52.4 | 0.30 to 0.50 | 0.70 to 1.10 |
| PBT 20% Mineral | Polybutylene Terephthalate | 45 | 15.2 | 48.1 | 0.80 to 1.20 | 1.10 to 1.50 |
| PC/ABS Blend | Polycarbonate / ABS | 125 | 17.4 | 51.6 | 0.50 to 0.70 | 0.55 to 0.75 |
| POM Copolymer | Polyoxymethylene | -60 | 9.6 | 38.7 | 1.80 to 2.20 | 1.80 to 2.20 |
| PPS 40% Glass | Polyphenylene Sulfide | 90 | 11.4 | 45.3 | 0.20 to 0.40 | 0.60 to 0.90 |
Glass fibers and mineral fillers introduce mechanical anisotropy into the viscoelastic response. In a thirty percent glass-filled polyamide, fibers orient along the flow direction at the mold skin, suppressing shrinkage parallel to the melt stream. Transverse shrinkage remains dominated by the unreinforced matrix, pulling the polymer body away from asperity flanks perpendicular to flow.
This directional contraction breaks contact along specific asperity faces while maintaining contact along parallel ridges, creating directional thermal resistance across the cavity wall.
Contact area loss accelerates the moment cavity pressure falls below the threshold required to hold the relaxing skin against the tool steel texture.
Internal stress accumulation tracks the evolution of contact area. When holding pressure drops prematurely before the skin develops sufficient mechanical rigidity, the hot core pulls the solidified shell inward, producing macro-scale sink marks and micro-scale interfacial voiding simultaneously. Tool setters running high-cavitation family tools observe this phenomenon when cavity pressure profiles diverge across distinct part geometries.
Predictable micro-gap formation demands consistent cavity pressure dwell above the resin-specific relaxation threshold throughout skin formation.

Flux
Heat flux through the mold-polymer interface governs the cooling trajectory, final part crystallinity, and cycle efficiency. Total interfacial thermal gap resistance combines the mechanical contact resistance across steel-polymer micro-asperity junctions with the parallel conduction path through the microscopic gas gaps. Fourier conduction across the boundary treats this as a dynamic interface conductance coefficient, denoted as h_int.
Solid-solid micro-contact points conduct heat effectively because the thermal conductivity of solid polymer ranges from 0.18 to 0.35 W/(m·K), whereas the trapped gas within the microscopic valleys presents a thermal conductivity between 0.026 and 0.040 W/(m·K).

Does Viscoelastic Relaxation Dominate Heat Transfer Rates?
Thermal contact conductance couples tightly with local displacement and pressure fields. As the true fractional contact area drops from ninety percent down to twenty percent during solidification, overall interfacial resistance surges. Numerical simulations must couple the mechanical equation of motion with the transient energy equation to capture this change.
A coupled mechanical-thermal model computes the instantaneous heat flux q_int using the temperature drop between the polymer skin and the tool cavity surface.
q_int = h_int(t) · (T_skin – T_mold)
The dynamic heat transfer coefficient h_int integrates mechanical and fluid conduction terms.
h_int(t) = (A_c(t) / A_nom) · h_contact + (1 – (A_c(t) / A_nom)) · (k_gas / delta_gap(t))
A_c(t) represents the actual micro-asperity contact area at time t, A_nom defines the nominal surface area, h_contact is the solid-solid conductance, k_gas is the thermal conductivity of the entrapped gas, and delta_gap(t) represents the instantaneous physical micro-gap width calculated from viscoelastic creep and thermal contraction.
Consider an injection tool producing a flat automotive connector shroud in unreinforced polybutylene terephthalate with a nominal wall thickness of 1.50 mm. The cavity features a baseline mold temperature of 80 °C and an initial melt injection temperature of 250 °C. At initial fill, peak cavity pressure reaches 75 MPa, yielding an initial contact area ratio of 0.88 and an initial interfacial heat transfer coefficient of 2800 W/(m²·K). Within 2.8 seconds, packing pressure terminates at the gate, cavity pressure drops to atmospheric level, and thermal contraction opens an average micro-gap of 4.5 µm across eighty percent of the nominal area.
The local interfacial heat transfer coefficient collapses to 310 W/(m²·K).
DIN 16742 tolerance grade TG4 requires stable cavity boundary heat extraction across every molding cycle to prevent core thermal variances from distorting critical pin-pitch dimensions.
Solidification kinetics change when the interfacial resistance spikes. The cooling core becomes insulated by the surrounding low-conductance micro-gap. Heat removal slows down.
The cooling time calculation required to reach ejection temperature must expand significantly compared to baseline simulations utilizing constant heat transfer assumptions. In this 1.50 mm PBT part, assuming an invariant interfacial conductance of 2000 W/(m²·K) yields a predicted cooling time of 6.2 seconds. Accounting for viscoelastic detachment dynamics and the resulting gap resistance surge pushes the required cooling time to 8.7 seconds to achieve equivalent core rigidity.
Omitting dynamic interfacial modeling introduces a 40 percent error in cycle time estimation.
| Phase Timestamp (s) | Cavity Pressure (MPa) | Contact Ratio (A_c / A_nom) | Effective Gap Width delta (µm) | Interfacial Conductance h_int (W/m²·K) | Polymer Skin Temp (°C) | Mid-Plane Core Temp (°C) |
|---|---|---|---|---|---|---|
| 0.10 (End of Fill) | 75.0 | 0.88 | 0.2 | 2800 | 145 | 250 |
| 0.50 (Hold Active) | 62.0 | 0.82 | 0.5 | 2350 | 112 | 242 |
| 1.50 (Hold Active) | 45.0 | 0.65 | 1.2 | 1650 | 96 | 215 |
| 2.80 (Gate Seal) | 8.5 | 0.38 | 2.8 | 680 | 88 | 178 |
| 4.50 (Cooling Free) | 0.1 | 0.18 | 4.5 | 310 | 83 | 136 |
| 8.70 (Part Ejection) | 0.0 | 0.12 | 6.2 | 240 | 81 | 98 |
Crystallization morphology links directly to this transient boundary resistance. Rapid early heat flux quenches the outer polymer skin into an amorphous morphology with fine spherulitic structures. When the thermal resistance jumps as the micro-gap nucleates, the rate of heat removal drops, allowing the subsurface layers to dwell longer within the optimum crystallization temperature band.
As a result, semi-crystalline polymers develop pronounced morphological gradients across the wall cross-section, consisting of an amorphous skin, a fine-grained intermediate shear zone, and a coarse-spherulite core. These structural variations induce differential internal stresses, establishing the root mechanism for post-mold part warpage.
The field remains divided on whether asperity contact detachment during solidification occurs uniformly across local tool surfaces or follows a stochastic nucleation process governed by microscopic steel grain boundaries.
Texture
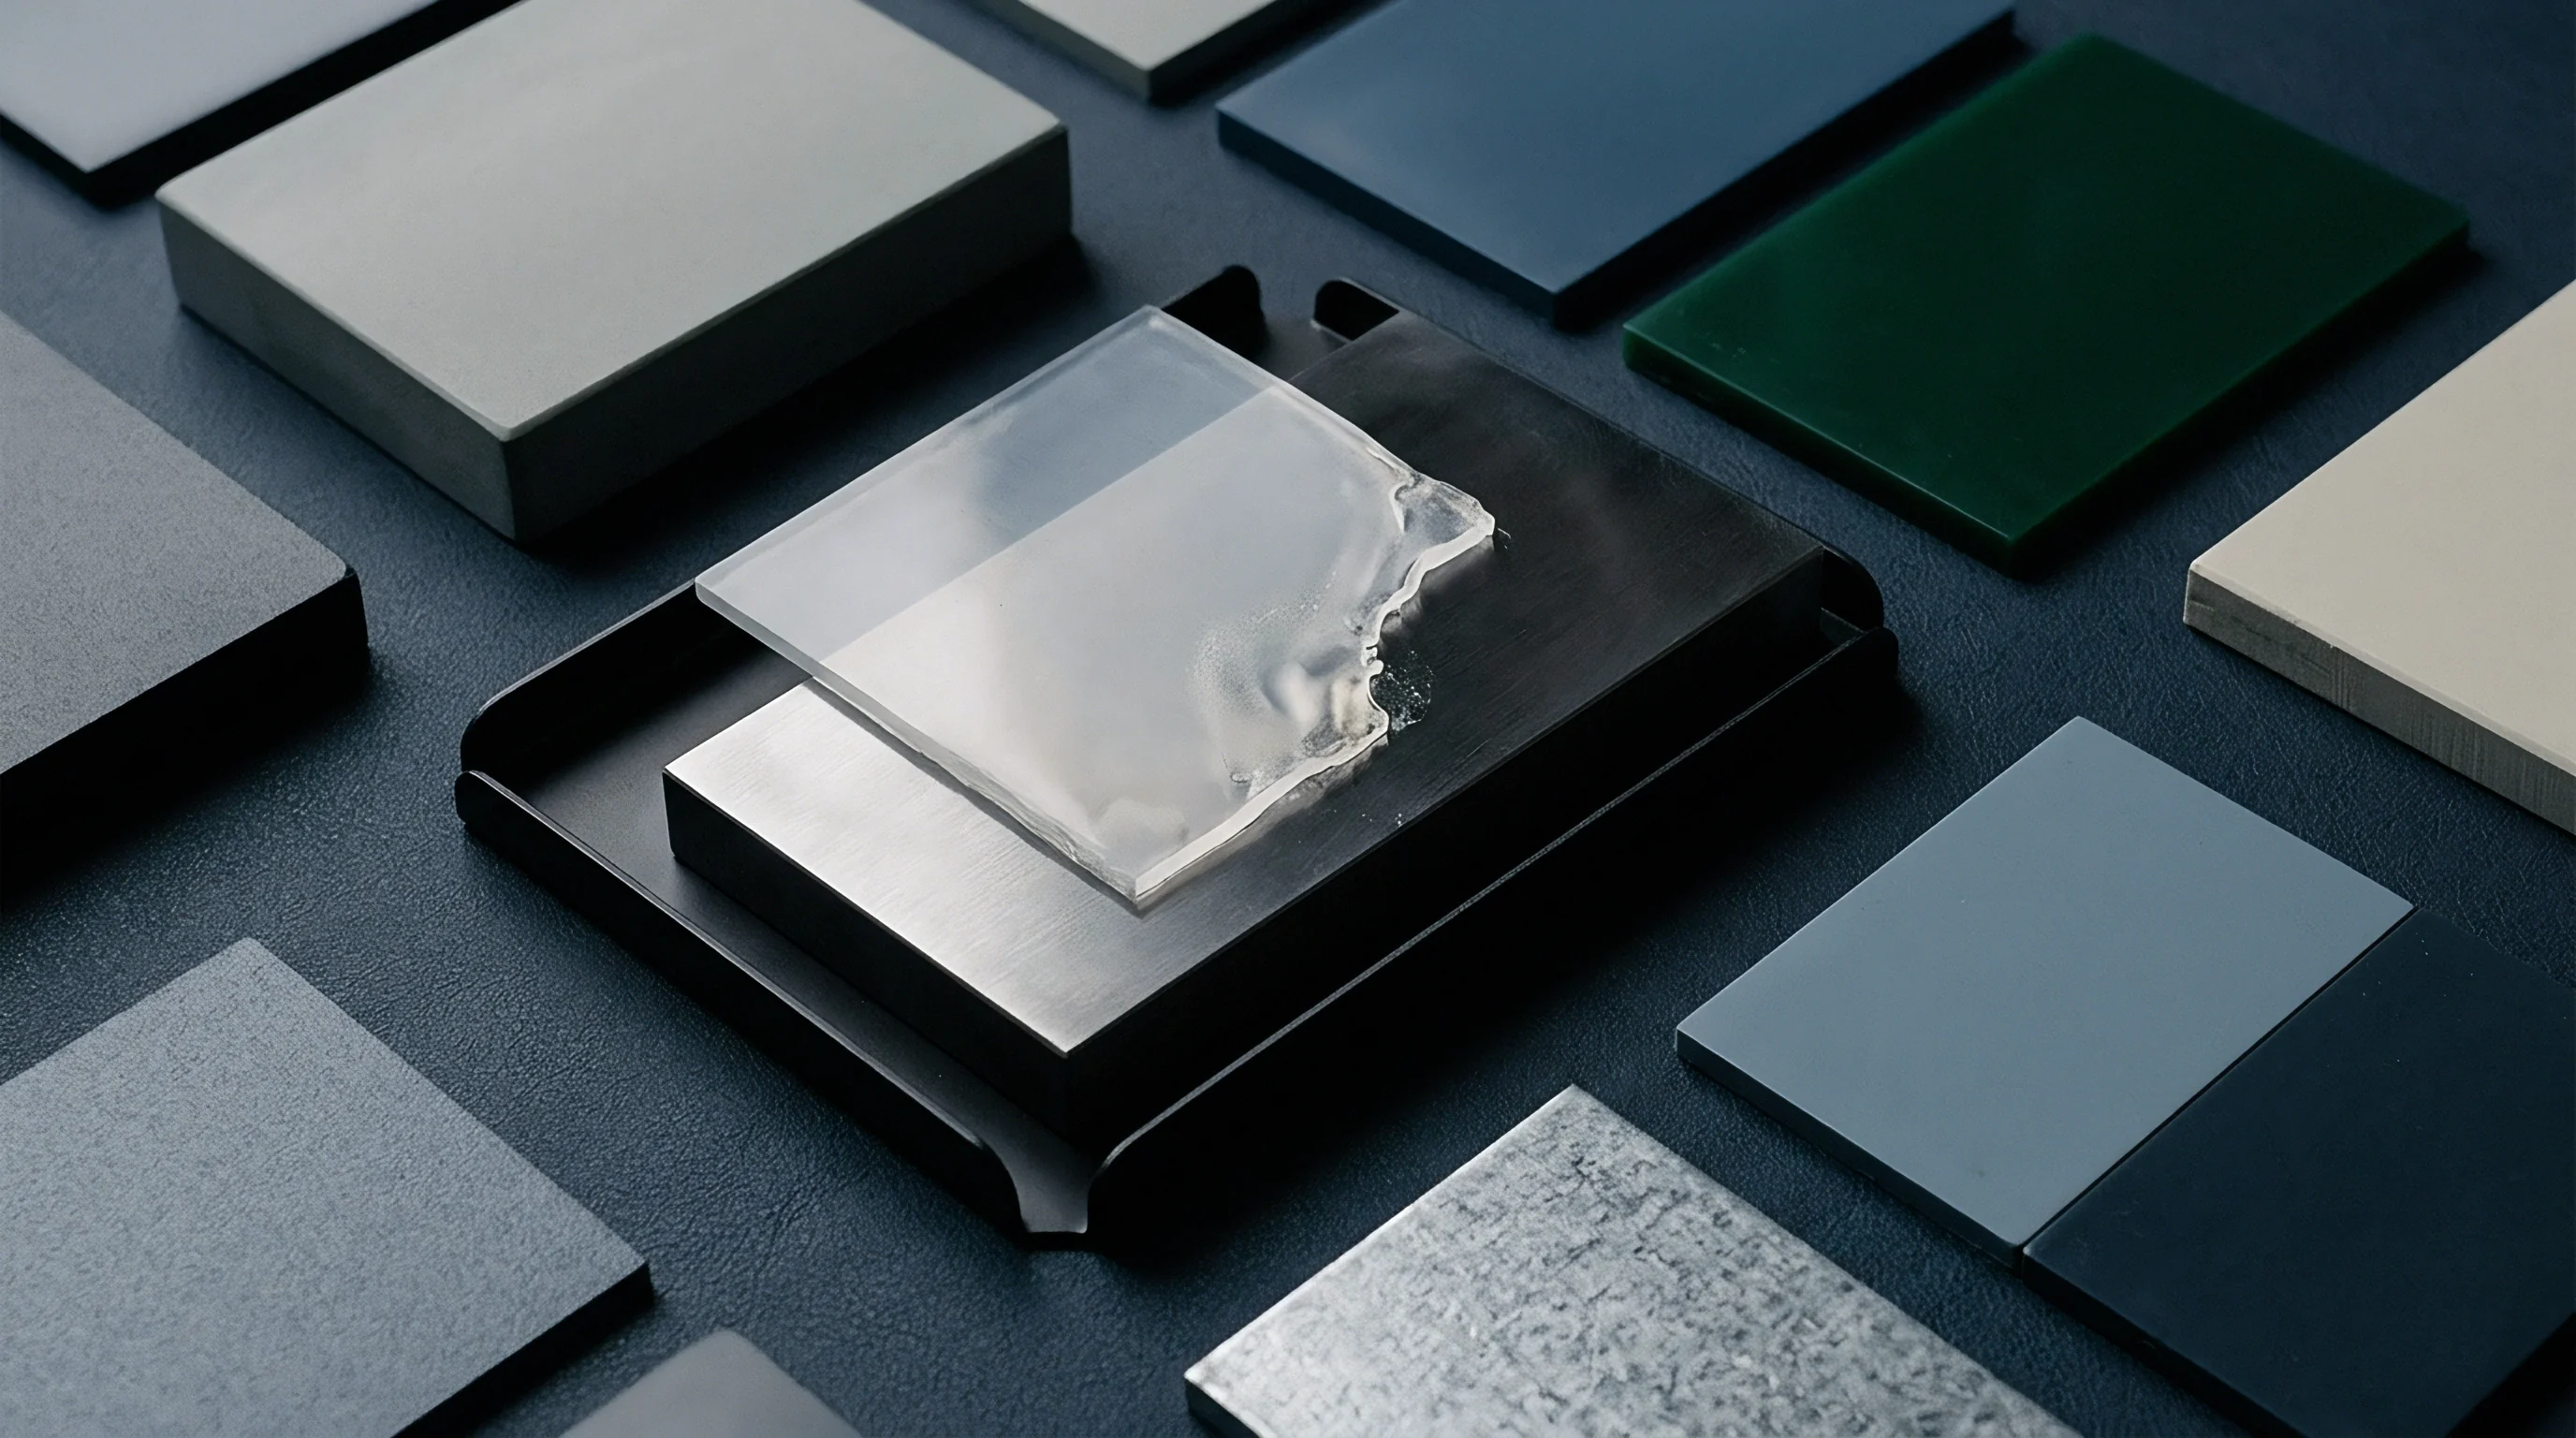
Surface topography specifications dictate the physical boundary conditions of the micro-gap. Tool drawings frequently state a simple Ra average roughness target, ignoring asperity slope, peak density, and valley distribution. In injection tooling, two cavity inserts with an identical Ra of 0.40 µm will exhibit drastically different dynamic contact behaviors if one surface is created by CNC milling and the other by sinker electrical discharge machining.
Electrical discharge machining produces an isotropic, cratered surface characterized by sharp recast rims and deep spherical valleys. Under melt injection, these sharp recast asperities act as stress risers that pierce the advancing polymer melt skin. Diamond-polished surfaces, by contrast, feature broad plateaus with shallow, unidirectional polishing scratches.
The contact mechanics under viscoelastic creep diverge sharply between these two textures.
- Cratered spark erosion creates deep micro-voids that resist complete melt wet-out under normal packing pressures, establishing an immediate permanent air gap before pressure drops.
- Linear polishing furrows permit directional melt flow along machining traces, minimizing void volume and maximizing initial solid contact area.
- High peak density generates severe mechanical anchoring, which resists interfacial air gap expansion until thermal shrinkage forces fracture microscopic polymer asperity tips.
- Low skewness surfaces provide expansive flat plateaus that maintain high contact ratios even after holding pressure drops below ten megapascals.
A toolmaker cutting an optical or low-friction connector housing must balance part ejection forces against interfacial heat transfer requirements. High-gloss finishes produced by SPI A-1 or A-2 diamond paste polishing yield arithmetic roughness values below 0.05 µm. This surface enables rapid initial heat transfer, quenching the skin rapidly.
However, because the resulting micro-gap is extremely thin, vacuum effects and adhesive van der Waals forces spike, raising the required ejection pin force and risking part distortion during press demolding.
Cavity textures finished beyond VDI 3400 scale 24 produce early micro-gap formation that permanently reduces total cooling efficiency by up to twenty-five percent.
Textured visual surfaces manufactured to VDI 3400 standards deliberately induce light scattering to mask sink marks and weld lines. The process implications of these textures are significant. A VDI 27 spark erosion finish carries an Ra of 2.24 µm and an average peak-to-valley height Rz of roughly 9.5 µm.
When filling such a cavity with a high-viscosity polycarbonate blend, the melt cannot fully penetrate into the bottom of the erosion craters at standard injection pressures. Trapped air pockets sit permanently at the bottom of the texture valleys, acting as micro-thermal insulators throughout the entire injection cycle. The mold setter cannot compensate for this insulating layer by merely elevating packing pressure without inducing excessive flash at the parting line.
Tooling suppliers frequently defend non-compliant part cycle times by asserting that textured aesthetic surfaces naturally require longer press cycles due to aesthetic resin dwell requirements.
Expense
Tooling quotations frequently hide the financial impact of interfacial micro-gap dynamics behind standard machine-hour rates and assumed cooling cycles. When a multi-cavity production tool fails to meet quoted cycle times because interfacial thermal resistance was modeled as an idealized static value, the commercial consequences fall entirely on the buyer. Extra cycle seconds compound into thousands of unbudgeted machine hours across volume automotive and consumer electronics production runs.
Consider an operational case study evaluated across annual production volumes. Sourcing teams frequently evaluate tooling proposals using estimated press cycle times provided by the mold builder.
A thirty-two cavity tool running an automotive connector housing in PA66 GF30 operates at a 350-tonne machine-hour rate of eighty-five dollars. The toolmaker quoted the part on an aggressive 14.0-second cycle time, using baseline mold-filling software assumptions with an uncoupled, static interfacial heat transfer coefficient of 2500 W/(m²·K). During first-shot trials and process window establishment at T1, parts exhibit dimensional distortion and core voiding due to incomplete internal cooling.
To achieve the required DIN 16742 dimensional stability across all thirty-two cavities, holding time and cooling dwell must be extended, landing the stable production cycle at 17.5 seconds.
| Operational Cost Parameter | Quoted Cycle Model (Static Interface) | Production Reality (Viscoelastic Gap Dynamics) | Cost Variance Delta |
|---|---|---|---|
| Cycle Time per Shot (s) | 14.0 | 17.5 | +3.5 seconds (+25%) |
| Parts Produced per Hour (32 Cavities) | 8,228 | 6,582 | -1,646 parts/hour |
| Machine Hours for 10M Parts (hrs) | 1,215 | 1,519 | +304 press hours |
| Machine Hourly Rate ($) | 85.00 | 85.00 | 0.00 |
| Annual Machine Processing Cost ($) | 103,275 | 129,115 | +$25,840 / year |
| Tool Amortisation ($220k Capex over 10M Parts) | $0.0220 / part | $0.0220 / part | $0.00 / part |
| Total Conversion Cost per Part ($) | $0.0323 | $0.0349 | +$0.0026 / part |
The unbudgeted 3.5-second cooling delay adds $25,840 in direct machine conversion expenses per ten million parts produced. Across a multi-year program consuming thirty million units, this technical failure extracts over $77,000 in unallocated production expenses, matching more than a third of the original tool construction capital expenditure. If the molder operates twenty tools across a facility, this interfacial gap miscalculation consumes weeks of press capacity, forcing the procurement group to fund duplicate tooling to satisfy production volumes.
Tooling asset management requires explicit verification parameters embedded directly into purchase agreements before cutting mold steel. Sourcing contracts should demand specific thermal contact resistance compliance standards, coupling mold cavity material effusivity, cavity pressure transducer verifications, and surface topography metrics. Buyers protect their landed piece prices by inserting strict cycle-time acceptance clauses tied to DIN 16742 dimensional capability, guaranteeing that thermal miscalculations at the micro-asperity interface remain the financial liability of the toolmaker rather than the production budget.
Production purchase agreements incorporate clauses defining that mold acceptance remains provisional until the tool demonstrates specified Cpk thresholds under the contractually agreed cycle time on production presses.