Predictive Cavity Pressure Decay Modeling for Fiber-Reinforced Semi-Crystalline Polyamide Moldings
Predictive cavity pressure decay modeling optimizes packing profiles and tool dimensions for glass filled polyamides to eliminate sink marks and tight tolerances.


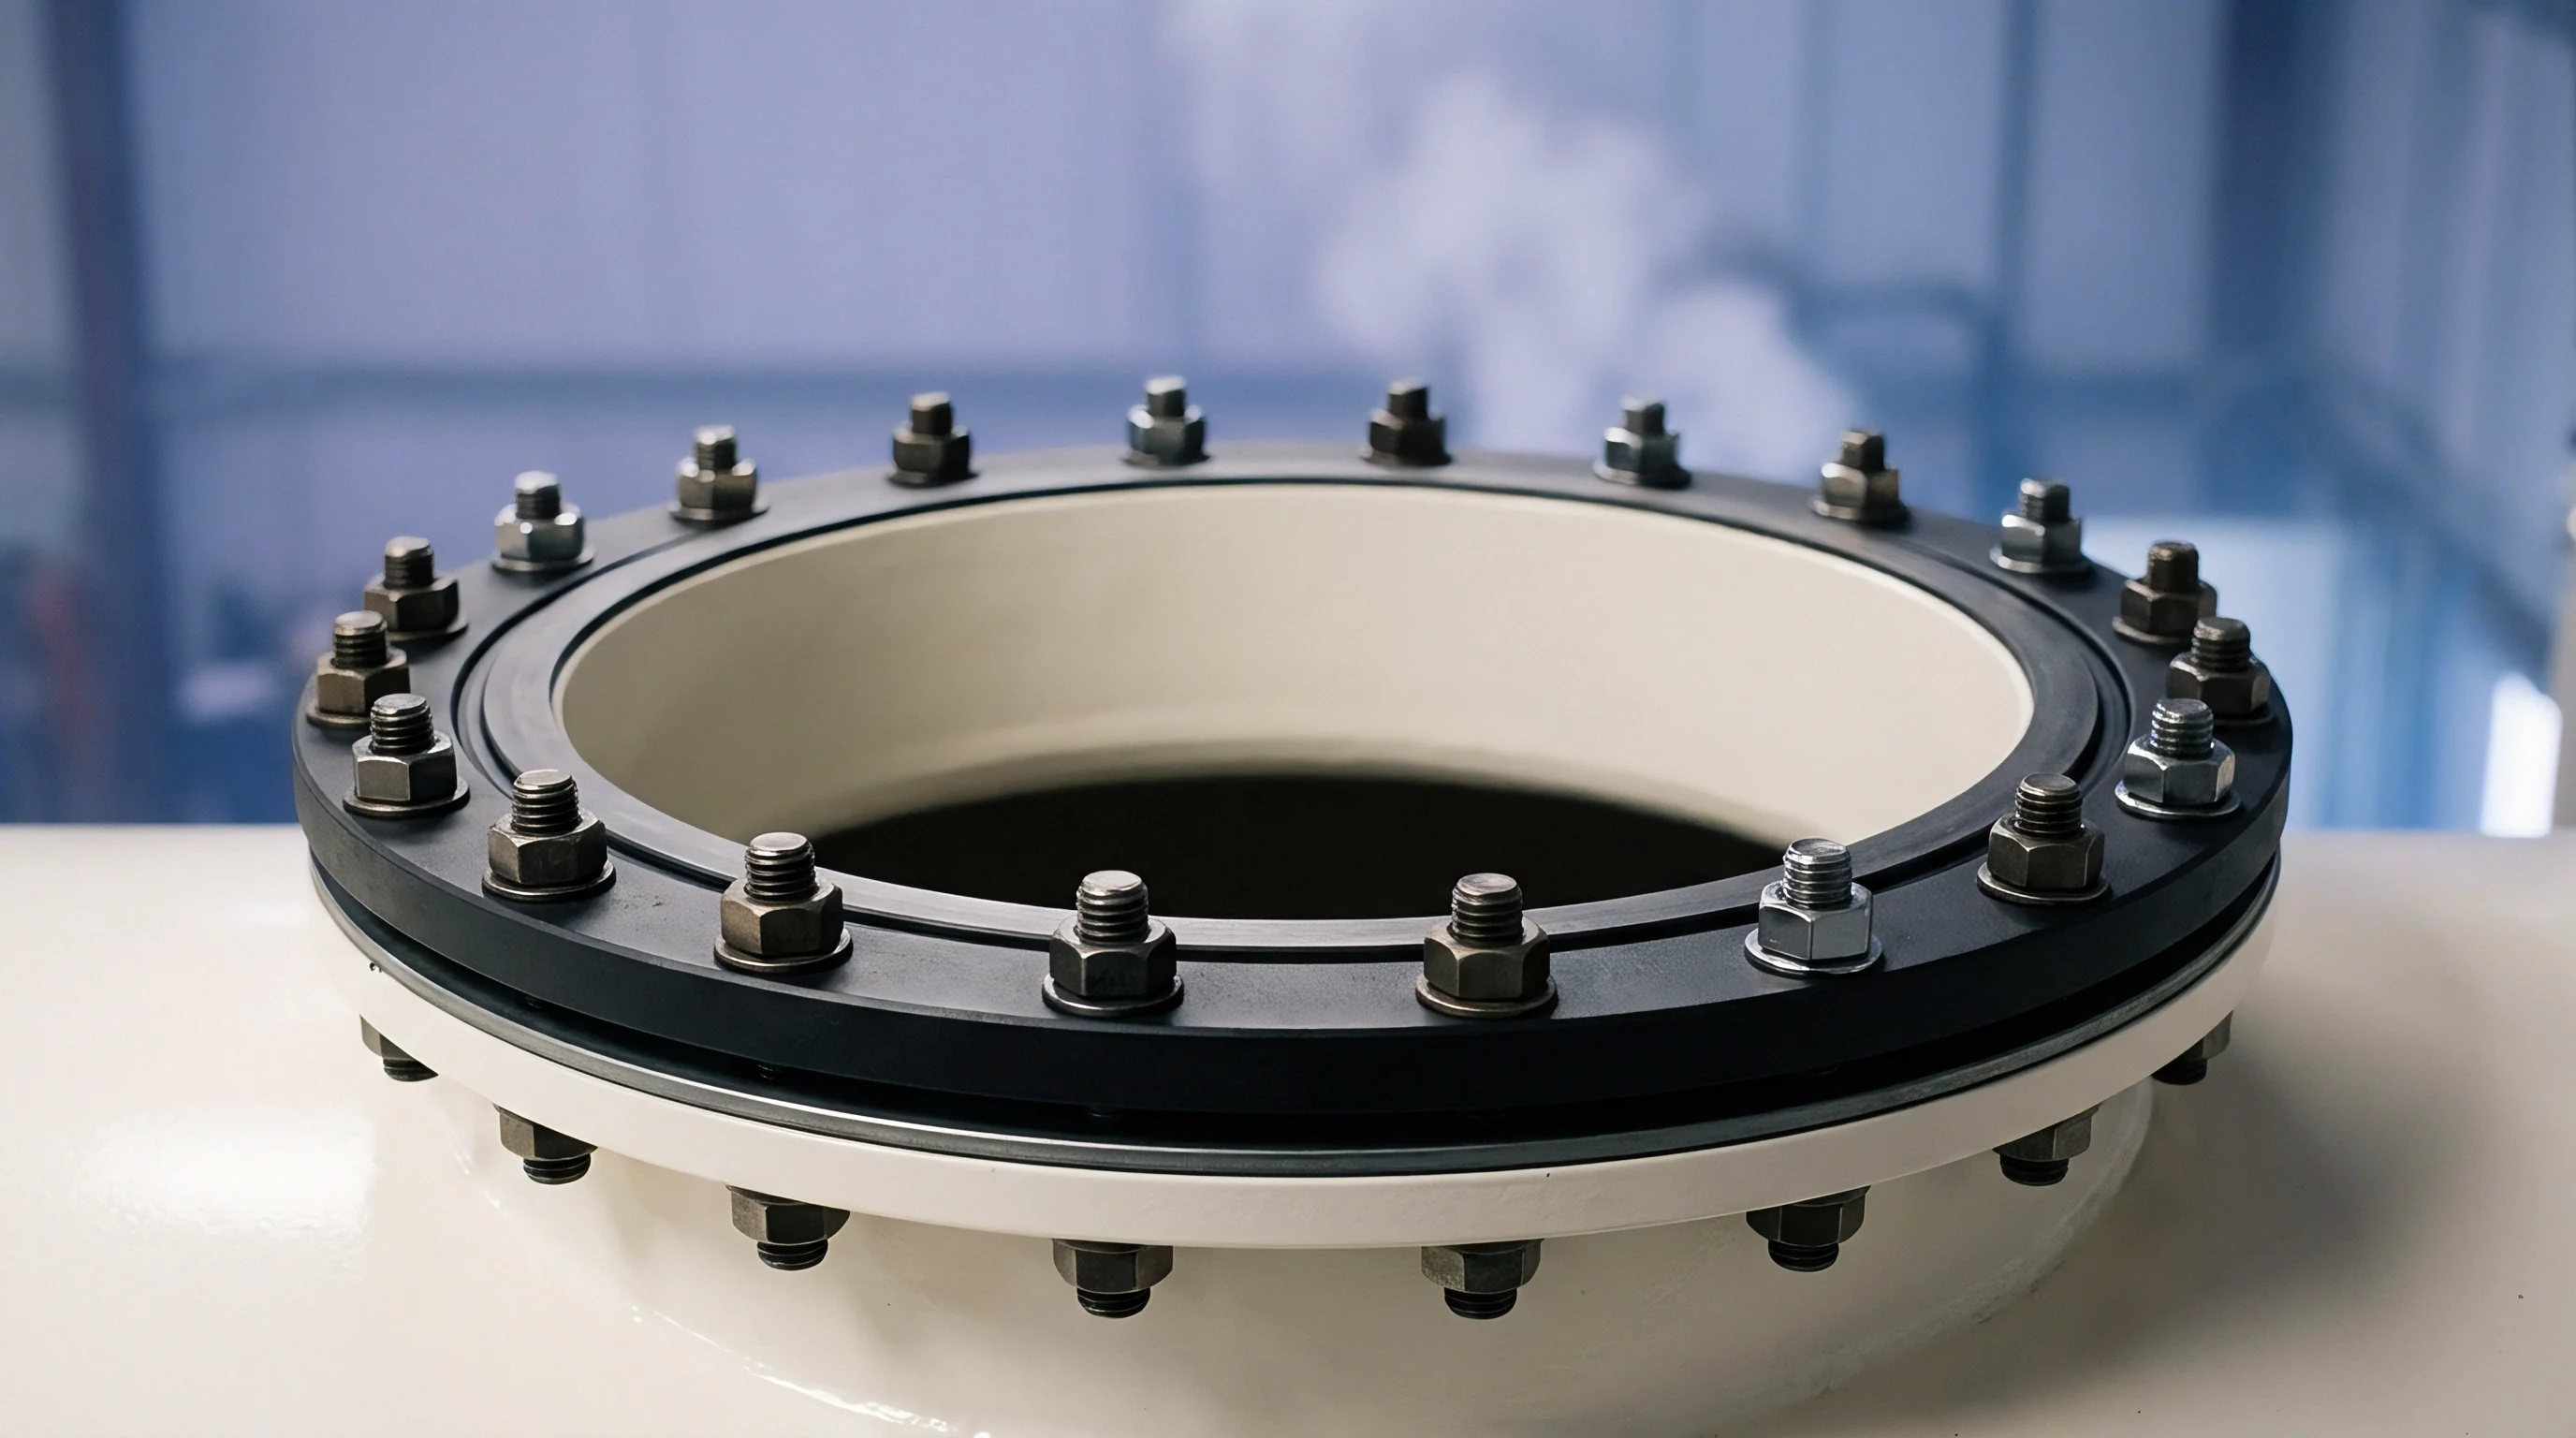
Vent
Molten polyamide enters cold cavities rapidly. High velocity fill drives residual gases toward mold parting lines, core pins, and deep ribs. Gas venting prevents thermal degradation.
Without adequate exhaust pathways, trapped air compresses adiabatically, causing localized diesel burns and severe pressure spikes that skew downstream decay monitoring.
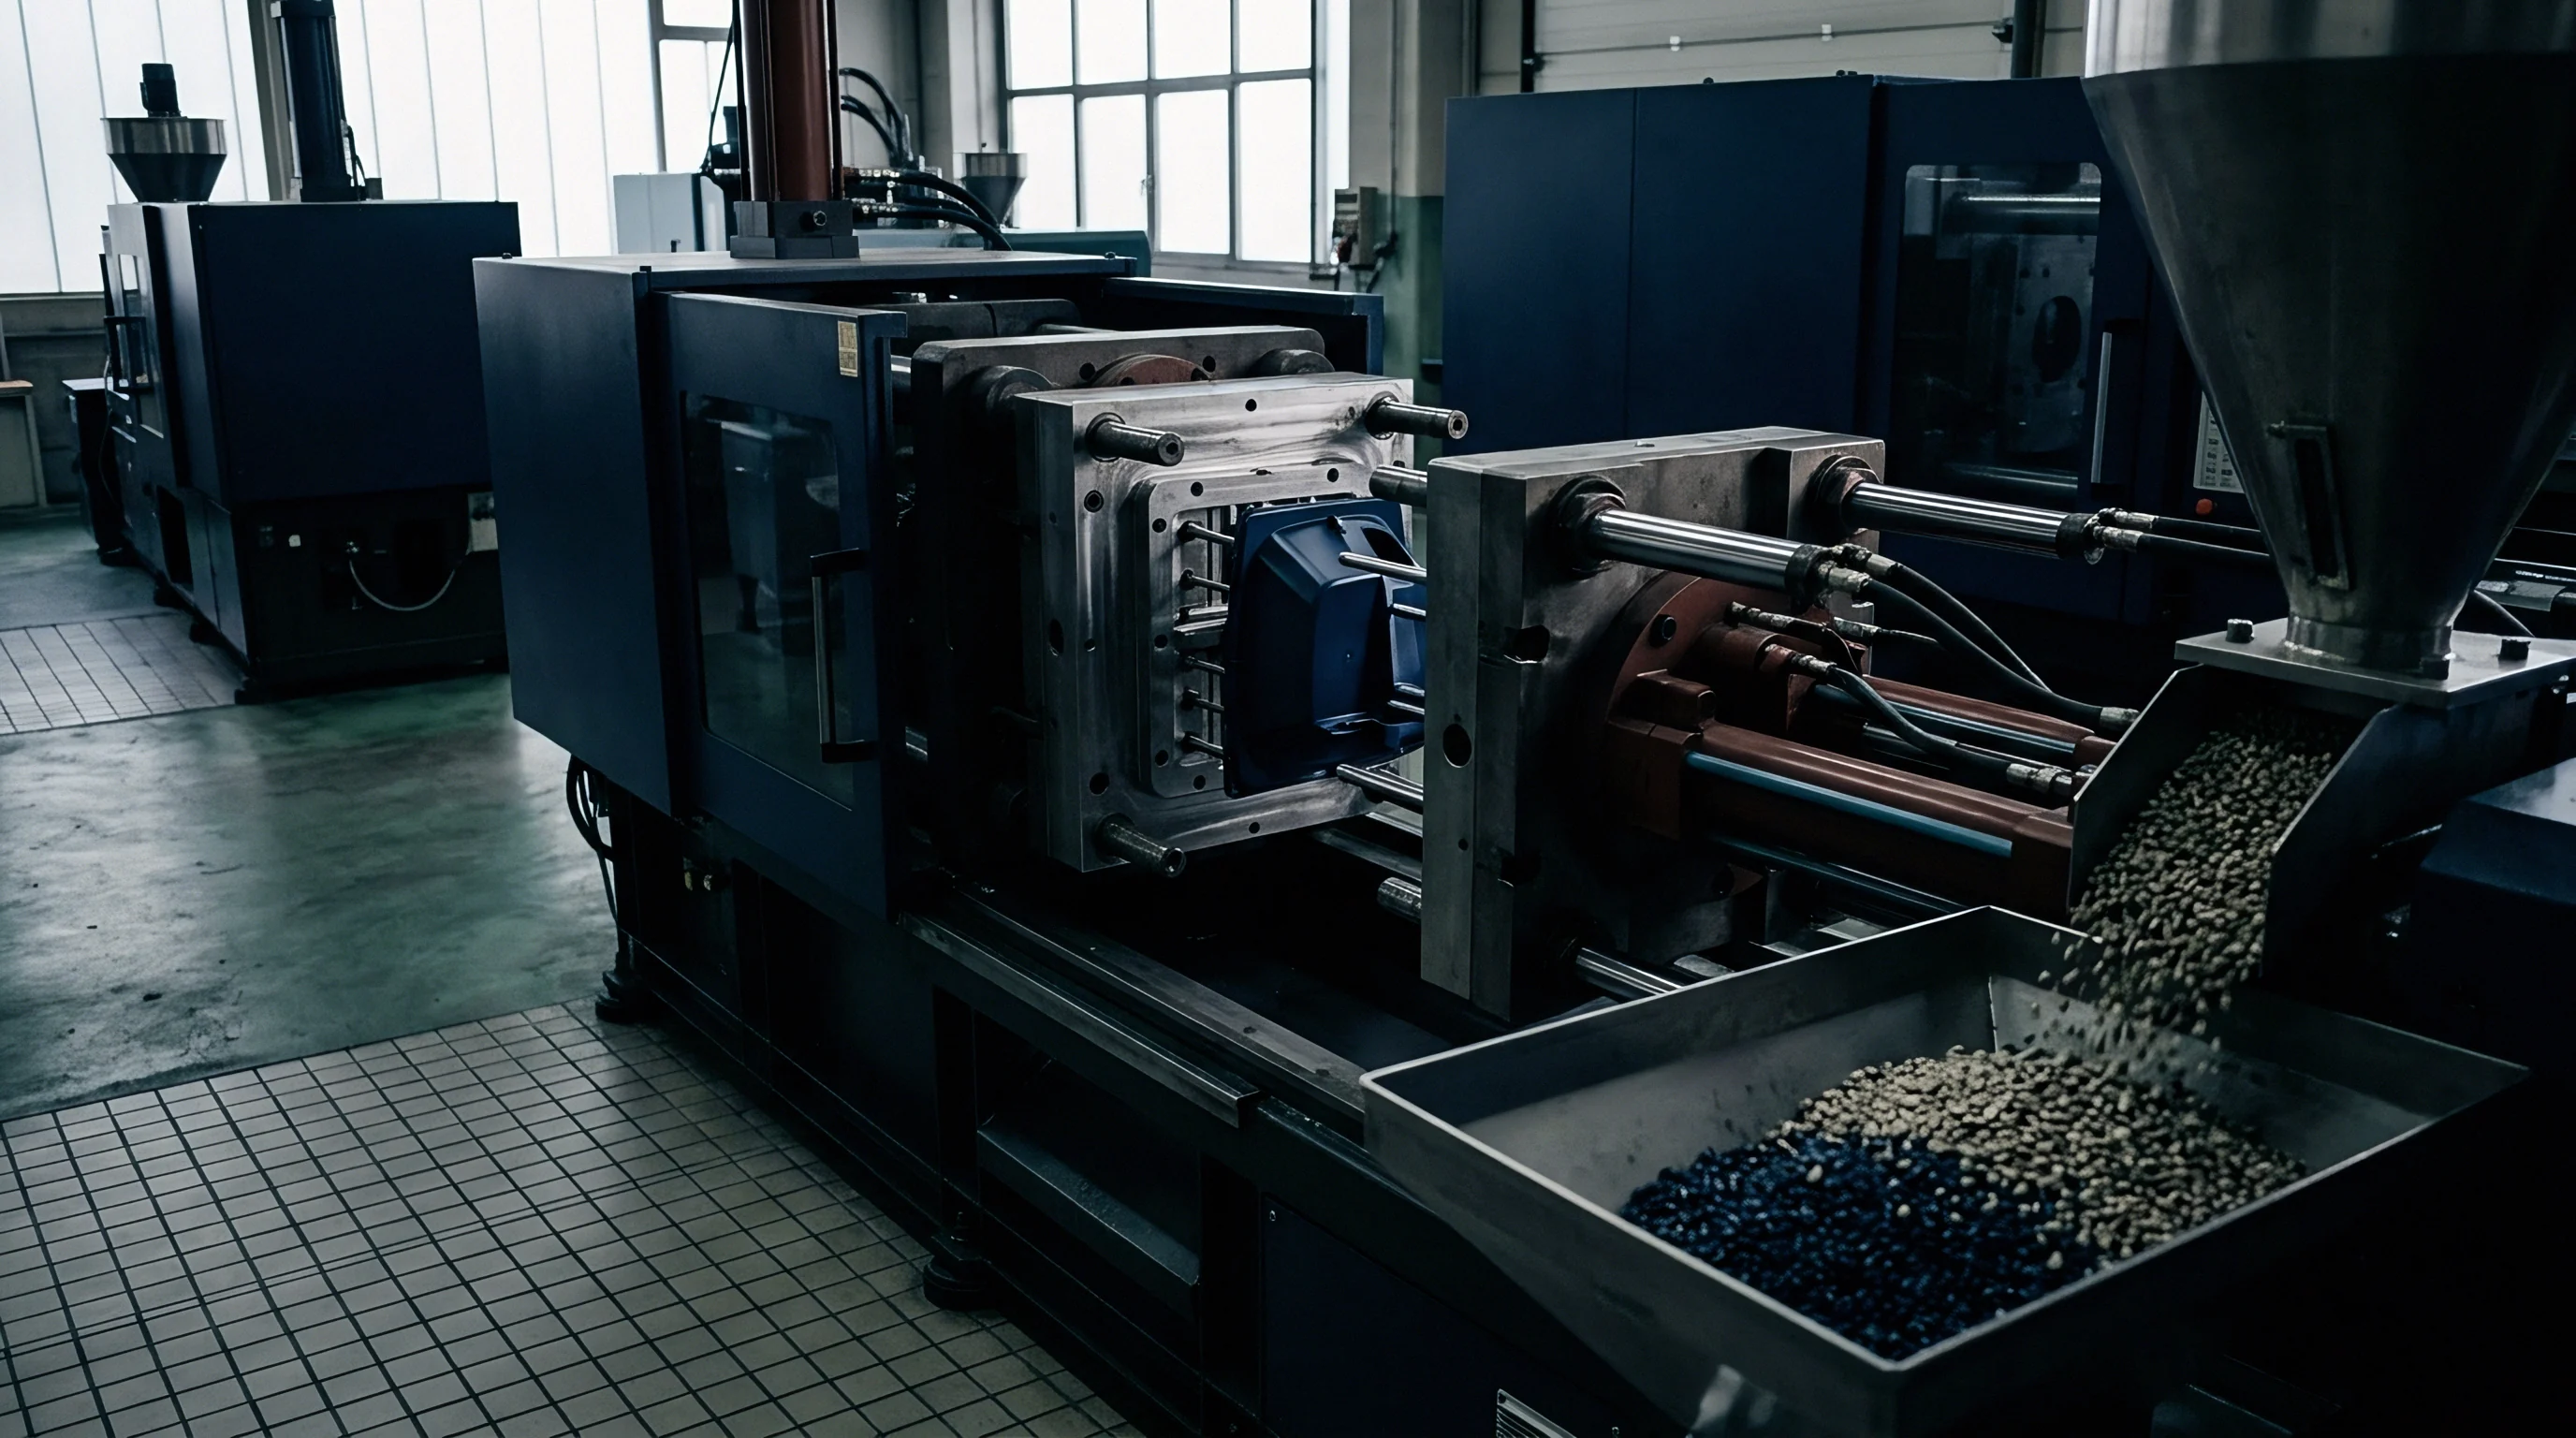
Melt Front Progression and Gas Escape Mechanics
Injection velocities exceeding one hundred millimeters per second push compressed air toward mold parting lines. In thirty percent glass-filled polyamide 66 moldings, the advancing melt front carries high thermal energy combined with abrasive solid fillers. When air escape pathways shrink due to tool wear or resin deposit accumulation, backpressure rises sharply ahead of the fill front.
This localized air resistance counteracts forward hydraulic pressure, artificially elevating the apparent pressure peak while restricting true material density during the packing transition.
Properly engineered exhaust channels maintain cavity pressure equilibrium during the primary injection phase. Microscopic steel gap depths ranging from 0.015 to 0.025 millimeters permit gas evacuation while containing viscous polymer melt. Deep rib features require dedicated porous steel inserts or ejector pin flats to prevent air pockets from forming isolated pneumatic cushions.
Air compression cushions act as mechanical springs, storing energy during holding pressure and releasing it uncontrollably as the gate seals.
Thermal Degradation across Compressed Air Interfaces
Adiabatic compression of trapped atmospheric gases elevates local cavity temperatures above five hundred degrees Celsius. This brief thermal spike degrades the semi-crystalline polyamide matrix, breaking molecular chains and releasing volatile organic compounds. Degraded polymer chains exhibit lower melt viscosity, which destabilizes local volumetric shrinkage and alters subsequent pressure relaxation dynamics.
Polymer oxidation along combustion zones alters surface skin formation, creating micro-voids that impair structural performance.
In multi-cavity tooling, uneven gas escape rates induce cavity-to-cavity pressure decay variances. A cavity with restricted gas paths experiences premature flow front stagnation, forcing the molding press to ramp hydraulic pressure to achieve full volumetric filling. Toolmakers frequently misinterpret this pressure rise as a viscosity shift in the resin batch, leading to incorrect packing profile adjustments.
Molders often complain that gas burn marks require frequent tool disassembly and manual cavity cleaning during extended shift runs.


Phase
Semi-crystalline polymers undergo significant density changes during solidification. Heat transfer into cold mold walls triggers rapid nucleation, transforming disordered molten chains into ordered crystalline domains. Skin layers solidify first.
Fiber-reinforced polyamide 66 matrices exhibit sharp volume reductions upon reaching crystallization onset temperatures, inducing rapid hydrostatic pressure drop before gate clearance freezes completely.

Tait Equation Parameters for Glass Reinforced Polyamide
Modified state equations capture the pressure-volume-temperature relationship of polyamide matrices loaded with solid glass fillers. The dual-domain Tait equation models specific volume changes across both liquid and solid states, incorporates temperature-dependent compressibility factors, and accounts for crystalline density jumps. Glass fibers act as inert thermal masses, displacing polymer volume while increasing overall thermal conductivity.
| Polymer Grade | Transition Temp Range (C) | Volumetric Shrinkage (%) | Specific Heat Capacity (J/g-K) | Tait Pressure Coefficient C |
|---|---|---|---|---|
| Unfilled PA66 | 255 – 265 | 2.10 | 2.85 | 0.0894 |
| PA66-GF30 | 258 – 268 | 0.45 | 2.10 | 0.0812 |
| PA66-GF50 | 260 – 270 | 0.22 | 1.65 | 0.0745 |
High fiber loadings reduce overall volumetric contraction by replacing crystallizable polymer mass with dimensionally stable inorganic fibers. Pressure drops as heat dissipates. The specific heat capacity of a fifty percent glass-filled compound drops significantly compared to neat resin, accelerating thermal diffusion into cavity steel walls.
Consequently, the temperature window for effective pressure transmission narrows, demanding precise mathematical modeling of non-isothermal solidification rates.
Specific Volume Contraction during Phase Transition
As heat transfers into tool steel, the molten polymer undergoes chain crystallization. Core cooling dictates volumetric shrinkage. The transition from amorphous melt to crystalline solid produces a density increase of roughly eight to ten percent within the pure polymer fraction.
Solid fibers embedded in the matrix restrict volumetric contraction along their longitudinal axes, redirecting specific volume shrinkage into transverse directions.
A 30 percent glass fiber reinforcement reduces isotropic volumetric shrinkage from 2.1 percent down to 0.45 percent along the flow vector at 80 MPa packing pressure.
The decay rate of internal cavity pressure directly reflects this volumetric contraction. During holding, additional melt enters the cavity to offset density increases. Once the gate freezes, cavity pressure decays rapidly as core crystallization continues without fluid replenishment.
Modeling this decay phase requires solving coupled transient heat transfer equations alongside non-isothermal crystallization kinetic expressions such as the Patel-Spruiell or Nakamura models.
Higher mold temperatures delay crystallization onset, maintaining internal cavity pressure over longer holding durations. Lower mold steel temperatures freeze outer skin layers instantly, accelerating pressure decay and leaving core regions under high hydrostatic tension. Mold wall thermal boundaries govern crystallite size distribution, where rapid cooling forms small spherulites and slow cooling yields large crystalline structures that exhibit higher localized density drops.

Orientation
Glass fibers dispersed within polyamide resins align along velocity gradients created during cavity filling. Flow dynamics generate distinct structural layers across the part cross-section. Skin-core morphology controls local mechanical properties and dictates direction-dependent elastic moduli.
Anisotropy drives structural distortion. Transverse pressure decay patterns deviate significantly from longitudinal profiles due to anisotropic thermal conductivity and mechanical restriction.
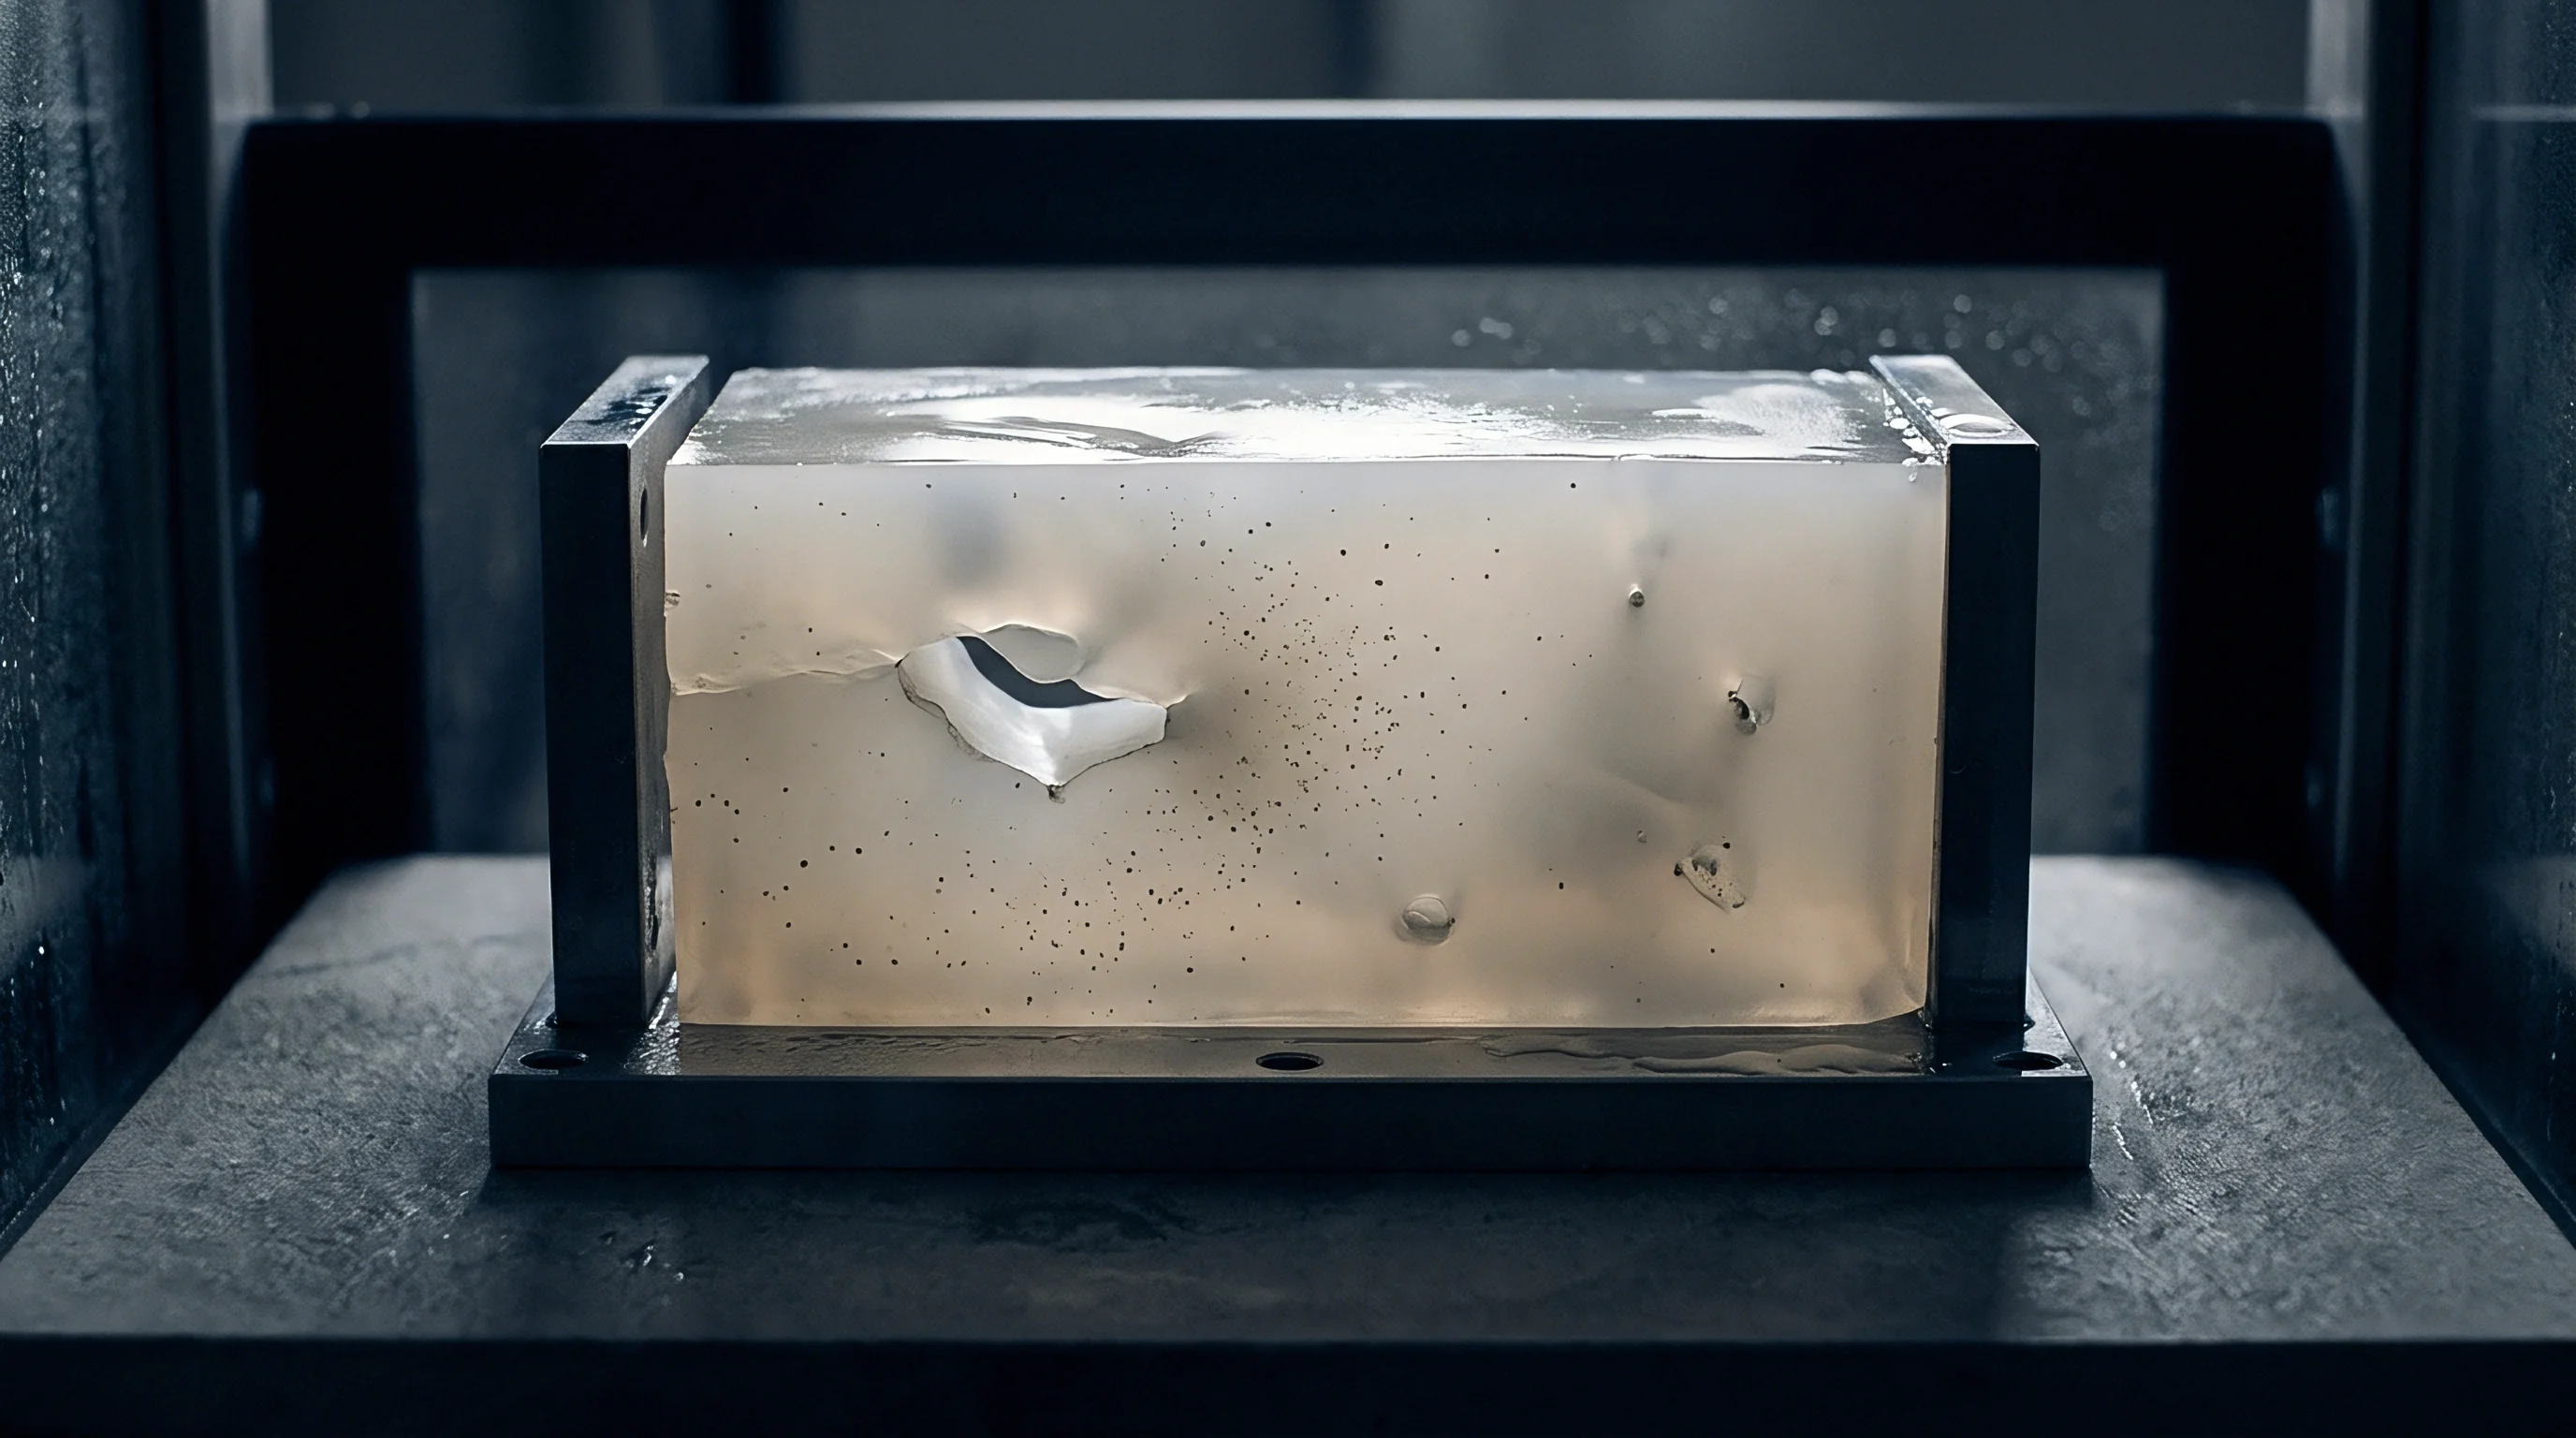
Anisotropic Fiber Alignment across Wall Thickness
High shear stress near mold walls creates a highly ordered shell structure. In contrast, low shear rates near the center wall permitextensional flow, orienting glass fibers perpendicular to the main injection path within the core layer. This tripartite shell-core-shell morphology yields non-uniform mechanical stiffness through part thickness.
Fiber orientation tensors, calculated using Advani-Tucker representations, quantify directional alignment probabilities throughout the molding geometry.
The mechanical stiffness along fiber alignment vectors opposes thermal shrinkage forces during cooling. Transverse directions lack fiber reinforcement alignment, permitting unconstrained matrix shrinkage during cavity pressure loss. When modeling pressure decay, engineers account for anisotropic stress transfer from the shrinking core matrix to the rigid surrounding shell.
Differential shrinkage vectors generate internal residual stress gradients that manifest as part warpage upon ejection.
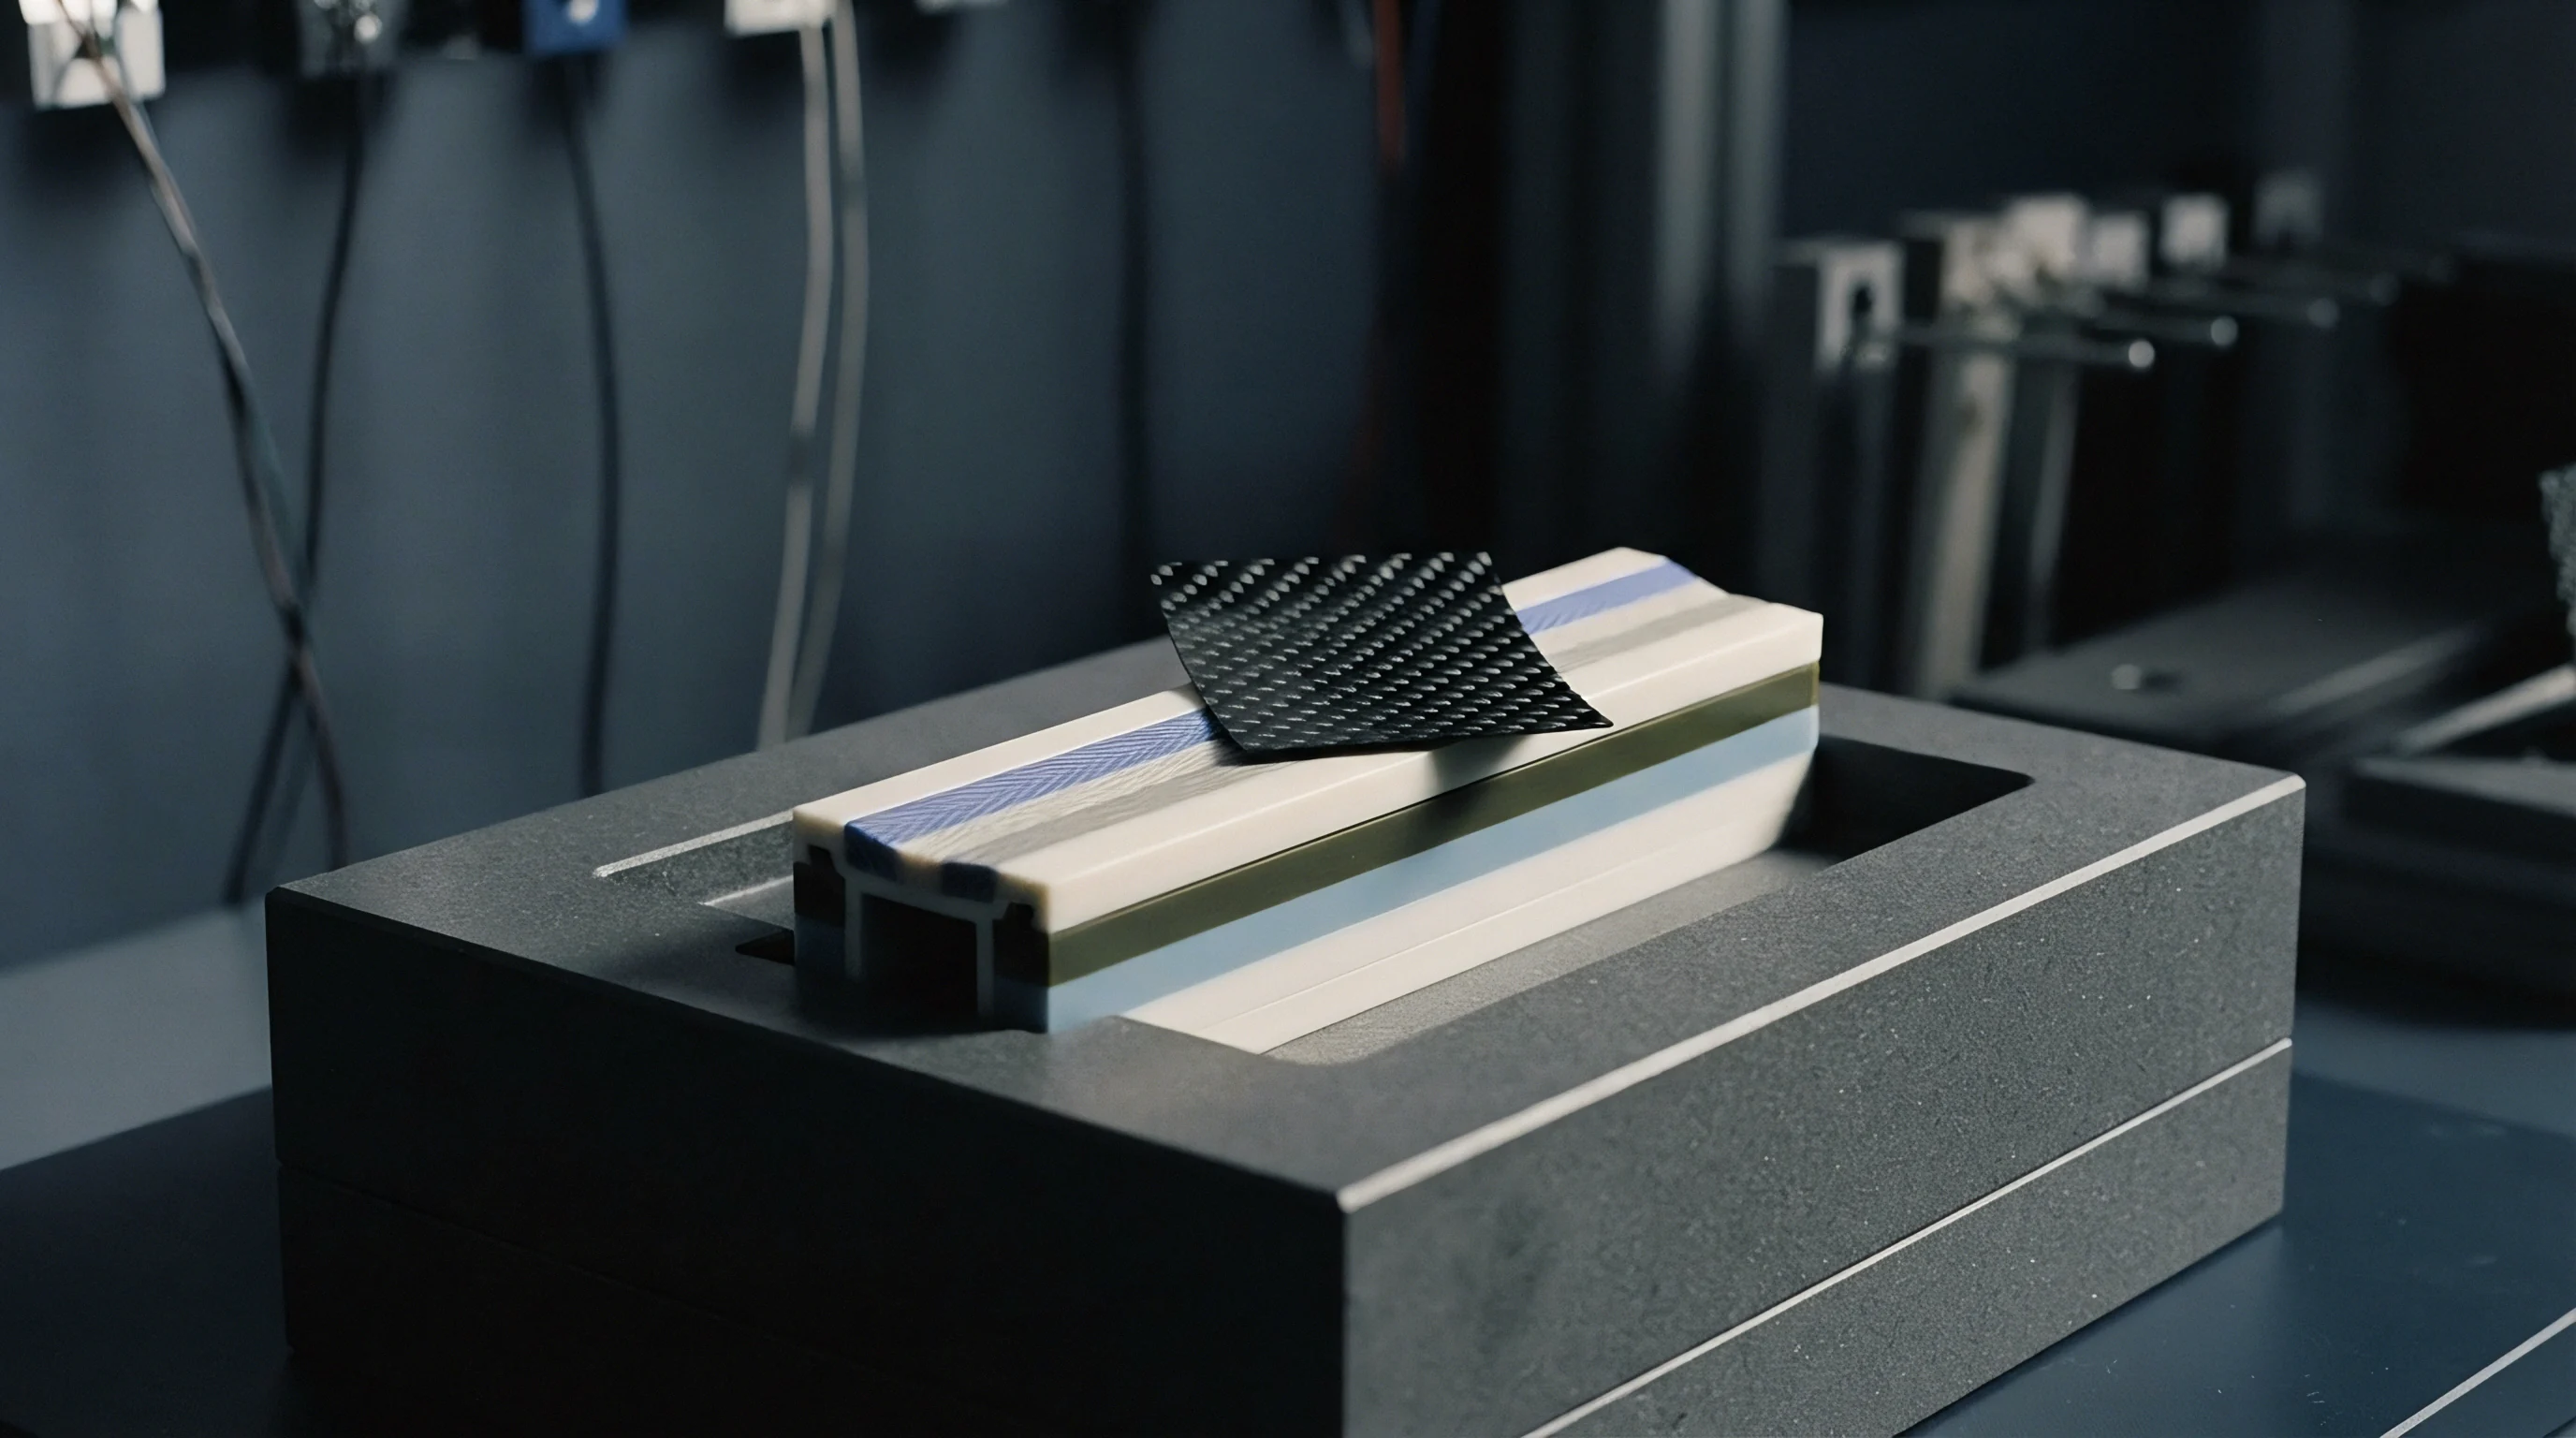
Transverse Pressure Decay and Structural Stiffness
Compressibility varies significantly depending on fiber spatial arrangements. Matrix shrinkage along transverse directions pulls away from mold steel surfaces faster than along longitudinal flow paths, creating premature thermal contact resistance. This localized air gap insulates the part, retarding core cooling rates and altering the slope of measured cavity pressure decay curves.
Inconsistent decay rates between transverse and longitudinal sensor positions indicate severe fiber alignment gradients.
- Differential Part Warpage ~ Shear-induced alignment creates unequal thermal contraction along principal flow vectors, causing out-of-plane twisting once cavity pressure falls below ambient restraint limits.
- Internal Cavitation Voids ~ Rapid pressure loss before core crystallization completes allows hydrostatic tension to pull localized tears near heavy rib intersections.
- Weld Line Debonding ~ Low residual cavity pressure during knit line convergence prevents intimate glass fiber entanglement across converging melt streams.
- Sink Mark Formation ~ Inadequate packing pressure retention over thick cross-sections leads to surface depression above unribbed structural bosses.
Internal void development accelerates when pressure decay drops below the threshold required to suppress dissolved moisture expansion. Polyamides readily absorb atmospheric humidity, which vaporizes at processing temperatures exceeding two hundred eighty degrees Celsius. High cavity pressure holds steam in liquid solution; rapid pressure decay allows gas bubbles to nucleate, generating internal porosity that severely compromises impact strength.
Cutting holding pressure too early risks catastrophic void formation in structural automotive brackets.


Transducer
Piezoelectric sensing elements installed inside mold cavities convert local mechanical stress into measurable electric charges. Sensors capture local pressure decay. Direct-measuring quartz pins contact the polymer melt, transmitting pressure forces directly to internal crystal plates.
Indirect configurations position sensors behind ejector pins, measuring transferred mechanical force. Sensor selection and spatial positioning govern the dynamic resolution of captured decay signals.
What Signal Distortions Mask Real Pressure Decay?
Thermal shock from incoming polymer melt causes rapid expansion of sensor faces, inducing false negative pressure readings. This mechanical distortion occurs when hot resin hits cold quartz contact surfaces during initial fill. Piezoresistive alternatives offer thermal stability but lack the rapid response times required to capture instantaneous pressure peaks.
Signal drift across long cycle times introduces artificial baseline shifts, distorting real pressure relaxation measurements post-gate freeze.
| Sensor Technology | Pressure Range (bar) | Max Mold Temp (C) | Sensor Diameter (mm) | Decay Signal Drift Rate (bar/sec) |
|---|---|---|---|---|
| Direct Piezoelectric Quartz | 0 – 2500 | 300 | 1.0 – 4.0 | 0.01 – 0.05 |
| Indirect Quartz Load Button | 0 – 2000 | 200 | 6.0 – 10.0 | 0.05 – 0.20 |
| Piezoresistive Strain Gauge | 0 – 1500 | 150 | 4.0 – 8.0 | 0.10 – 0.50 |
Piezoelectric crystals output electrical charge. In a processing study on PA66-GF30 using quartz transducers mounted 5 millimeters downstream of an edge gate, a measured peak pressure of 850 bar decayed at 42 bar per second during pack stage. Moving the sensor 80 millimeters toward the end of fill shifted measured peak pressure to 510 bar and accelerated decay rate to 68 bar per second due to thermal skin growth restricting pressure transmission through thin melt channels.
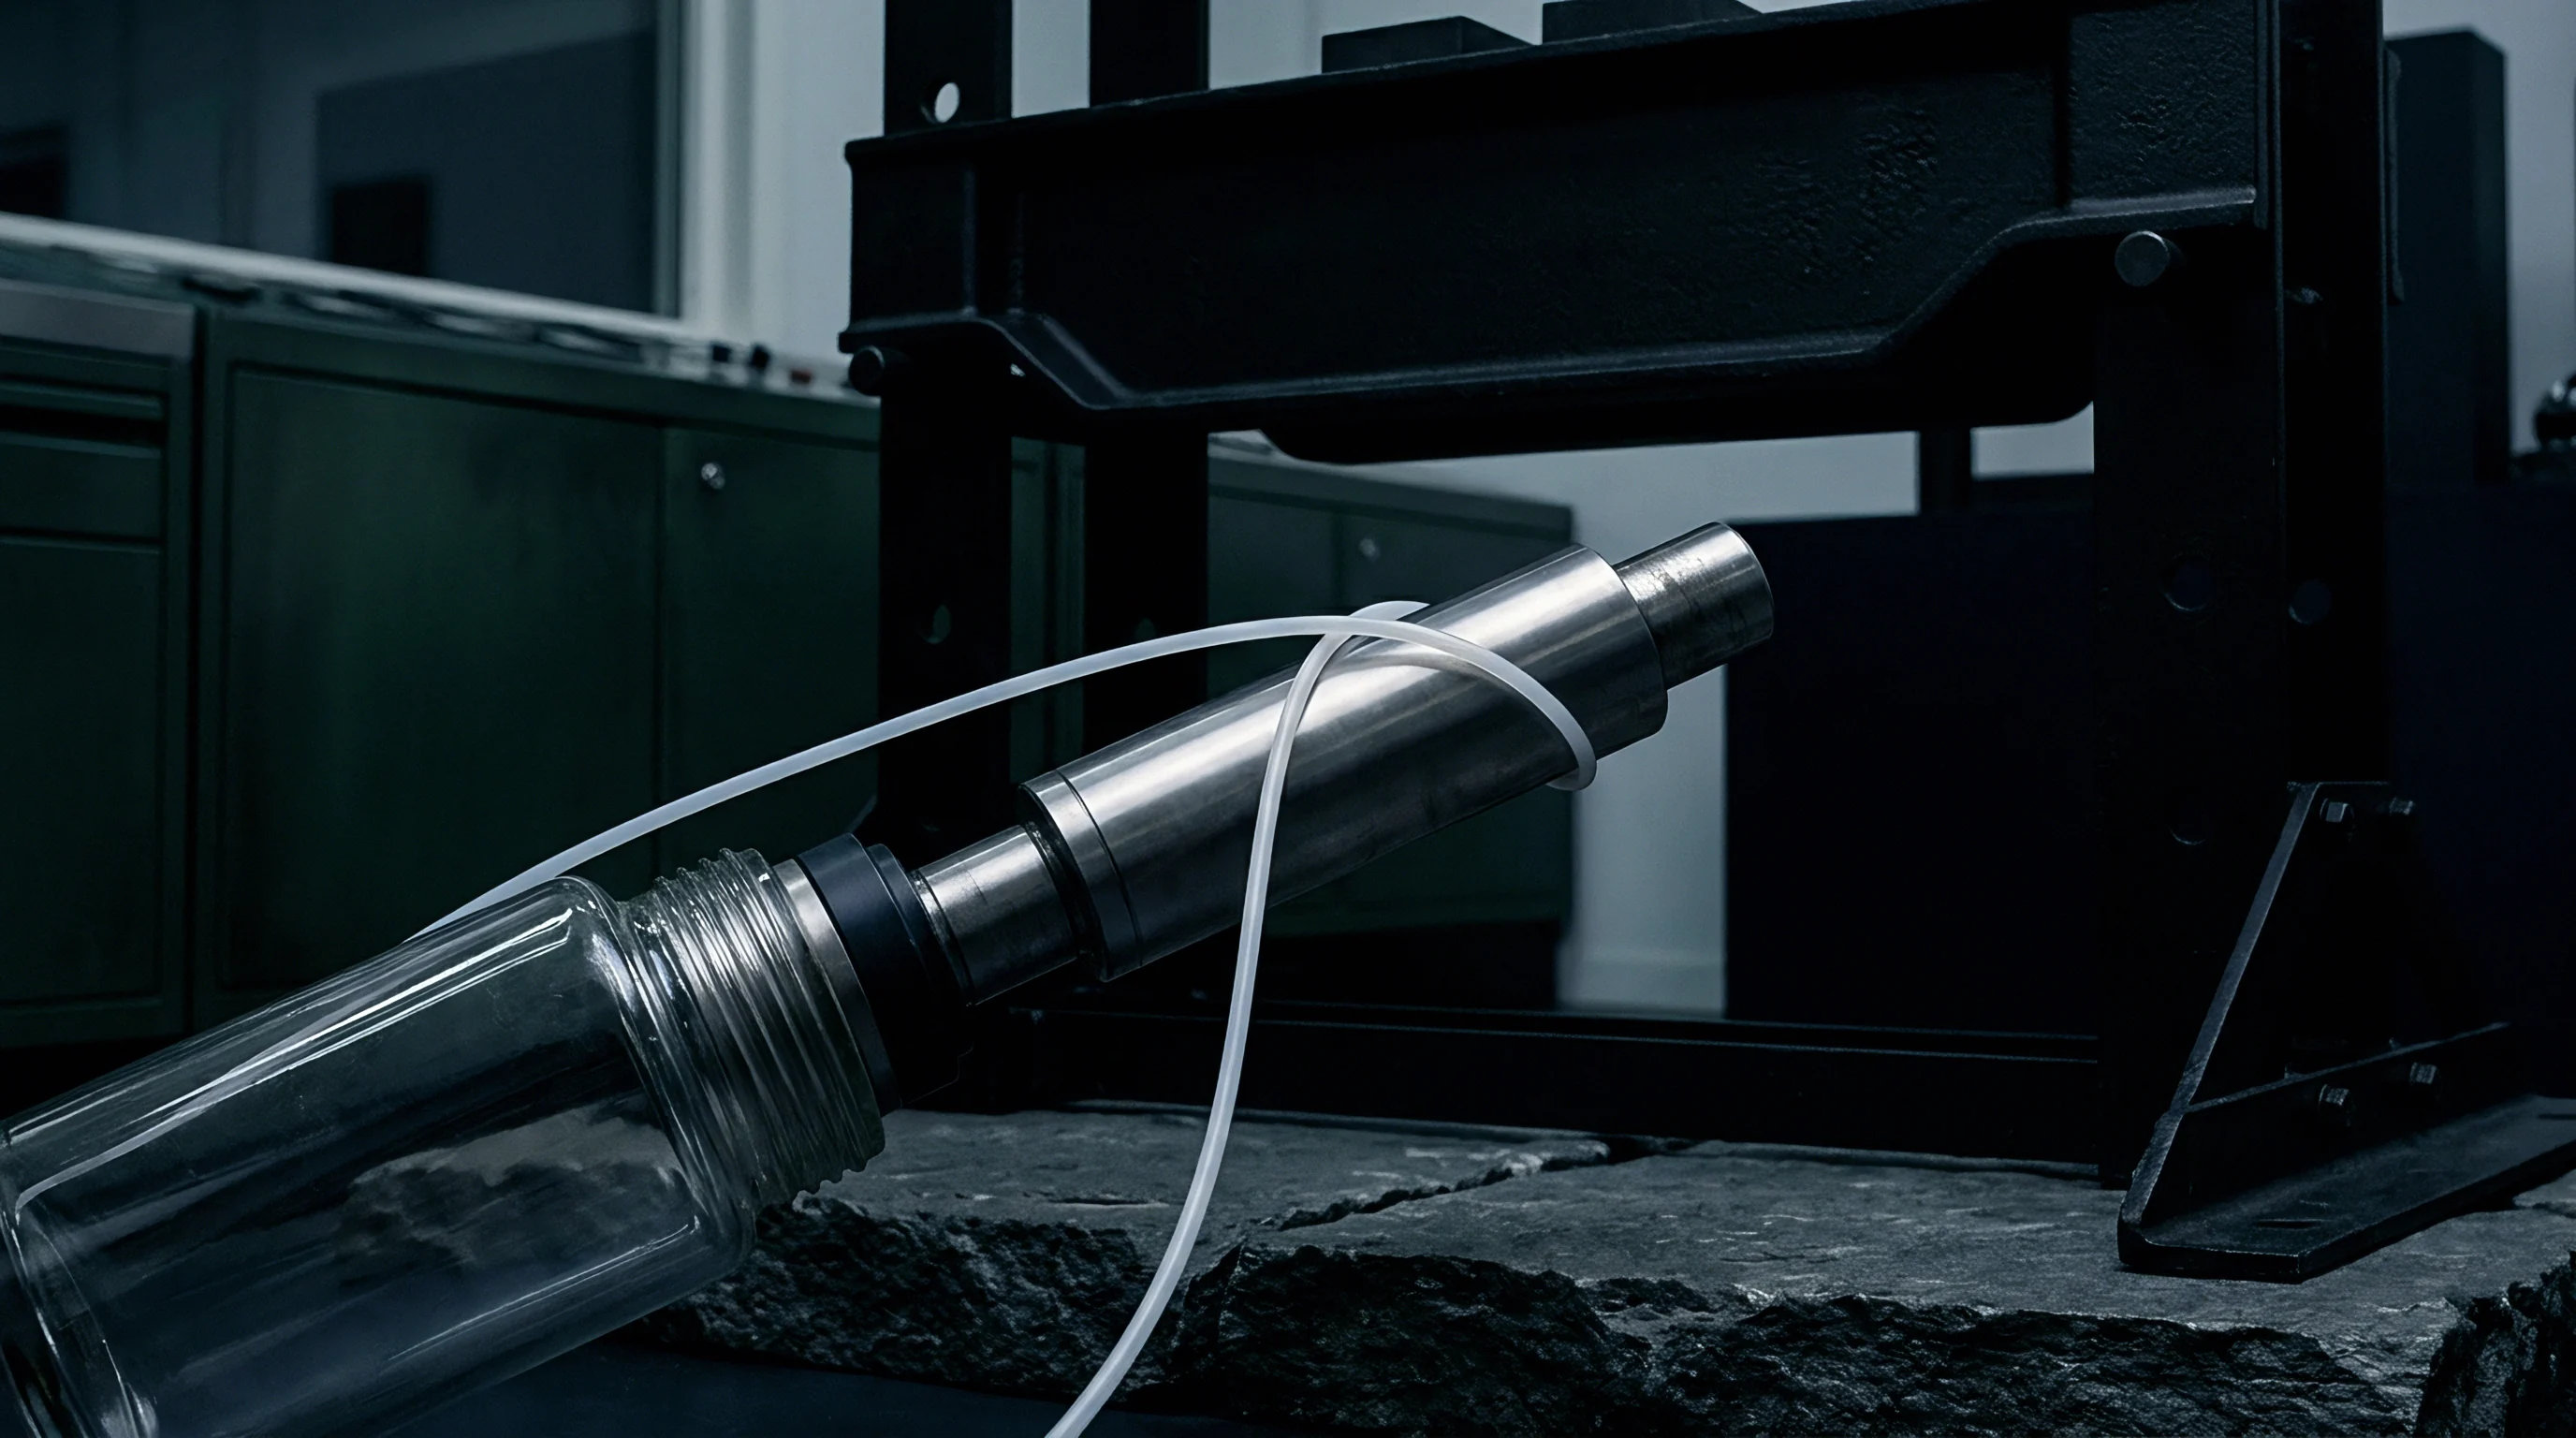
Piezoelectric Measurement at High Mold Temperatures
Elevated tool steel conditions require charge amplifiers configured for continuous baseline drift compensation. High mold temperatures exceeding ninety degrees Celsius degrade electrical insulation resistance within coaxial sensor cabling. Low insulation values bleed piezoelectric charges prematurely, causing artificial decay slopes that mislead process monitoring algorithms.
Signal cables must maintain strict shield integrity to prevent electromagnetic interference from press heater bands from corrupting micro-coulomb output signals.
Sensor placement dictates model fidelity. Positioning transducers exclusively near the sprue masks decay dynamics occurring at distant flow extremities. Conversely, placing transducers solely near weld lines ignores packing pressure loss across main wall sections.
Multi-sensor layouts capture differential pressure gradients, allowing engineers to calculate real-time hydraulic resistance factors across complex flow lengths.
Unresolved questions persist regarding sensor face wear caused by highly abrasive fifty percent glass fiber compounds. Continuous high-velocity scraping ablates sensor diaphragm surfaces over extended production cycles, gradually shifting mechanical sensitivity calibration factors without throwing immediate hardware fault codes.

Window
Constructing predictive mathematical models requires mapping cavity pressure loss against real-time cooling rates. Modern press controllers execute scientific molding principles by establishing decoupled filling and packing phases. Packing pressure compensates volumetric loss.
Modulating machine hydraulic profiles controls cavity pressure decay decay dynamics, optimizing gate freeze times while minimizing energy consumption across continuous shifts.
Mathematical Modeling of Pressure Loss Profiles
Exponential decay equations represent hydraulic pressure attenuation post-injection. The pressure decay parameter tau characterizes fluid flow resistance combined with polymer thermodynamic relaxation times. Mathematical models split pressure decay into two distinct regimes: viscous packing flow through an open gate, followed by hydrostatic relaxation within a closed cavity post-gate freeze.
Gate seal halts pressure transmission.
Modeling equations incorporate shear-rate-dependent viscosity functions, such as Cross-WMS models, alongside temperature-dependent shift factors calculated through Arrhenius or WLF relations. As polymer melt cools, viscosity escalates exponentially, restricting hydraulic force transmission from the press screw cushion. Predictive algorithms integrate these rheological changes to calculate localized pressure integrals, which correlate directly with final part density and dimensional stability.
Gate Seal Quantification and Packing Calibration
Determining exact solidification timing at the injection entry prevents backflow into runner systems. Systematic gate freeze studies establish optimal hold times by tracking part mass stability relative to packing duration. Extending hold time beyond gate freeze wastes machine electrical energy and increases thermal wear on hydraulic valves without altering internal part density.
- Set melt temperature to 295 degrees Celsius and mold temperature to 90 degrees Celsius while holding packing pressure constant at 600 bar.
- Increase pack time in increments of 0.5 seconds from 2.0 to 10.0 seconds while recording part mass on an analytical balance.
- Identify the inflection point on the weight-time curve where part mass reaches an asymptotic plateau within 0.05 percent variance.
- Extract the cavity pressure trace corresponding to optimal gate freeze and calculate the exponential decay constant across the holding phase.
- Adjust holding pressure amplitude until peak cavity pressure achieves 70 percent of machine hydraulic injection pressure.
Clause 6.4 of ISO 294-1 mandates that cavity pressure holding curves remain within five percent of target amplitude across forty consecutive molding cycles during tool qualification.
Deviations exceeding specified pressure decay bands signal thermal instability inside runner manifolds or screw cushion collapse. Machine wear in non-return valves permits backflow into the barrel during holding, causing progressive pressure decay decay decay degradation shift across shift runs. Tooling engineers specify pressure control limits inside purchasing agreements to prevent suppliers from adjusting hold profiles to trim cycle seconds at the expense of part dimensional stability.


Allowance
Tool makers cut steel impressions smaller than target part dimensions to account for post-molding contraction. Steel dimensions determine final part geometry. Predictive pressure decay decay models translate transient cavity pressure integrals into absolute dimensional shrinkage allowances.
Precision tooling designs adjust steel offsets based on directional fiber alignment, local wall thickness, and predicted pressure drop vectors.

Integrating Pressure Profiles into Tooling Steel Sizing
Integrating cavity pressure curves over time yields localized density predictions across complex geometries. High pressure integrals correlate with dense molecular packing and low volumetric shrinkage. Low pressure integrals, observed at distant flow ends, require higher tooling shrinkage allowances.
DIN 16742 standardizes dimensional tolerances for molded plastic parts, establishing tolerance groups based on resin type, filler content, and processing stability.
| Nominal Dimension Range (mm) | DIN 16742 TG4 Tolerance (mm) | DIN 16742 TG6 Tolerance (mm) | Cavity Dimension Offset (%) Flow | Cavity Dimension Offset (%) Transverse |
|---|---|---|---|---|
| 1.0 – 6.0 | 0.07 | 0.14 | 0.20 | 0.55 |
| 6.0 – 30.0 | 0.12 | 0.24 | 0.25 | 0.60 |
| 30.0 – 120.0 | 0.22 | 0.44 | 0.30 | 0.70 |
| 120.0 – 400.0 | 0.42 | 0.84 | 0.35 | 0.80 |
Multi-cavity injection molds present variable decay behavior between inner and outer runner positions. Numerical modeling predicts isotropic cavity decay with an uncertainty band of plus or minus 8 percent across complex rib intersections; buyers hedge this risk by mandating T1 sampling approval before cutting hard tool steel modifications. High-volume automotive connectors molded in glass-filled polyamide rely on sub-gram shot weights where cavity pressure sensors scale down to 1.0 millimeter pin diameters, mirroring micro-molding techniques developed for Swiss watch gears.
Commercial Risk Allocation in Multi-Cavity Tool Sign-Off
Tooling commitments require precise modeling. Cavity wear expands dimensional tolerance over long production lifecycles. Glass fiber abrasion strips chrome plating from runner channels and gates, enlarging gate cross-sections over hundred-thousand-shot runs.
Larger gate dimensions delay gate seal timing, altering decay curves and forcing press operators to modify machine settings over the life of the tool.
- Pressure Sensor Data Validation ~ Verification that cavity pressure decay rates remain consistent across all impression positions prior to final steel cutting.
- Tolerance Class Designation ~ Formal agreement on DIN 16742 TG5 requirements mapped against predicted anisotropic shrinkage limits.
- Cavity Amortization Term ~ Assignment of tool maintenance expense based on severe glass fiber abrasion at high injection velocities.
- Shrinkage Compensation Mapping ~ Application of localized cavity dimension offsets derived from integrated pressure-time integral calculations.
Cavity pressure decay models hold precision only when mold cooling channel flow rates maintain turbulent Reynolds values across all circuit loops.
Tool transfer contracts designate ownership of thermal process models alongside physical steel tooling assets. Sourcing practices require tooling quotes to include baseline cavity pressure decay curves established during initial T1 qualification. When production moves to secondary suppliers, matching baseline pressure decay profiles guarantees identical part dimensions without requiring expensive tool modification or continuous press-side adjustments.