Polyamide Dimensional Shrinkage Differential under Varied Cavity Pressure Conditions
Cavity pressure directly controls polyamide crystallization and volumetric shrink, requiring precise transducer monitoring to hold DIN 16742 tolerances.
Cushion
Reciprocating screw injection units process semi-crystalline polyamides through a tight thermal and mechanical sequence. Melt accumulating ahead of the non-return valve builds the volumetric shot needed to fill the runner system and cavities. Piston position dictates melt density.
When injection transitions to the holding phase, resin remaining in the barrel acts as a hydraulic transmitter, passing screw force into melt pressure inside the cavity. In unreinforced polyamide 66 and glass-fiber reinforced grades, screw cushion volume, pressure transmission efficiency, and local volumetric shrinkage are directly linked.
Process drift during long production runs often traces back to the barrel nozzle and screw tip. Changes in cushion height alter the pressure drop between the injection cylinder and the gate. If the cushion shrinks toward zero, the screw bottoms out against the barrel head, killing holding pressure before the gate freezes.
Too large a cushion absorbs dynamic energy ~ adding viscous heat and compression delays that alter the pressure decay curve inside the cavity.

Hydraulic Pressure Transmission and Cavity Decay
Piston force applied during packing does not reach the far end of the cavity at full efficiency. Set hydraulic pressures drop across the nozzle, sprue, cold runner, and gate. Polyamide melts are non-Newtonian and pseudoplastic, so shear rate and melt temperature dictate viscosity.
At normal processing temperatures between 275 degrees Celsius and 305 degrees Celsius for PA66, losses across thin-wall gates frequently exceed 350 bar.
Melt compressibility complicates force transfer further. Under high hydrostatic pressure, polymeric fluids compress. At 800 bar during packing, unreinforced polyamide increases in density by 6 percent to 8 percent over its atmospheric liquid state.
As heat pulls out into the cooled tool steel, a frozen outer skin forms quickly, leaving a molten core that requires continuous feeding of fresh material to compensate for thermal contraction.
Gate freeze stops mass transfer entirely. Once material inside the gate drops below its no-flow temperature, cavity pressure decays independently of what the machine is applying. The speed of this decay sets the final packing density and crystallite nucleation rate.
Higher peak cavity pressures delay the drop to ambient, holding molecular density higher while the polymer crystallizes.
Peak cavity pressures above seven hundred bar reduce volumetric shrinkage in thirty percent glass-filled polyamide six-six from one point two percent down to zero point four percent.
Flow length to wall thickness ratio dictates pressure distribution across the part. On long flow paths, regions near the gate see far higher effective packing pressure than areas at the end of fill. A sensor by the gate might read 650 bar while one near the vent registers under 200 bar, creating a distinct density gradient across the molding.
That localized density difference translates into uneven shrinkage. High gate-area pressure restricts chain relaxation and crystallite growth, forming a dense microstructure with minimal volumetric shrink. Downstream regions under less pressure shrink more as they cool.
The resulting variation along the part length warps flat surfaces and pulls cylindrical features out of round.

Screw Recovery and Check-Ring Sealing Dynamics
Process stability relies heavily on how consistently the non-return valve seats. During plasticization, melt pushes the check ring forward off its seat to fill the volume ahead of the screw tip. On injection, hydraulic pressure drives the ring back against the thrust washer to seal the chamber.
If the ring fails to seat properly, melt flows backward during primary injection and holding.
This backflow drops effective cavity pressure without setting off press alarms, because standard machine controls read hydraulic cylinder pressure rather than force inside the mold. Worn rings or erratic seating let molten polyamide slip back into the screw flights under holding pressure. Losing that mechanical boundary drops cavity pressure, speeding up volumetric contraction in the tool.
Monitoring cushion position gives the first sign of backflow. A cushion that creeps backward toward the barrel head during holding indicates seal failure. Tracking cushion variance down to tenths of a millimeter across eight-hour production runs reveals that variations over 0.5 mm correlate directly with out-of-spec gear teeth and bearing retainers.
Temperature stability in the rear barrel zones also affects check-ring behavior. Uneven feed zone cooling disrupts granule transport, sending air pockets and density shifts into the metering zone. Those density variations change how the check ring shuts off, shifting the volumetric starting point of every shot.
A scientific molding process window establishes the baseline cushion allowance. Operators base holding pressure set points on cavity sensor feedback instead of arbitrary machine percentage dials. At the end of holding pressure, screw position must retain enough cushion to guarantee force transmission until gate seal is confirmed.
Nominal shrink values on data sheets assume standard cavity pressure decay across simple test geometries.

Morphology
Polyamides gain their mechanical strength and dimensional traits from a semi-crystalline backbone, where macromolecular chains form ordered crystalline domains within an amorphous matrix. Total crystallinity dictates final density and room-temperature shrinkage. Fast cooling suppresses crystallite growth, locking chains into a lower-density amorphous state.
Slow cooling under high cavity pressure promotes lamellar folding and spherulites, increasing both physical density and volumetric shrink.
Thermal history and cavity pressure together control crystalline phase transitions. Polyamide 6 and Polyamide 66 are polymorphic, crystallizing into stable alpha or metastable gamma phases based on cooling rate and stress. High hydrostatic pressure in the cavity lowers the energy barrier for crystallite nucleation, favoring alpha-phase crystals even when cold steel pulls heat rapidly.
Pressure-Volume-Temperature Relations in Polyamide Matrixes
The thermodynamic behavior of polyamide melts follows Pressure-Volume-Temperature (PVT) state relationships. Isometric cooling lines on a PVT diagram show that higher packing pressure shifts the liquid-to-solid transition upward: increasing cavity pressure from atmospheric to 1000 bar raises the effective crystallization temperature of PA66 by nearly 20 degrees Celsius.
Chains realign during flow. Under shear stress through the runner and cavity, molecular chains orient parallel to the flow vector. In unreinforced grades, this causes anisotropic shrinkage ~ parallel shrink differs from transverse shrink because chains recoil entropically as they cool.
High cavity pressure restricts that recoil by holding molecular chains in place while the melt freezes.
Volumetric contraction drives dimensional change. Specific volume drops sharply as the melt passes through its crystallization window. If cavity pressure stays high during this drop, additional material flows in to fill the space left by densification.
If holding pressure drops or the gate freezes too early, that density jump leaves uncompensated shrinkage, showing up as sink marks or undersized dimensions.
Water absorption changes post-molding dimensions over time. Polar amide groups on the polymer chains form hydrogen bonds with atmospheric moisture, and water entering amorphous regions acts as a plasticizer, lowering glass transition temperature and causing isotropic swelling. Maximizing density with thorough cavity pressure packing leaves less free volume for water entry, muting post-mold moisture expansion.
| Cavity Pressure (bar) | Crystallinity Grade (%) | Parallel Shrinkage (%) | Transverse Shrinkage (%) | Post-Mould Moisture Swell (%) |
|---|---|---|---|---|
| 200 | 38.2 | 1.85 | 2.10 | 0.68 |
| 400 | 35.4 | 1.42 | 1.65 | 0.54 |
| 600 | 32.1 | 1.05 | 1.22 | 0.42 |
| 800 | 29.8 | 0.72 | 0.88 | 0.31 |
| 1000 | 28.5 | 0.51 | 0.62 | 0.25 |
Fiber Orientation Dynamics in Reinforced Formulations
Adding short glass fibers radically changes how polyamides shrink. Fibers pull flow-direction shrinkage below 0.3 percent because glass neither compresses nor contracts thermally at rates comparable to the polymer matrix. As a result, shrinkage in glass-filled grades is heavily anisotropic and dictated by fiber orientation.
Flow dynamics across the wall section build a core-shell fiber structure. High shear near the cold tool steel aligns fibers parallel to velocity, forming highly oriented outer shell layers. In the center, extensional flow and lower shear allow fibers to align transverse to main flow, forming a distinct core layer.
Cavity pressure controls the relative thickness of core and shell layers. Higher packing pressure keeps the central core molten longer, giving flow velocity gradients time to realign core fibers. Lower pressure lets the core freeze quickly, locking transverse fiber alignment in place.
Shifting cavity pressure from 300 bar to 900 bar changes the shell-to-core ratio and directly alters component warpage.
Downstream of core pins or wall section changes, converging melt fronts meet to form weld lines. Fiber orientation along the interface turns parallel to the seam, leaving virtually no glass reinforcement across the joint. High cavity pressure during weld formation pushes polymer chains and fiber ends across the interface, improving knit strength and reducing differential shrinkage stress across the boundary.
Anisotropic shrinkage generates internal residual stress. Low-shrinkage shell layers restrain core layers that want to shrink transversely. Upon ejection, those internal stress gradients relax, causing out-of-plane distortion.
A uniform, high cavity pressure profile reduces matrix density variation between shell and core, lowering the drive for post-mould warpage.

Wall Thickness Effects and Thermal Gradients
Transitions in wall thickness cause steep pressure drops. As melt flows from a thick section into a thin one, viscous resistance speeds up skin formation in the thin zone. When that thin section freezes early in holding pressure, it cuts off pressure transmission to downstream thick areas, leaving them to solidify without extra mass compensation.
Isolated thick sections develop sink marks or vacuum voids. When packing pressure cannot reach a cooling thick zone, volumetric contraction pulls the polymer inward off the mold walls, leaving surface sinks. If the outer skin is rigid enough to resist collapse, internal tension tears the molten center apart into spherical vacuum voids.
Both defects point directly to inadequate packing during solidification.
Cooling channel layout dictates steel surface temperature. Irregular waterline spacing creates hot spots on core pins and corners, slowing melt cooling and delaying gate seal locally. Under constant holding pressure, hot zones pack longer and reach higher density than adjacent cool areas.
These thermal gradients compound cavity pressure differences, worsening dimensional variation across the part.
Unreinforced grades shrink isotropically when molecular orientation remains randomized inside thick sections under slow cooling rates.

Transducer
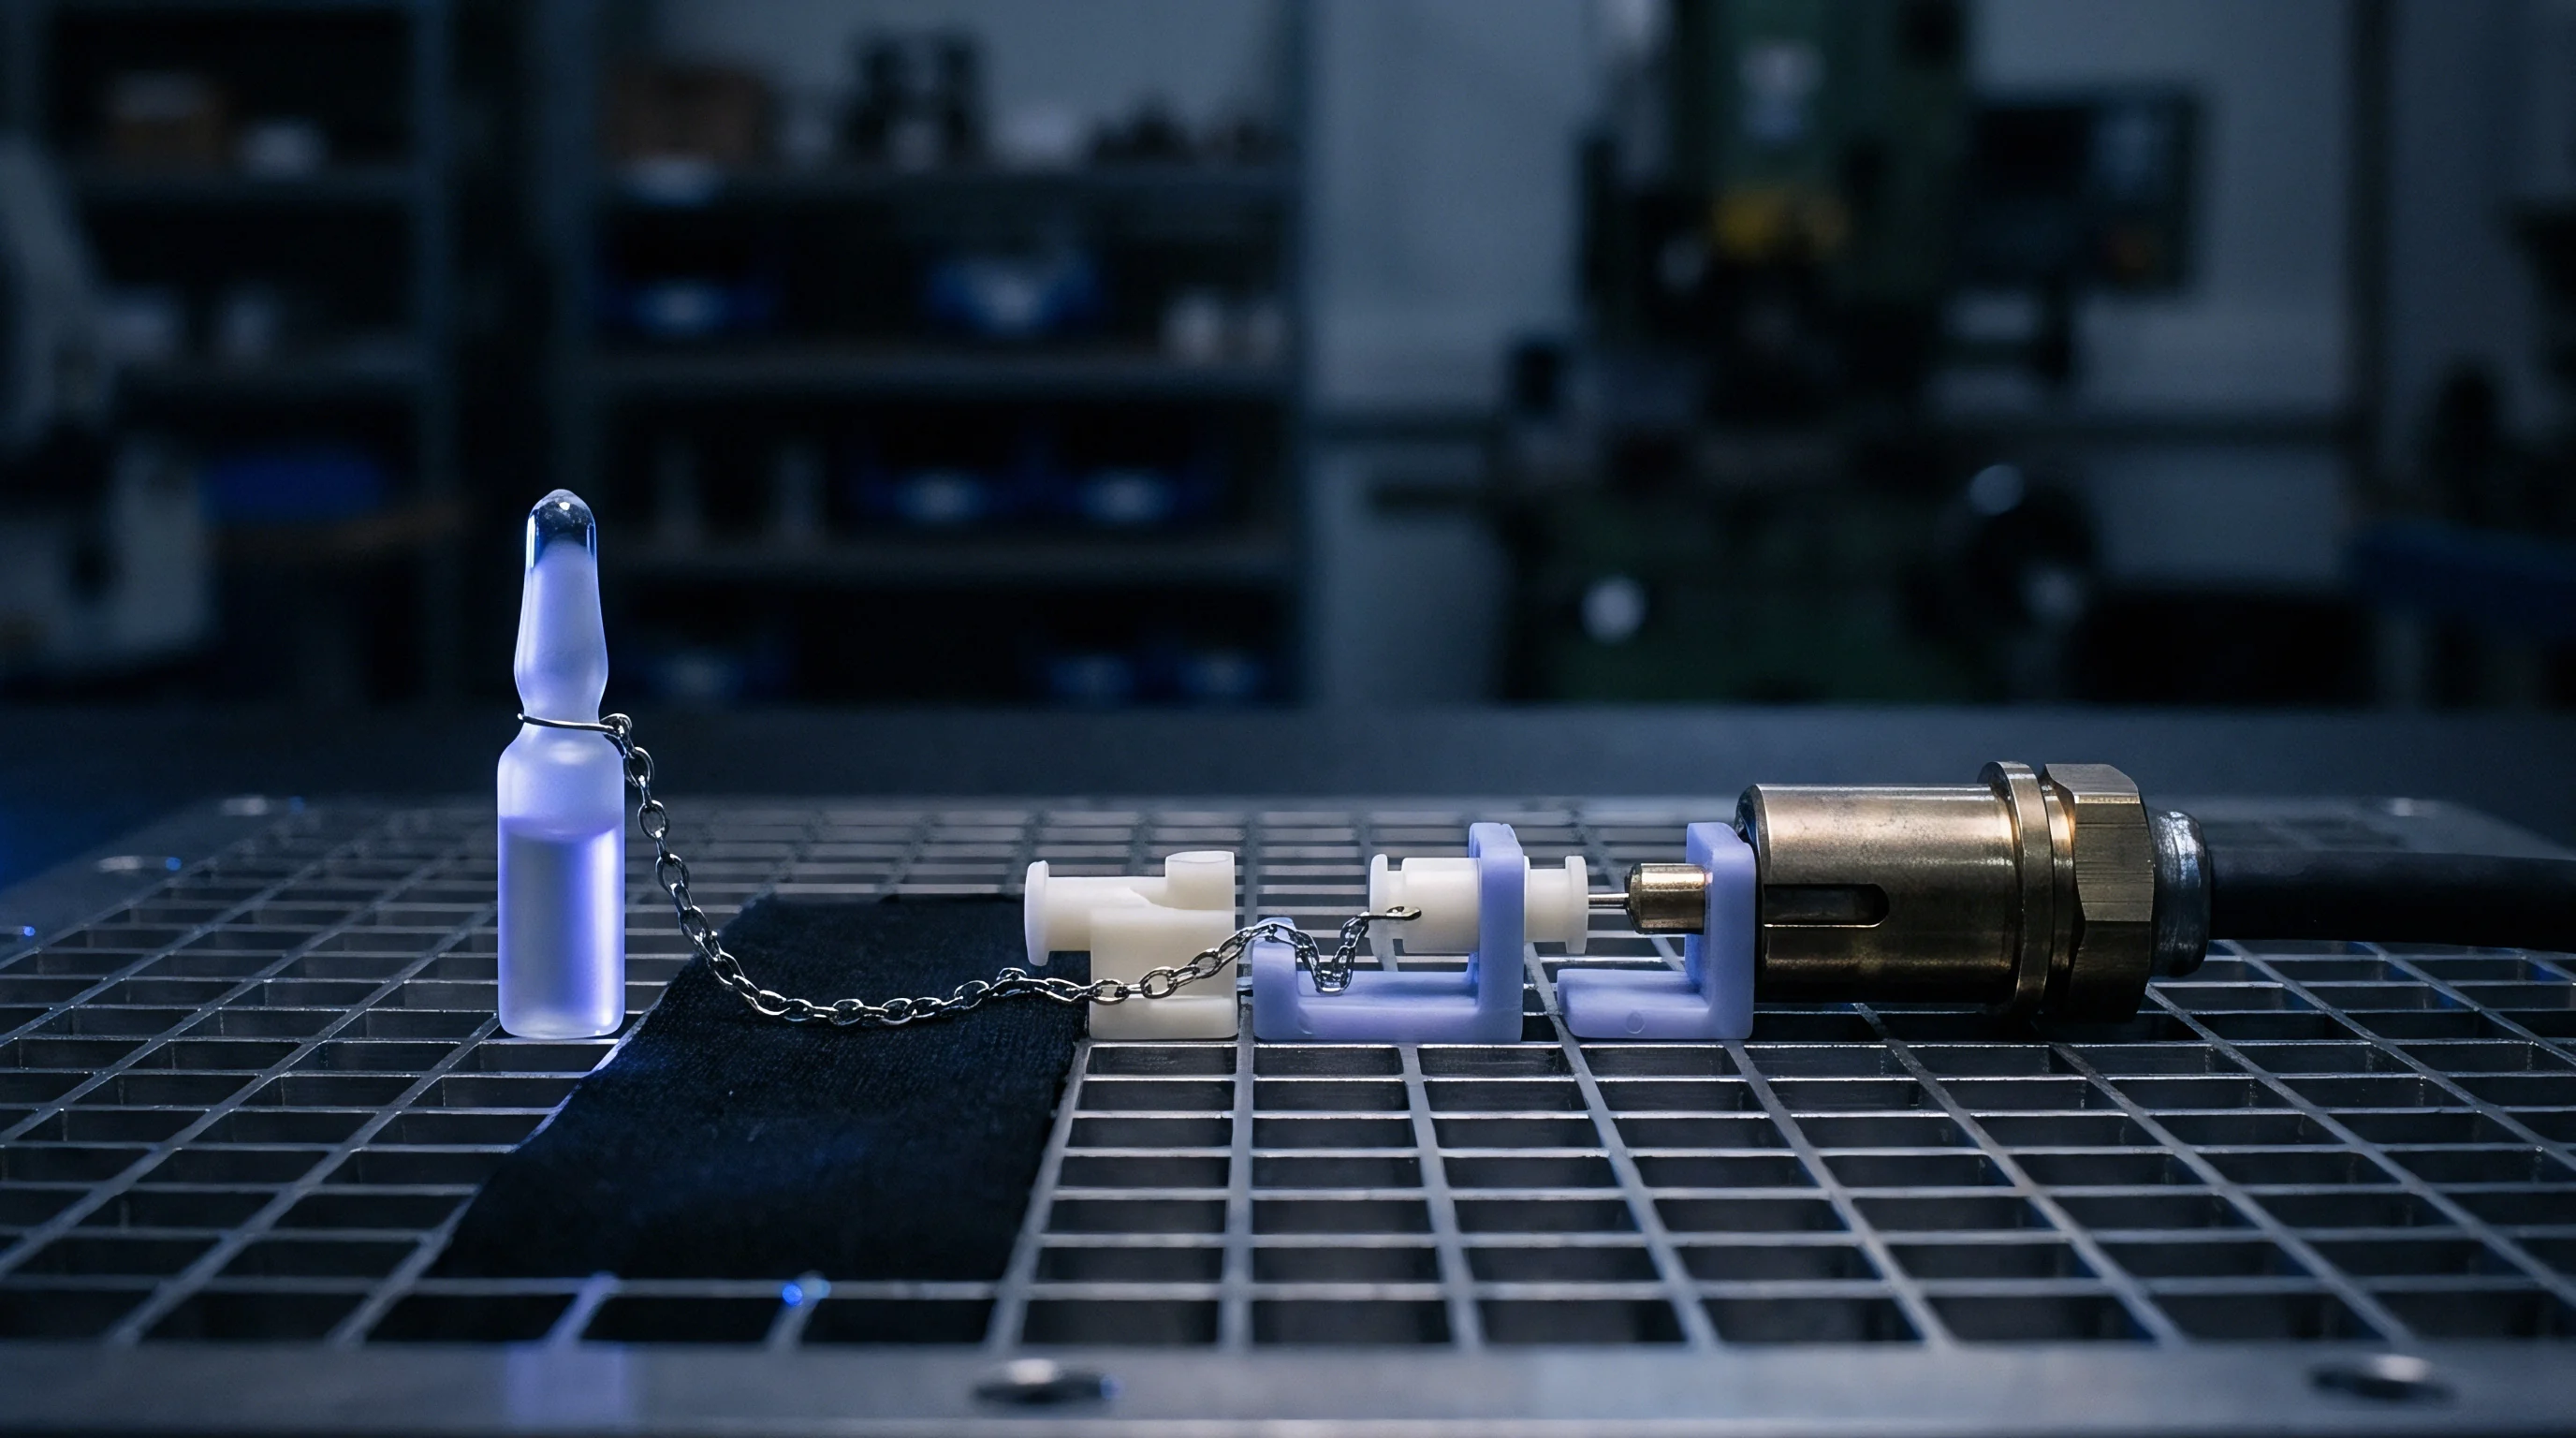
Optimizing modern injection processes requires measuring forces directly inside the mold cavity. Machine hydraulic gauges read pump pressure rather than melt conditions, and losses across valves, cylinders, screw flights, and runners make machine-side data too indirect for tight dimensional control. Piezoelectric quartz transducers installed flush with cavity walls or behind ejector pins capture real-time force right at critical part features.
Piezoelectric sensors measure actual force: pressure on a quartz crystal generates an electrical charge proportional to load, which amplifiers turn into a voltage trace over cycle time. Evaluating these cavity pressure curves reveals exact timing for fill completion, peak packing force, gate freeze, and residual cooling stress.

Piezoelectric Instrumentation and Sensor Placement
Sensors are best placed at pressure extremes along the flow path. A sensor near the main gate tracks maximum pressure delivery and gate seal timing, while a second sensor near the end of fill monitors minimum pressure and guards against short shots. Comparing pressure traces between gate and end-of-fill transducers defines the viscous loss profile of the melt under actual shear rates.
Direct wall-contact sensors touch the melt directly, sitting flush with cavity steel and leaving barely visible witness marks. Indirect sensors sit behind ejector pins, measuring force transmitted through the pin body. Because pin friction, binding, and thermal expansion introduce baseline drift on indirect sensors, setup requires careful calibration offset.
Cavity sensor signals drive switchover in decoupled molding. Decoupled II and III processes use cavity pressure thresholds to transition from high-velocity fill to pressure-controlled packing. Transferring from fill to pack at a set cavity pressure of 450 bar eliminates shot-weight variation caused by lot-to-lot melt flow changes in raw material.
Resin batch shifts alter viscosity. Adding regrind or absorbing ambient moisture changes melt rheology, making position-based switchover deliver erratic peak cavity pressures. Sensor-triggered transfer adjusts screw stroke displacement automatically to maintain steady peak cavity pressure despite minor viscosity shifts.
- Signal Grounding Check inspect sensor cable shielding and amplifier grounding to prevent electrical noise interference on low-charge quartz transducer circuits.
- Pin Clearance Verification confirm ejector pin hole clearances maintain 0.01 mm to 0.02 mm tolerances to prevent polyamide melt flash from binding indirect pressure transfer pins.
- Zero-Point Calibration balance charge amplifiers prior to tool heating to eliminate thermal zero-drift errors during cold tool initial setup.
- Dynamic Voltage Mapping capture baseline cavity pressure curves across twenty stable shots to establish upper and lower control limits for continuous process monitoring.
- Decoupled Switchover Tuning set stroke transition thresholds based on gate sensor pressure rise rate to ensure primary fill completes at ninety-nine percent volumetric capacity.
Real-Time Cavity Pressure Curve Diagnostics
A cavity pressure trace divides into four phases: filling, packing, holding, and cooling. Filling shows a gradual rise as melt enters and passes the sensor. Once the cavity reaches volumetric capacity, pressure spikes sharply ~ the slope of this spike indicating melt compressibility and tool stiffness under load.
Packing brings cavity pressure to its target peak, compressing melt into the geometry. Holding maintains that pressure, feeding additional material to offset thermal contraction. The instant cavity pressure begins an uninterrupted decay toward zero marks gate seal; any machine holding pressure applied after gate seal cannot alter part mass or final dimensions.
A sixty-bar pressure delta produces a 0.38 percent dimensional shift on a thirty-percent glass-filled polyamide six-six housing. The area under the pressure-time curve represents total packing energy transferred to the polymer matrix. Process control systems calculating this integral reject parts or stop the press when values drift outside control limits, keeping out-of-spec parts out of production lots.
An unexpected cavity pressure drop during holding signals gate backflow or premature press unloading. If hydraulic holding pressure falls below internal cavity pressure before gate seal, molten polymer flows backward through the gate. This sudden depressurization leads to sink marks, low density, and excessive shrinkage around the gate area.
Continuous curve monitoring catches tool mechanical issues early. Blocked venting traps air and resists packing, appearing as an abrupt pressure spike before full volumetric fill. Wear on core pin shutoffs or parting lines shows up as an inability to hold peak pressure as melt flashes out of the cavity.

Can Cavity Sensor Integration Eliminate Post-Mould Annealing Warp?
Post-mold heat treatment relieves internal stresses trapped during rapid cooling. Heating components above their glass transition temperature relaxes molecular chains and completes secondary crystallization. Managing cavity pressure to maintain uniform density reduces molded-in stress, leading many to question whether annealing cycles can be eliminated from production altogether.
Bypassing post-mold annealing depends heavily on stress symmetry. Multi-cavity tools with uneven pressure distribution produce parts with varying internal stress states. Closed-loop cavity pressure systems controlling individual valve gates can equalize packing energy across all cavities, minimizing cavity-to-cavity variation.
Complex shapes with wall thickness changes retain local cooling rate differences even under uniform pressure. Heavy intersections cool slower than thin ribs, generating residual thermal stress regardless of cavity pressure history. Uneven tool steel temperatures will continue to drive post-ejection warp despite precise sensor feedback.
Under what specific combinations of wall thickness variation and fiber loading does real-time cavity pressure management fail to maintain long-term dimensional stability in unannealed components?


Tolerance
Molded part drawings translate functional requirements into dimensions bounded by tolerances. While general standards like ISO 286 provide broad guidance, plastic moldings follow specific rules. DIN 16742 sets tolerance groups for injection-molded thermoplastics, taking into account resin shrink variance, tooling limits, and process stability.
Hitting tight tolerance classes in polyamide components requires matching cavity pressure consistency directly to tooling design.
Polyamides exhibit broader shrink variability than amorphous resins like polycarbonate or ABS. Unreinforced PA66 shows nominal shrinkage between 1.5 percent and 2.2 percent, while thirty percent glass-filled formulations demonstrate 0.3 percent to 0.8 percent parallel shrinkage. Tooling engineers scale steel dimensions using nominal shrink factors; if actual cavity pressure strays from design assumptions, final part dimensions drift outside drawing tolerance bands.

DIN 16742 Tolerance Class Calculations and Molded Steel Sizing
DIN 16742 ranks molding capability into Tolerance Groups from TG1 for ultra-precision tooling down to TG9 for general industrial parts. Target tolerance groups depend on resin selection, part dimensions, and process control. For polyamide 66, holding TG4 requires keeping cavity pressure variation within plus or minus 15 bar across an entire shift.
Steel cavity dimensions are calculated from standard linear expansion equations: cavity size equals nominal part size multiplied by one plus expected shrink. But shrink factor is not a constant ~ it varies with cavity pressure, wall thickness, and fiber alignment. Applying a single nominal shrink value across a complex part with varying wall sections guarantees dimensional issues.
Pressure variations change effective shrink rates across different features on the same part. A dimension near the gate sees high packing pressure and low shrink, while a feature farther downstream under lower pressure shrinks significantly more. To hold tight tolerances on both, toolmakers must scale cavity steel differentially ~ cutting near-gate features for low shrink and scaling distant areas for higher shrink.
Applying a uniform linear shrink factor to complex polyamide part drawings causes localized out-of-tolerance features due to internal cavity pressure drop along the flow channel.
Steel deflection under high pressure also introduces dimensional error. Cavity pressures up to 800 bar push hard against sidewalls, core pins, and parting lines, flexing tool steel elastically. A cavity wall that flexes outward by 0.04 mm during packing thickens the part wall locally, altering local cooling and shifting volumetric shrink upon ejection.
Backing plate thickness and support pillar placement govern steel flexure. Poor support behind cavity blocks allows the parting line to breathe under peak pressure. This dynamic opening produces flash, drops effective cavity pressure, and introduces wall thickness variations that ruin part symmetry and destroy tight tolerances.
| Tolerance Group (TG) | Control Capability Level | Permissible Cavity Pressure Delta (bar) | Achievable Tolerance on 50 mm Feature (mm) | Primary Failure Mode |
|---|---|---|---|---|
| TG3 | Closed-loop Cavity Control | +/- 10 | +/- 0.08 | Tool Steel Wear |
| TG4 | Scientific Decoupled Molding | +/- 25 | +/- 0.12 | Viscosity Shifts |
| TG5 | Standard Machine Hydraulic Control | +/- 65 | +/- 0.18 | Cushion Drift |
| TG6 | Open-Loop Manual Setup | +/- 100 | +/- 0.28 | Volumetric Sink / Warp |

Part Geometry Design Guidelines for Pressure Uniformity
Maintaining uniform wall thickness is the primary design rule for polyamide parts. Wall changes should use gradual tapers rather than abrupt steps; transition angles over 15 degrees disrupt melt velocity, causing localized pressure drops and flow stagnation. Uniform wall sections allow linear pressure distribution from gate to vent.
Rib design must guard against sink at the base wall. Rib thickness at the intersection root should not exceed 50 percent to 60 percent of the main wall thickness. Thicker rib bases create heavy volumetric zones that stay molten long after thin rib walls freeze.
Packing pressure cannot reach these isolated areas, causing surface sinks or internal voids.
Mounting bosses require consistent wall thickness and deliberate flow paths. Tying a cylindrical boss directly into a thick outer wall creates an unwanted mass concentration. Core pins forming internal diameters require good cooling to pull heat quickly, preventing localized thermal buildup that resists packing and helping hold outer diameter tolerances.
Proper draft angles ensure ejection without part damage. As polyamides cool, they shrink tightly onto core pins. Insufficient draft forces ejector pins against warm resin, leaving pin indentations, stress whitening, or warped geometry.
Higher packing pressure increases how tightly the resin grips internal cores, requiring extra draft on inside surfaces.
Corner radii reduce internal stress and fluid pressure drop. Sharp inside corners disrupt melt flow, driving up local shear and static pressure loss. Radii between 50 percent and 75 percent of nominal wall thickness smooth the flow path, reducing viscous drag and ensuring pressure reaches downstream features.

Standard Compliance Mechanics
Dimensional compliance testing follows environmental protocols in ISO 294 and ISO 20753. Molded polyamide parts must age under controlled conditions before final CMM inspection, as post-mold shrinkage continues for 24 to 48 hours while crystallization completes and moisture absorption begins.
Inspection reports should always state part conditioning status. Dry-as-molded dimensions measured right off the press differ noticeably from conditioned dimensions taken after moisture equilibration. Quality agreements must specify whether drawing tolerances apply to dry-as-molded or fully conditioned parts to avoid disputes over normal atmospheric moisture swell.
Quality sampling must span the full production run. Checking first-article shots off a cold mold fails to catch dimensional drift caused by thermal buildup or cushion movement during a shift. Capability studies require continuous sampling over at least twenty-four hours to prove process stability across resin lots.
DIN 16742 Clause 8.2 explicitly mandates that drawing tolerances apply strictly to parts measured after a minimum conditioning period of 24 hours at 23 degrees Celsius and 50 percent relative humidity, transferring liability for moisture-induced post-mould expansion to the receiving inspection protocol if measurements are conducted immediately upon press ejection.
Amortization
Tooling capital is a major upfront commitment in polyamide molding programs. Steel choice, cavitation count, runner design, and in-mold sensors drive tooling costs before the first production part drops. Balancing initial capital against part price requires realistic modeling of tool life, cycle times, yields, and maintenance costs under expected cavity pressures.
High cavity pressures required for tight tolerances put heavy mechanical loads on tool components. Running packing pressures above 800 bar calls for hardened tool steels like H13 or S7, premium guiding components, and thick structural plates. Designing tools for these pressures increases initial mold cost by 15 percent to 25 percent over low-pressure tooling, but allows shorter cycle times and tighter dimensional capability.
Cavitation Strategy and Production Economics
Cavity count dictates piece price and annual capacity. Single-cavity prototype molds establish basic process windows at low initial tool cost, but carry high piece prices because one part absorbs the full machine hourly rate. Multi-cavity production tools divide press rates across multiple components, lowering piece cost until runner volume and pressure drop offset scale economies.
Runner geometry dictates pressure balance across multi-cavity tools. Standard fishbone layouts introduce uneven flow lengths, delivering higher packing pressure to inner cavities than outer ones. Inner cavities yield dense, low-shrink parts, while outer cavities produce lighter, high-shrink parts.
Naturally balanced H-pattern runners deliver equal flow length and pressure to every cavity, keeping dimensions uniform across the tool.
Hot runner systems eliminate runner scrap and cut pressure drop. Valve-gated hot runners offer independent control over gate timing and packing duration per cavity. However, hot runner manifolds add substantial upfront capital.
A 16-cavity valve-gated hot runner tool for a small polyamide electrical housing carries a heavy premium over a cold-runner design, requiring clear amortization analysis based on total production volume.
Break-even analysis weighs upfront capital against operating savings. High-cavitation molds running under closed-loop cavity pressure control reduce cycle times by cutting holding time the moment gates freeze. Trimming cycle time by 1.5 seconds across a two-million-unit annual production run yields savings that offset transducer and hot runner investment within the first year.
- Tool Steel Hardness Standard specify P20 steel for low-pressure prototype tools, but mandate hardened H13 stainless steel at 48-52 HRC for production molds operating under cavity pressures above 700 bar.
- Parting Line Preload Margin engineer tooling parting surfaces with minimum 0.05 mm preload shutoff pads to resist dynamic mold deflection and flash under peak cavity packing force.
- Runner System Pressure Balance mandate naturally balanced H-pattern flow paths or valve-gated hot runners for multi-cavity tools to limit cavity-to-cavity pressure variance below 3 percent.
- Sensor Cost Capitalization incorporate piezoelectric cavity pressure transducer costs directly into the tooling capital budget rather than auxiliary equipment budgets to preserve single-source toolmaker qualification.
- Steel Refitting Provision establish formal contract clauses governing financial liability and lead time allocations for post-T1 mold modification recuts required to land tight dimensions.

Steel Safe Decisions and Tooling Modification Costs
Toolmakers rely on steel-safe design to manage shrinkage uncertainty, cutting internal cavity features intentionally small and external features large. If first-shot parts shrink more than expected due to low packing pressure, technicians machine away excess steel to open outer walls or trim internal core pins. Adding metal back via laser welding or plate replacement adds significant cost and delays launch schedules.
Post-T1 steel modifications carry major financial risk on precision tooling projects. Machining hardened H13 steel via EDM or CNC milling requires shop hours and secondary polishing. A major dimensional correction on a complex multi-cavity mold can cost tens of thousands of dollars and delay launch schedules by four to six weeks.
Optimizing cavity pressure during initial mold trials minimizes steel recuts. By varying holding pressure across a scientific molding test matrix, engineers find process windows that pull critical dimensions into tolerance without touching the steel. Tool steel is modified only after proving that process adjustments alone cannot bring all features into compliance simultaneously.
Tooling contracts should assign financial responsibility clearly. If a toolmaker cuts cavity steel to agreed nominal dimensions scaled by the buyer’s specified shrink factor, but parts miss tolerance due to material shrink variance under agreed pressures, the buyer covers recut costs. If the mold builder strays from specified steel sizing or runner balance guidelines, modification expenses fall on the tool shop.

Landed Cost Arithmetic and Long-Term Warranty Exposure
Total landed cost for a molded polyamide part includes raw material, press hourly rates, tooling amortization per piece, scrap allowances, and warranty risk. Operating tools with unstable cavity pressure drives up scrap rates, adding unit cost through sorting labor and wasted resin.
Out-of-spec parts escaping factory inspection create major commercial risk. Non-conforming polyamide components installed in automotive engine compartments or industrial machinery can fail in service from improper fit or locked-in warp stress. Field failures trigger recalls, sorting operations, and warranty claims that dwarf initial tooling savings.
An unbalanced four-cavity runner layout forced outer cavities to sink while inner cavities flashed, incurring a thirty-four thousand dollar tooling modification charge. That outcome reinforces the need to verify runner balance through flow simulation and cavity pressure sensors before releasing tool designs for steel cutting. Upfront capital spent on pressure monitoring hardware prevents costly secondary rework during production bring-up.
Process stability maintained through scientific cavity pressure control protects part economics across the product lifecycle. Consistently packed moldings show uniform weight, minimal warp, predictable mechanical strength, and zero voiding. Production lines run at higher overall equipment effectiveness, avoiding downtime for flash clearing, vent cleaning, or pin binding.
Tool ownership contracts should clearly define responsibilities for preventive maintenance and overhaul. Molds operating under high cavity pressures suffer parting line wear, guide pin fatigue, and ejector hole wear over millions of cycles. Supply agreements must state whether piece pricing includes a tooling maintenance reserve to refurbish worn inserts before dimensional drift causes lot rejections.