Meaning
A graphical representation shows the relationship between shear rate and shear stress for a fluid during a specified processing condition. A viscosity curve characterizes the non-Newtonian behavior of thermoplastic polymers by mapping how internal resistance to flow shifts across increasing levels of mechanical deformation. Engineers rely upon these data points to identify the threshold where a material transitions from a stable melt state into a condition of shear thinning or structural breakdown.
The relationship remains valid only while the temperature of the polymer melt stays constant, because heat fluctuations introduce variables that the plot cannot account for alone. This measurement defines the rheological footprint of a resin grade and distinguishes its specific performance under high-speed injection cycles.
Rheological Profile
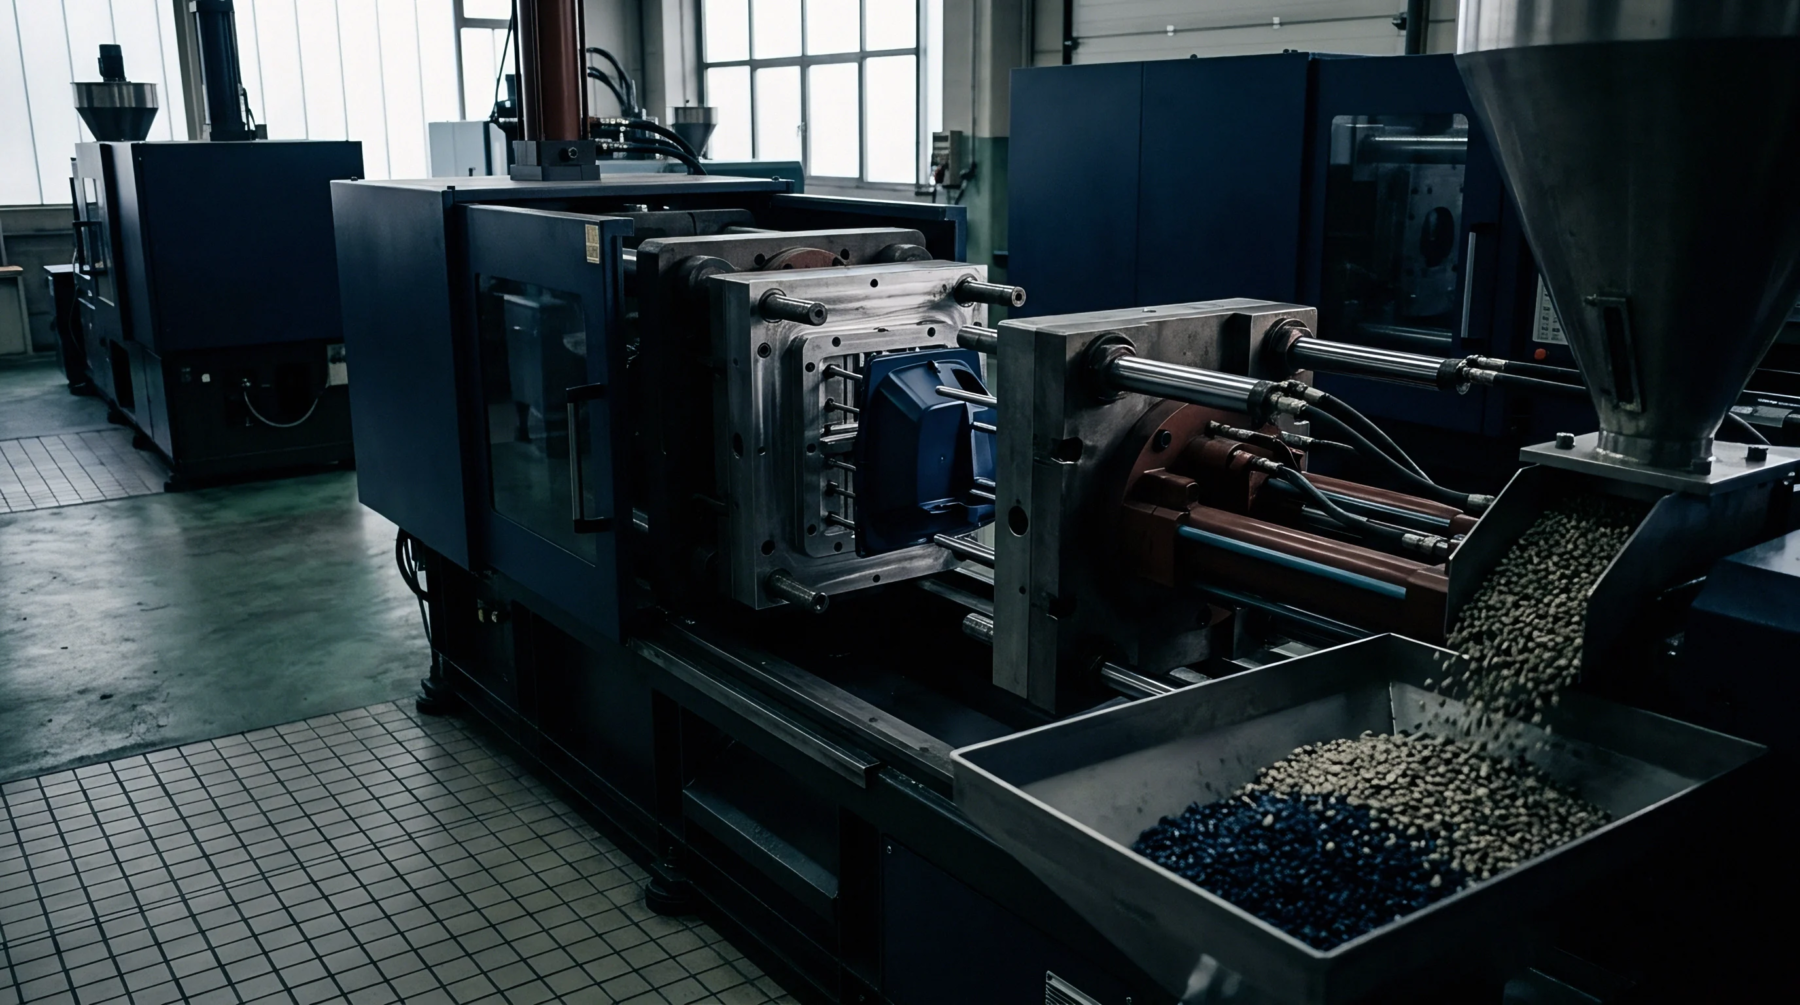
Variations across the measured line dictate how a polymer behaves inside the narrow gates and runners of an injection mould. If the resin exhibits a steep drop in resistance as shear increases, the material fills complex geometry with lower clamping force requirements. High-viscosity grades demand more pressure to achieve equivalent mould coverage, which creates excess heat through friction and leads to polymer degradation.
Moulders compare the laboratory plot against actual machine pressure logs to calibrate the injection speed for a production run. Stable production requires that the resin matches the design intent for flow, otherwise the gate freezes prematurely or the part develops inconsistent density. Small adjustments to the processing temperature shift the entire curve upward or downward, so operators verify that the feedstock characteristics remain within the permitted margin of the original technical data sheet.
Operational Variance
Virgin materials often behave differently than regrind batches when analyzed through these graphical outputs. Regrind cycles reduce the average molecular weight of a plastic, which typically lowers the base resistance to flow compared to the original virgin grade. Manufacturers accept these performance changes as part of the total cost structure for molding operations, yet they must monitor the shift to prevent structural defects.
Parts produced from degraded material demonstrate weakness or brittleness because the internal chain structure no longer handles the stress of high-speed injection. A moulder tracks the flow behavior over multiple cycles to separate natural batch differences from genuine material breakdown. Every material change forces a revalidation of the process window to maintain the final part dimensions.
Processing Limit
Excessive shear stress triggers a failure in the polymer chain length which destroys the structural integrity of the final part. This physical boundary creates the upper limit for how fast an injection system can force molten material into a cavity. Engineers design the runners to minimize the distance the resin travels before the viscosity rises to a point where solidification begins.
Exceeding these mechanical limits leads to localized burning or poor surface finish on the finished product. Proper interpretation of the shear data prevents the waste of expensive resin by keeping the moulding speed inside the safe operating range. The mechanical properties of a moulded object depend on the stable flow behavior of the material during the injection phase.