Establishing Press Side Verification Protocols for Multi Cavity Injection Moulding Tooling
Press-side verification requires dynamic fill balance testing, telemetry pressure mapping, and individual cavity Cpk qualification before tool release.

Melt
Polymer moving through a geometric runner tree experiences shear rate variations that change viscosity between inner and outer cavities. As the melt negotiates a ninety-degree turn, high shear builds along the outer channel wall, where localized friction thins the resin. The secondary branch split inherits these thermally uneven layers, shunting warmer, lower-viscosity material into certain cavities and cooler, stiffer material into others.
Standard symmetrical layouts frequently fail to deliver uniform flow front velocities because flow symmetry does not guarantee shear symmetry.
In high-cavitation tooling, shear-induced flow imbalance shows up as uneven cavity fill times, variable volumetric shrinkage, and inconsistent part mass. Cavities fed by warmer laminar zones pack with denser resin before the gate freezes. Peripheral cavities receiving cooler melt suffer premature gate seal, causing sink marks, internal voids, and lower part weights.
Operators often try to compensate by raising holding pressure or barrel temperature, but that overpacks the hotter cavities ~ leading to parting-line flash and internal stress concentrations that trigger environmental stress cracking down the line.
Tooling geometry often exacerbates these dynamic flow splits. H-pattern and radial branch systems exhibit distinctly different rheological behavior on the shop floor. Radial runners maintain equal flow lengths from the central sprue, but cooling variations along the circular mold plate perimeter create radial thermal gradients.
H-pattern trees keep cooling channels orthogonal, yet their multiple shear-splitting junctions deliver uneven resin streams to inner and outer cavity quadrants.
Symmetrical channel geometry in runner layout design does not ensure equal shear rates or identical fluid viscosity across multi-cavity split points.
Shear imbalances typically emerge when runner trees transition from primary to secondary splits. Correcting this behavior press-side requires systematic diagnostic steps rather than trial-and-error adjustments, as the mechanisms driving cavity-to-cavity flow divergence produce distinct physical defects across the tool plate.
- Non-Symmetrical Shear Thinning occurs when polymer melt splits at T-junctions, carrying high-shear outer layers into specific sub-runner branches while low-shear core material enters adjacent channels.
- Thermal Gradient Drift develops when mold cooling lines run parallel to runner branches, creating temperature differentials between central mold inserts and peripheral cavity blocks.
- Viscous Energy Dissipation converts pressure loss into thermal energy inside narrow runner channels, selectively raising polymer temperature along longer flow paths.
- Gate Freeze Asynchrony happens when localized melt temperature variations cause individual cavity gates to solidify at different times during the holding phase.
Geometric Runner Trees and Shear Distribution
Maintaining flow balance across an eight, sixteen, or thirty-two cavity mold depends on equal viscosity and pressure at every gate entrance. Melt flipper inserts alter the fluid boundary layer between runner branches: by turning the highly sheared outer layer into the center of the secondary stream, they redistribute thermal energy before resin reaches the cavity gate.
Without melt manipulation hardware, runner dimensions have to be adjusted to balance flow resistance against viscosity drops. Enlarging channel diameter reduces fluid velocity and shear rate, which paradoxically increases viscosity in pseudo-plastic resins. Narrowing the runner boosts shear and thins the melt, but spikes the pressure drop.
Balancing these opposing factors across complex tool topologies demands empirical pressure mapping at every branch node.
The interaction between polymer shear sensitivity and runner geometry dictates the tool’s operating window. Polypropylene and polyethylene exhibit steep shear-thinning behavior, making them vulnerable to shear imbalance in tree-style layouts. Polycarbonate and polymethyl methacrylate behave more like Newtonian fluids at typical shear rates, so their flow front distribution depends far more on wall temperature and channel cross-section.

Thermal Manifold Uniformity and Gate Geometry
Hot runner systems replace cold sprues with heated manifold blocks containing internal flow passages. Thermal non-uniformity across the manifold produces cavity fill defects identical to those caused by shear imbalance. Heating elements along the manifold must maintain thermal stability within two degrees Celsius across all drop locations.
Heat loss into the mold backing plate creates cool spots at corner drops. Resin passing through these cooler nozzles encounters higher flow resistance, delaying cavity fill during primary injection. Press-side diagnostics need to isolate manifold heater calibration errors from mechanical runner discrepancies before making any steel modifications.
Gate dimensions dictate the final pressure drop into each mold impression. Over time, wear on valve gate pins or thermal erosion of direct tip gates widens the gate land cross-section. Increasing gate diameter by just fifty micrometers lowers localized shear and alters fill sequence across the tool plate.
Checking gate dimensions with pin gauges or an optical comparator is a mandatory step before qualifying the process window.
How do thermal gradient shifts across hot runner manifolds alter localized cavity pressure when runner channels are geometrically balanced?


Telemetry
Integrating transducers directly into multi-cavity tooling enables precise tracking of cavity fill, packing, and cooling dynamics. Pressure sensors mounted behind ejector pins or flush against cavity walls capture localized pressure profiles throughout the injection cycle, revealing split-second fluid behavior that press-level hydraulic or screw-position sensors miss.
Piezoelectric pressure sensors rely on quartz crystals that generate electrical charge proportional to applied mechanical force. When liquid polymer fills the cavity and presses against the ejector pin, force transfers to the sensor element. The resulting charge passes through an amplifier, producing a continuous pressure curve over time that serves as the benchmark for individual cavity performance.
Analyzing pressure curves isolates the distinct phases of filling and solidification. A steep initial pressure rise marks the arrival of the flow front at the sensor. Peak pressure indicates maximum packing force before gate seal, while the decay slope tracks volumetric contraction and cooling until ejection.
Comparing these curves across active cavities exposes real-time mechanical imbalances inside the mold.
| Sensor Type | Measurement Location | Response Time | Operating Range | Press-Side Setup Complexity |
|---|---|---|---|---|
| Piezoelectric Force Sensor | Behind Ejector Pin | Less than 1 millisecond | 0 to 2000 bar | Moderate wire routing through ejector plate |
| Direct Piezoelectric Sensor | Cavity Surface Flush | Less than 0.5 milliseconds | 0 to 2500 bar | High precision machining of cavity wall required |
| Strain Gauge Sensor | Sub-Runner or Pin Base | 2 to 5 milliseconds | 0 to 1000 bar | Low alignment sensitivity with standard wiring |
| Infrared Melt Temperature Sensor | Cavity Wall or Runner Split | 10 to 20 milliseconds | 50 to 400 degrees Celsius | Requires optical window optical path maintenance |
Cavity pressure sensors can be set to trigger press holding phase transfers automatically. Switching from velocity-controlled filling to pressure-controlled packing based on cavity pressure eliminates shot-to-shot volumetric variation from check ring slippage or viscosity fluctuations. Decoupling press mechanical variance from cavity filling dynamics improves dimensional repeatability across all impressions.
Cavity pressure telemetry recorded at a 100 Hz sample rate identifies gate seal timing differences down to 50 milliseconds across multi-impression tooling.
Piezoelectric Pressure Instrumentation at the Gate
Sensors installed immediately downstream of the gate capture the exact moment polymer enters each impression. The time delta between the first and last cavity receiving melt defines the fill imbalance window. In a balanced multi-cavity tool operating at high injection velocities, this delta stays under twenty milliseconds.
Peak cavity pressure values must remain in a tight band across all impressions to maintain uniform density and shrinkage. A pressure spread exceeding eight percent between the highest and lowest cavity produces dimensional variation beyond standard tolerance limits. Press-side protocols set strict limits on peak cavity pressure standard deviation before approving automated production runs.
Calculating the integral pressure value ~ the area under the cavity pressure curve during packing and cooling ~ correlates directly with final part weight and density. Tracking pressure integrals across shifts detects subtle process drift caused by ambient temperature changes, mold cooling line fouling, or lot-to-lot melt flow variations.
Melt Temperature Sensors and Viscosity Tracking
Infrared pyrometers and fast-response thermocouples mounted directly in the runner stream measure dynamic melt temperatures during high-speed injection. Frictional heating in narrow runners often drives actual melt temperatures above press barrel setpoints. Tracking this localized heating allows operators to adjust screw speed and back pressure without degrading heat-sensitive resins.
Apparent viscosity is calculated continuously press-side by correlating cavity pressure rise rates with hydraulic screw velocity. When resin viscosity drops during a run, pressure transfers faster, risking localized flash. Conversely, higher viscosity lowers peak cavity pressure, leading to short shots or sink marks.
Control systems automatically adjust barrel temperatures or transfer positions when telemetry signals cross statistical boundaries.
Wire routing and signal shielding inside the mold demand careful design. High-voltage lines from heater bands readily induce electrical noise on millivolt sensor signals. Multi-pin quick-disconnect connectors on the top clamp plate protect sensitive wiring during tool changes while maintaining reliable ground connections to the telemetry interface.
As a practical rule, sensor pins sitting behind ejector locations require flat, polished contact faces to prevent localized stress risers on finished cosmetic surfaces.

Vent
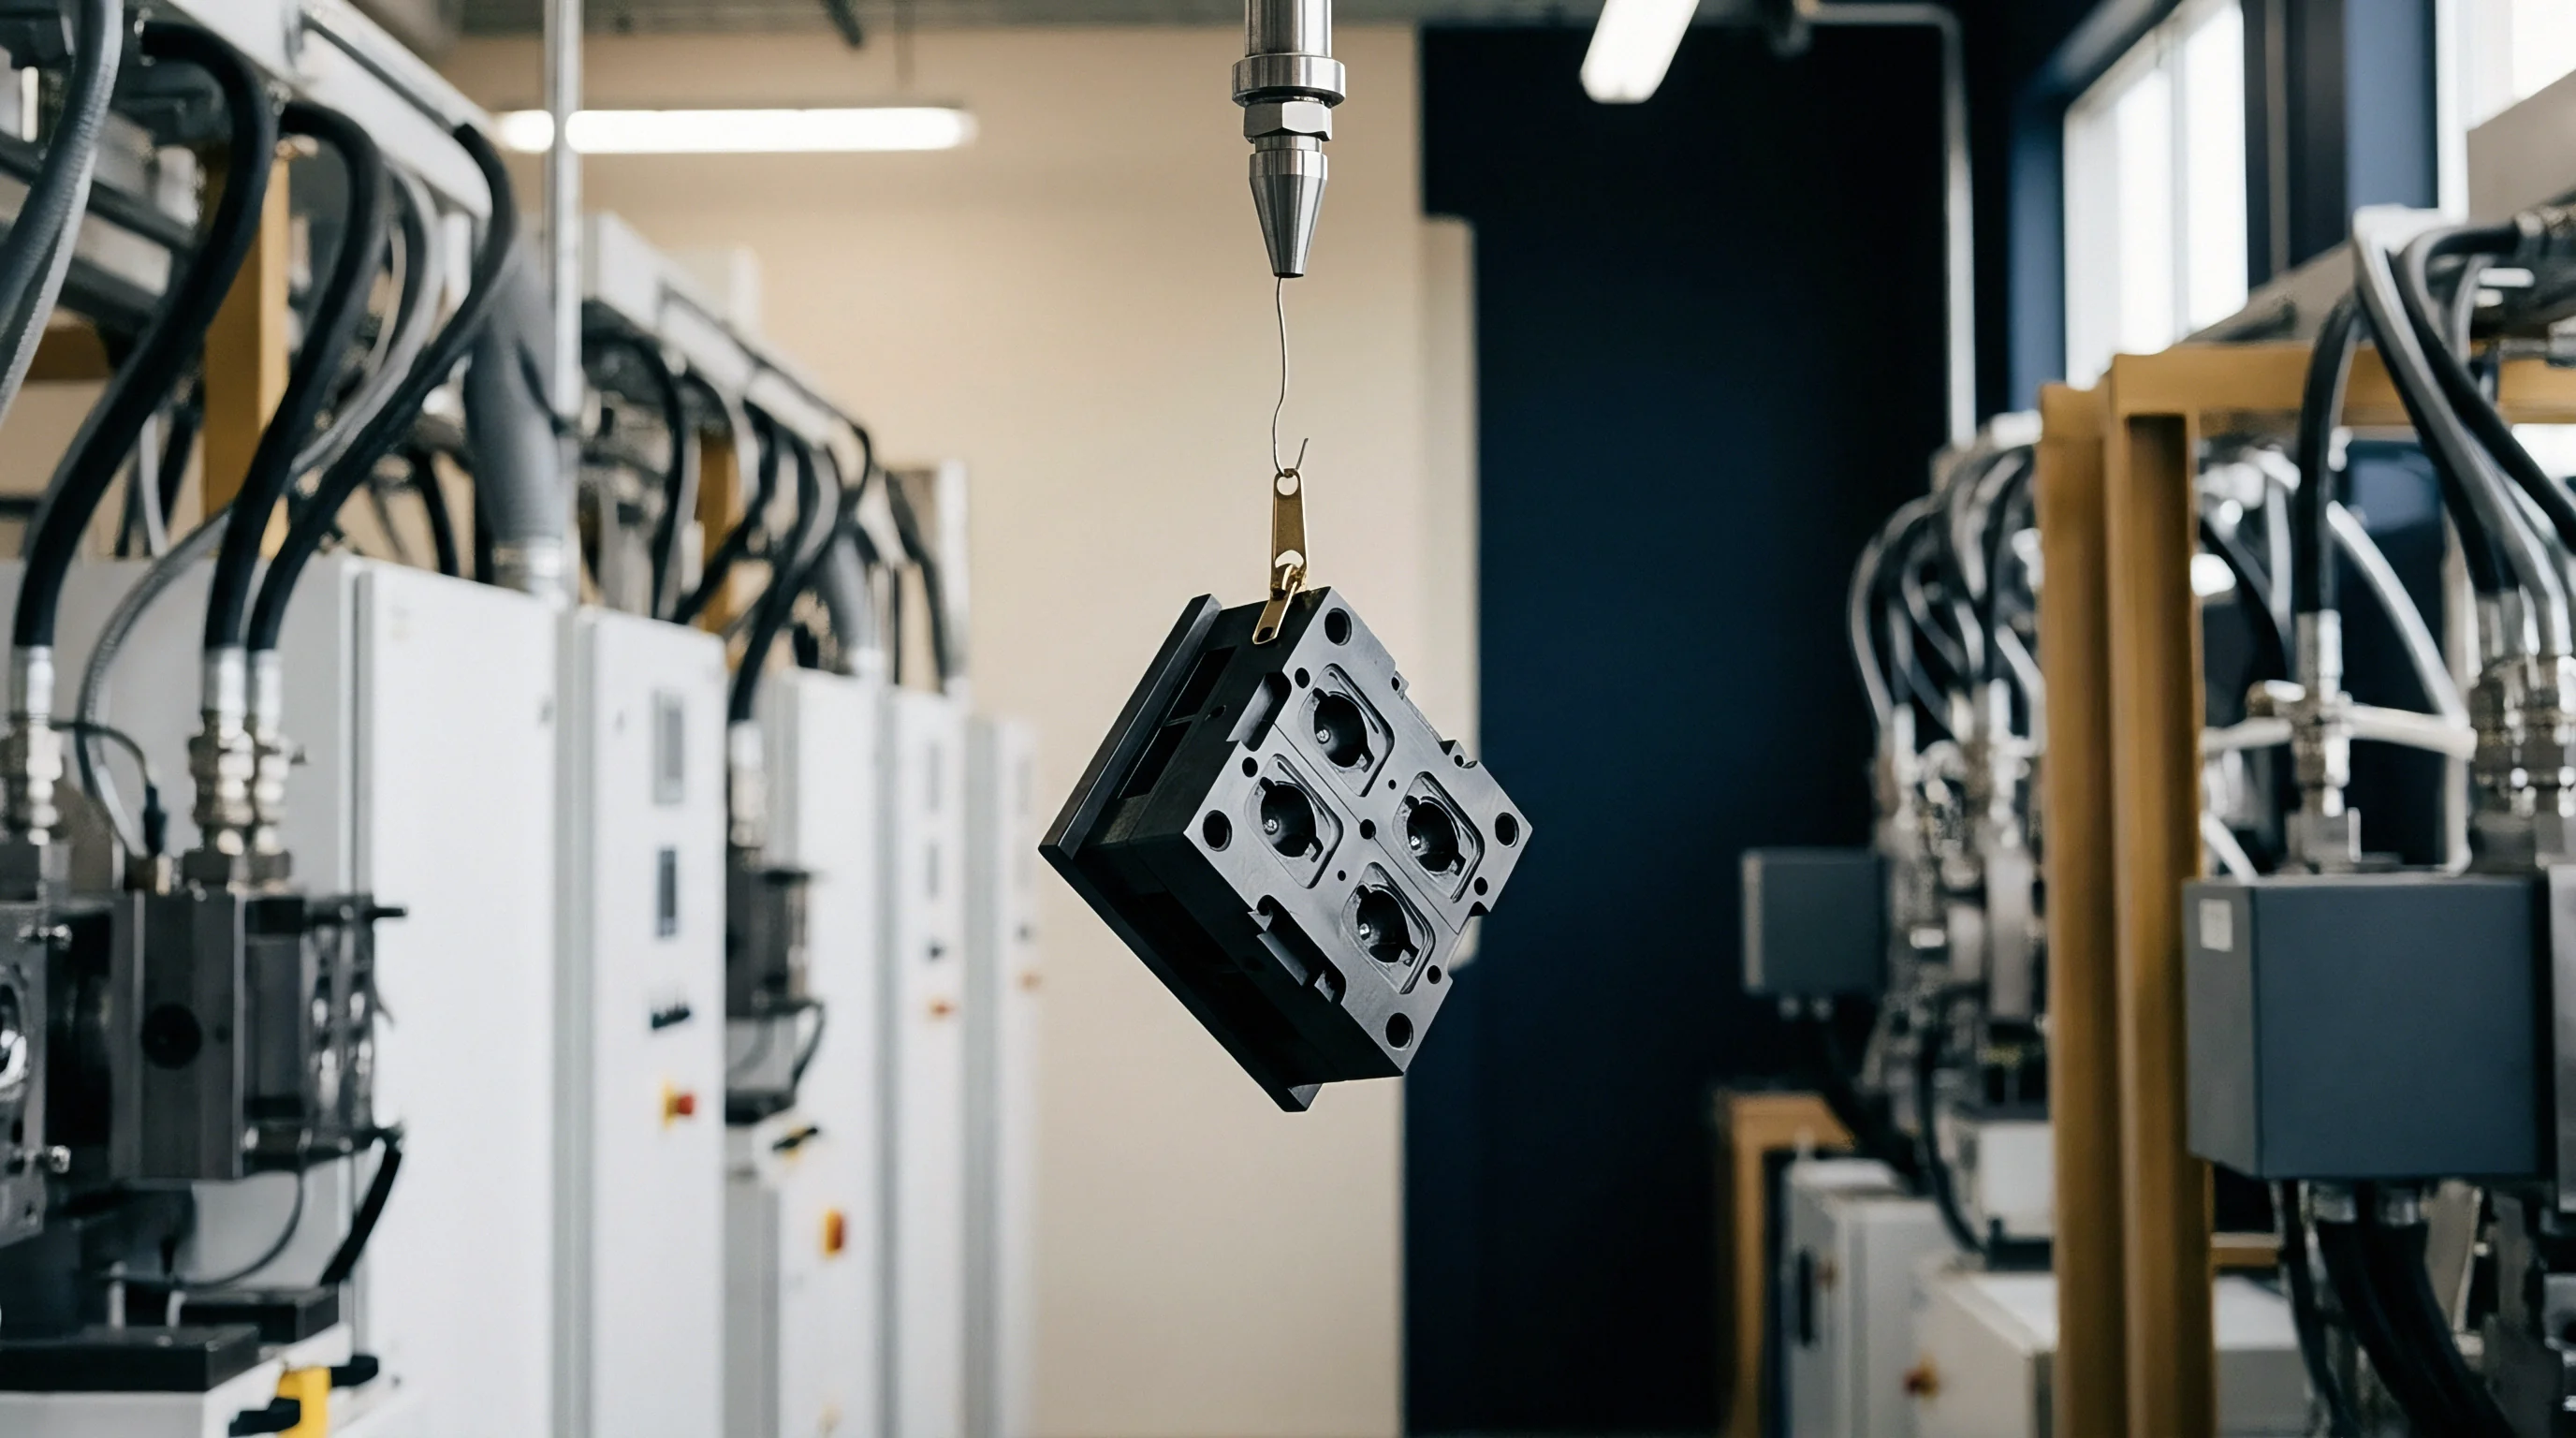
Air evacuation during high-speed filling determines cavity fill completeness and surface finish consistency. As molten resin enters a closed cavity, trapped air compresses rapidly. Inadequate venting converts this gas into an insulating thermal barrier that resists melt flow, spikes localized cavity pressure, and ignites trapped atmospheric oxygen through adiabatic compression.
Vent depth design must match the rheological properties of the resin grade. Unfilled crystalline polymers like nylon 66 demand tight vents between ten and fifteen micrometers to prevent flash. Amorphous polymers like ABS tolerate depths between twenty-five and forty micrometers.
Oil contamination, micro-cracks, or resin residue in vent channels reduce effective clearance over extended runs.
Sub-short fill balance testing provides the empirical method for evaluating flow front distribution and gas trapping press-side. Interrupting the injection stroke in increments from fifty to ninety-nine percent of total part volume reveals the true filling pattern before holding pressure packs the cavity. This test exposes fill sequence anomalies invisible in fully packed parts.
- Purge the machine barrel completely and establish stable thermal equilibrium on barrel zones and mold temperature control units.
- Disable holding pressure entirely and set switchover position to transfer from injection speed to holding phase at ninety-five percent of total shot weight.
- Reduce injection speed to a low baseline rate and perform a shot to confirm complete absence of flash or over-packing.
- Decrease injection stroke in five percent volume decrements, collecting complete shot sets from each step until short shots exhibit clear flow fronts across all cavities.
- Weigh every individual part from each short-shot set on a calibrated analytical balance sensitive to 0.1 milligrams.
- Calculate the fill balance percentage ratio by dividing the mass of the lightest cavity part by the mass of the heaviest cavity part within the same shot set.
- Plot part mass distribution per cavity against cavity layout position to pinpoint physical flow paths subject to shear imbalance or thermal restrictions.

Short-Shot Progression and Mass Distribution
Evaluating short-shot weight distribution reveals true fill balance without packing pressure masking the results. At eighty percent volumetric fill, a properly balanced tool shows mass variation under three percent across impressions. Variations exceeding five percent point to structural flow resistance in runner channels or thermal imbalances across hot runner nozzles.
Sequential photographs taken during short-shot progression create visual maps of air displacement vectors. Uneven flow fronts trap air against parting lines, core pins, or blind ribs. If trapped air cannot escape through perimeter vents or vacuum extraction channels, localized backpressure stalls the flow front, causing burn marks, resin oxidation, or incomplete weld line fusion.
Uncorrected thermal gradient shifts across manifold zones frequently cause sample lot failures during T1 trials. Empirical tracking shows that part weight uniformity at full pack does not guarantee uniform cavity fill rates during high-velocity injection phases.

Press-Side Execution of Fill Balance Testing
Fill balance verification requires strict control over machine parameters. Melt temperature, injection velocity, hydraulic back pressure, and mold coolant flow rates must remain static throughout testing. Any shift in screw transfer position distorts short-shot weight metrics across consecutive test steps.
Analyzing individual cavity weights across progressive short shots produces a clear matrix of filling order. Early-filling cavities maintain higher part mass throughout the sequence, while late-filling cavities show lagging mass curves. These trends allow toolmakers to execute targeted steel adjustments ~ such as micro-polishing gate lands or modifying runner split diameters ~ with precision.
Inadequate venting or blocked channels cause localized hydraulic lock, altering calculated balance ratios and burning peripheral cavities.

Scale
Dimensional verification of multi-cavity output involves statistical analysis across cavity locations, press cycles, and material lots. Where single-cavity tools only require verification of process capability over time, multi-cavity tooling demands nested models that separate intra-shot variance between impressions from inter-shot variance over continuous production runs.
Process capability metrics like Cp and Cpk measure the ability of a process to produce features within drawing limits. Cp measures potential capability based on process spread regardless of centering, whereas Cpk factors in process centering relative to specification limits. Evaluating multi-cavity tools requires calculating individual Cpk values for every cavity alongside a global Cpk across all cavity datasets.
A high global capability index requires tight intra-shot consistency and shift-to-shift stability. If individual cavities maintain tight dimensional spreads but show different mean dimensions, the combined global distribution widens. This widening degrades global Cpk, causing tool rejection despite strong performance from individual cavities.

How Many Cavities Deliver Statistical Pass Rates?
Determining acceptable capability thresholds requires specifying minimum sample sizes and confidence intervals. Collecting five consecutive shots from a 32-cavity tool yields 160 part measurements per feature, isolating cavity-to-cavity geometric variation from cycle-to-cycle machine drift.
Evaluating multi-cavity inspection data relies on fundamental statistical methods. Analysis of Variance (ANOVA) separates total dimensional variance into within-shot cavity components and between-shot temporal components. When variance between cavities dominates, the root cause lies in tool geometry, gate wear, or runner imbalance.
If variance between shots dominates, the cause traces to hydraulic drift, resin lot variations, or ambient thermal shifts.
Dimensional pass criteria require every active cavity to achieve an individual Cpk of at least 1.33 for standard dimensions and 1.67 for critical safety features. Global tool capability, combining all cavity data into a single distribution, must also reach a Cpk of 1.33 or higher. Meeting both benchmarks ensures that parts from any cavity interchange seamlessly in downstream assembly.
| Tolerance Group (TG) | Material Family Type | Nominal Dimension Range | Standard Tolerance Band | Required Minimum Cpk |
|---|---|---|---|---|
| TG3 (Precision) | Unfilled Amorphous (PC, ABS) | 1 to 6 mm | Plus or minus 0.05 mm | 1.67 |
| TG4 (General Industrial) | Semi-Crystalline (PA66, POM) | 1 to 6 mm | Plus or minus 0.08 mm | 1.33 |
| TG5 (Standard Structural) | Filled Polyolefins (PP+30% GF) | 1 to 6 mm | Plus or minus 0.12 mm | 1.33 |
| TG3 (Precision) | Unfilled Amorphous (PC, ABS) | 30 to 120 mm | Plus or minus 0.15 mm | 1.67 |
| TG4 (General Industrial) | Semi-Crystalline (PA66, POM) | 30 to 120 mm | Plus or minus 0.22 mm | 1.33 |
Accepting multi-cavity tooling without verifying individual cavity capability risks hidden assembly losses. Tooling qualification requires structured documentation before commercial release.
- First Article Inspection Report documents complete ninety-point layout measurements across three shot sets for all active cavities using optical coordinate measuring machines.
- Intra-Shot Variance Analysis calculates maximum dimensional spread between cavity impressions within identical injection cycles.
- Longitudinal Drift Evaluation tracks critical dimension stability across a continuous four-hour press run operating at target cycle rate.
- Cavity Interchangeability Matrix maps dimensional distribution overlaps to confirm parts from all impressions fit mating assemblies without selective sorting.

DIN 16742 Tolerance Classes across Mold Layouts
DIN 16742 establishes international standards for dimensional tolerances on molded plastic parts, categorizing requirements into Tolerance Groups designated TG1 through TG9. Precision technical components fall under TG1 through TG4, requiring specialized toolmaking and tight dynamic control at the press.
Anisotropic shrinkage complicates dimensional verification under DIN 16742. Resins reinforced with glass fibers shrink unevenly relative to flow direction: fibers align parallel to flow paths in runners and cavity walls, resulting in low longitudinal shrinkage, while transverse flow areas experience much higher contraction. In a multi-cavity tool where individual gates induce slightly different flow vectors, identical nominal dimensions shrink into distinct geometric shapes across cavities.
Selecting appropriate DIN 16742 tolerance classes requires accounting for tooling constraints during initial drawing generation. Specifying TG3 tolerances on a 64-cavity tool molding glass-filled polyamide demands thermal control within one degree Celsius across all inserts. Overly tight tolerances increase rework cycles, elevate scrap rates, and inflate unit costs without improving functional performance.
DIN 16742 mandates that global capability Cpk metrics must aggregate all individual cavity measurement distributions without manual outlier trimming or selective sampling.
Attributing dimensional variations across cavities entirely to resin lot fluctuations ignores physical mass discrepancies present within identical shot sets.
Stability
Continuous production runs expose environmental, mechanical, and thermal drift that disrupt short-term verification results. A protocol verified during a thirty-minute trial can fail over an eighteen-hour shift. Maintaining long-term stability requires tracking hydraulic oil temperature, tie-bar strain calibration, and ambient conditions around the press.
Thermal equilibrium takes time to establish after cold startup. Tool steel expands as thermal energy transfers from hot runner systems and molten resin into cavity plates. A large steel mold plate can take over two hours of continuous cycling to reach steady-state thermal expansion, meaning dimensions measured during the first twenty minutes drift predictably as temperatures climb toward equilibrium.
Water-chilled cooling channels accumulate rust scale, mineral deposits, or glycol residue over months of operation. This internal fouling acts as an insulating layer, reducing heat transfer efficiency between cavity inserts and coolant. As heat transfer degrades, cavity surface temperatures climb, extending required cooling times and causing progressive dimensional growth in molded parts.
Continuous monitoring of water return temperatures across individual cooling circuits pinpoints localized line blockages before thermal drift alters part dimensions.
Evaluating stability requires tracking specific performance vectors across extended production shifts.
- Screw Cushion Stability measures residual resin volume remaining in front of the screw tip after the holding phase completes, confirming check ring seal integrity.
- Hydraulic Response Hysteresis monitors shift-to-shift proportional valve timing variations caused by hydraulic oil viscosity changes as oil temperatures cycle.
- Tie-Bar Strain Symmetry calculates clamping force distribution across four press tie-bars to prevent localized parting line flash or tool plate deflection.
- Regrind Mix Uniformity ensures consistent thermal history and bulk density when blending reprocessed sprues back into virgin material feed hoppers.
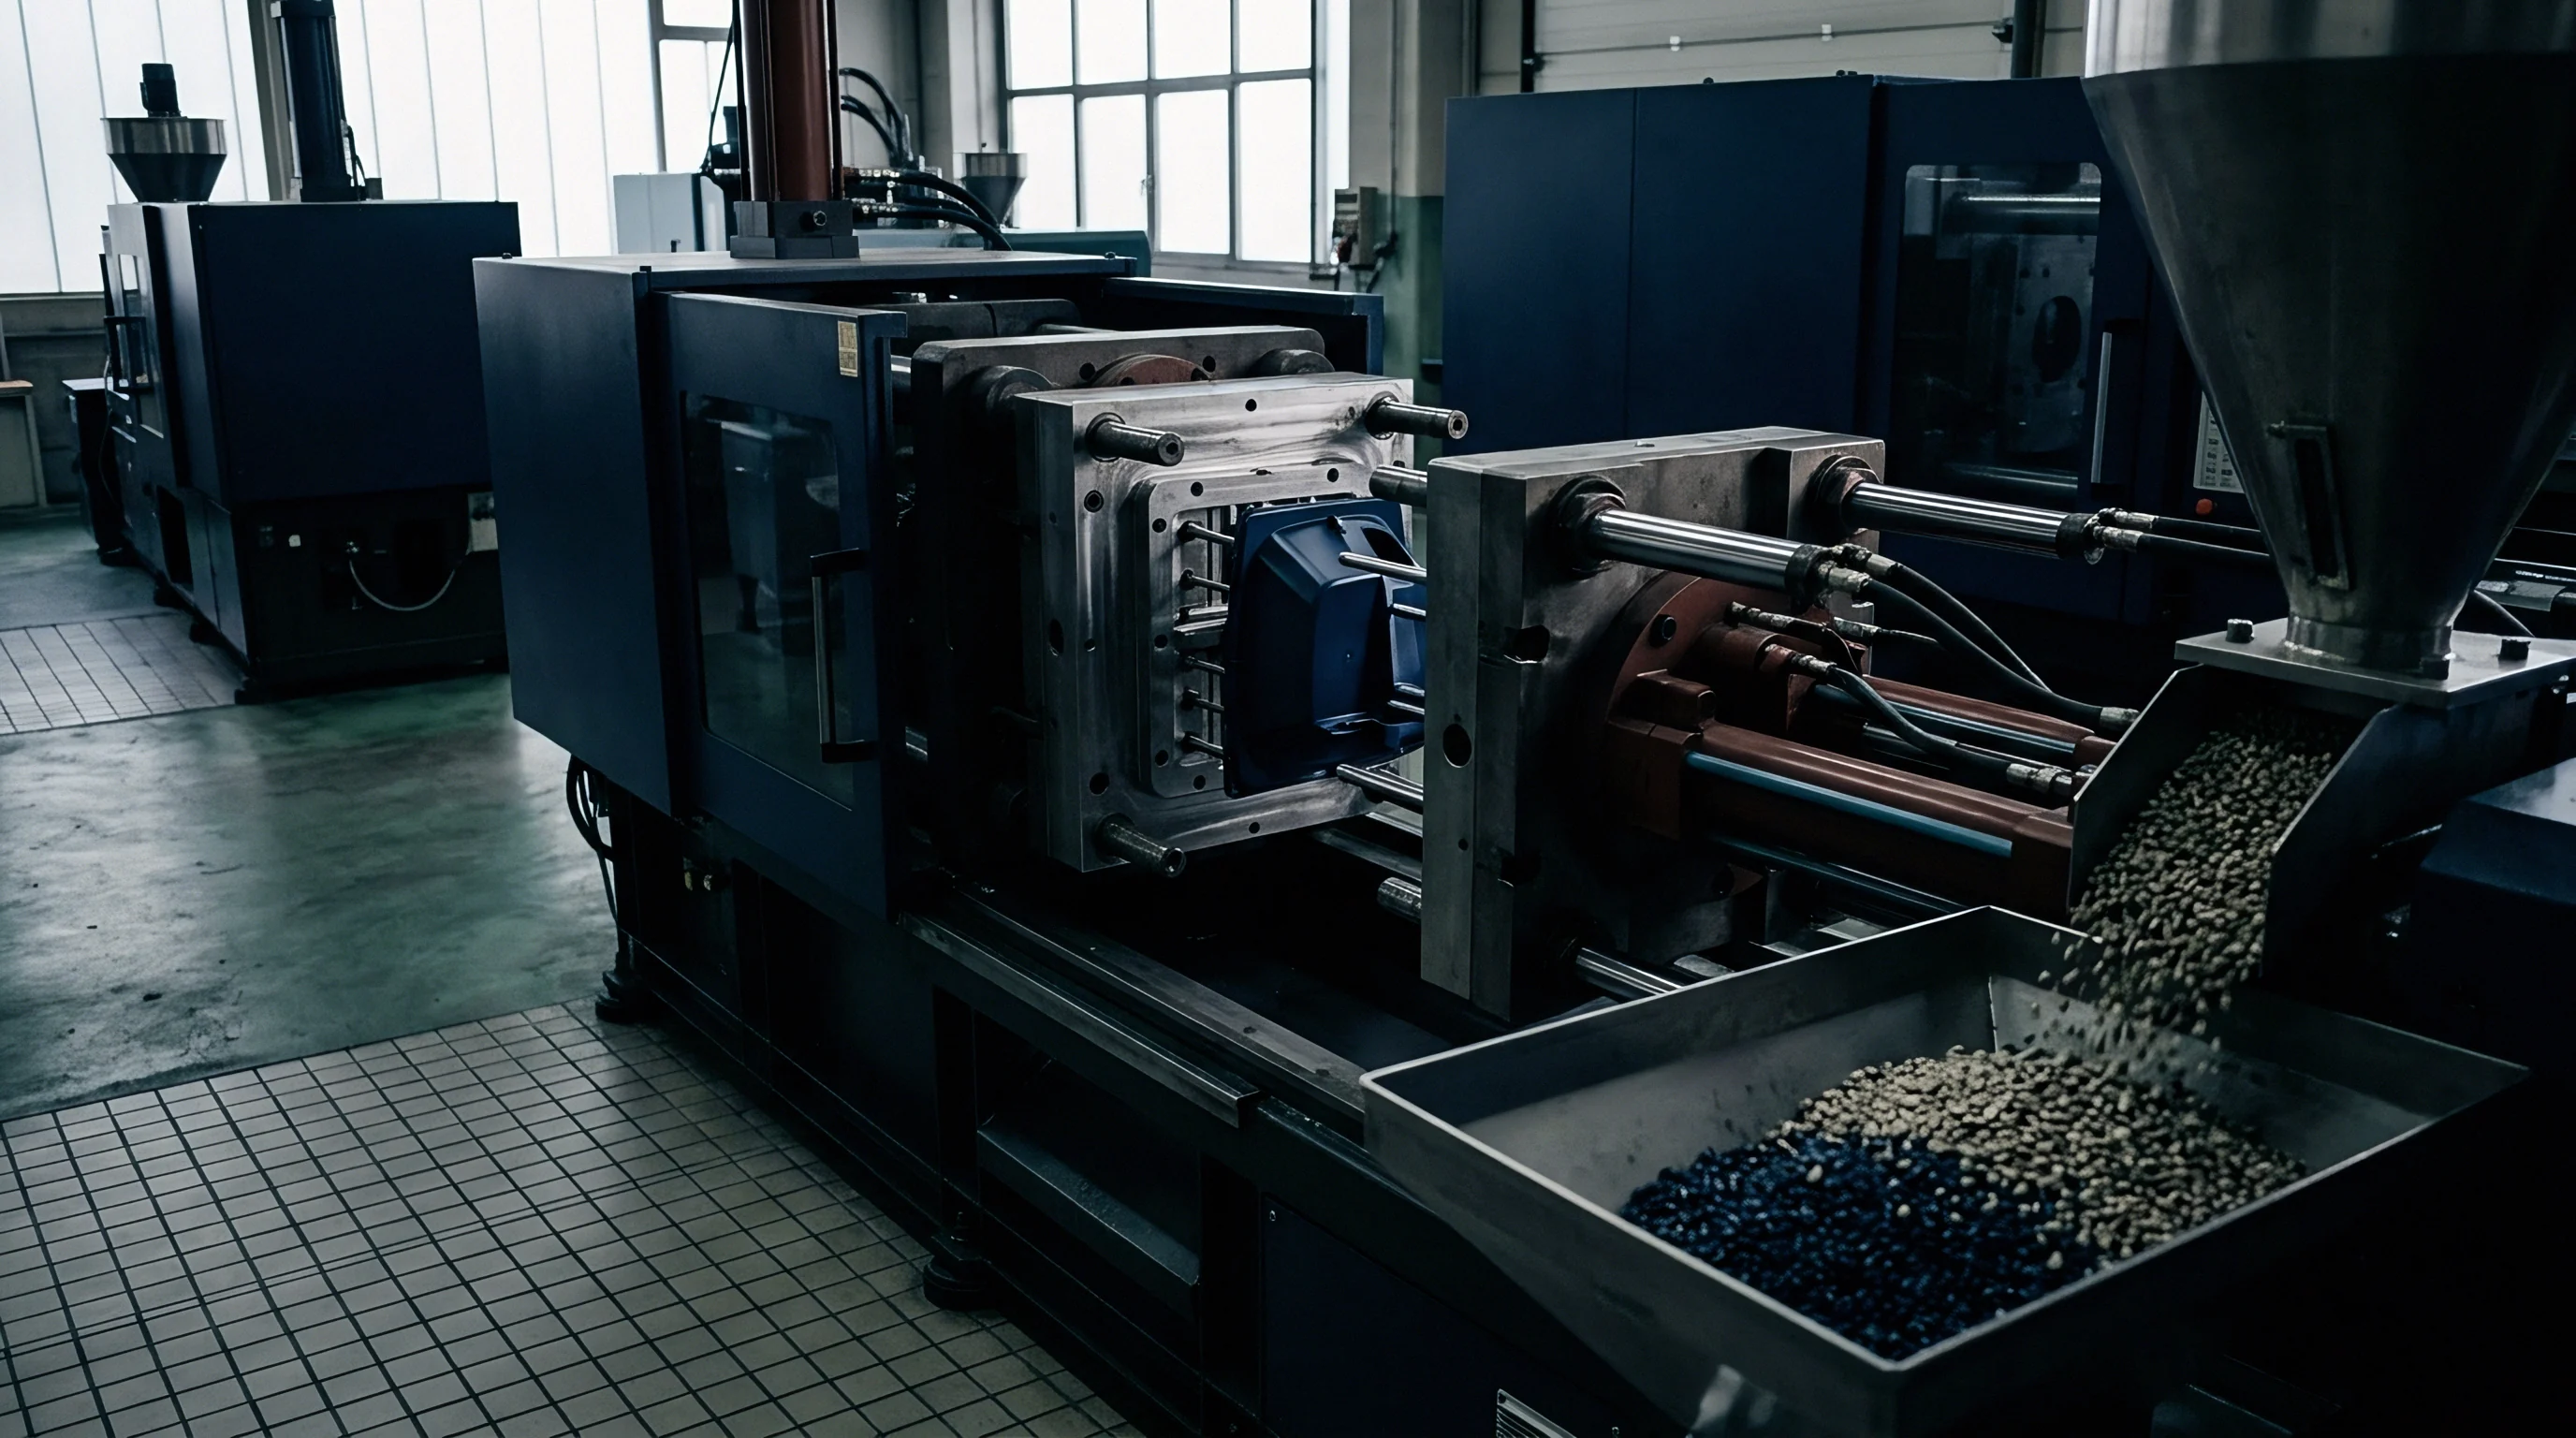
Thermal Hysteresis across Extended Press Runs
Thermal hysteresis occurs when mold temperature control units cycle around setpoints, creating wave-like temperature oscillations on cavity walls. Poorly tuned controllers can allow swings up to five degrees Celsius, inducing cyclic shrinkage variations in semi-crystalline polymers like polyoxymethylene and polypropylene, where crystallization depends heavily on cooling rates.
Monitoring coolant flow across individual manifold circuits ensures turbulent flow inside internal channels. Laminar flow yields poor heat transfer coefficients, creating localized hot spots inside deep core pins or tight cavity pockets. Maintaining Reynolds numbers above 4000 guarantees turbulent flow, maximizing heat transfer and stabilizing cycle times during long runs.
Infrared cameras deployed press-side capture surface temperature maps as soon as the tool opens. Comparing thermal images across impressions isolates clogged cooling passages or failing cartridge heaters before dimensional shifts show up on finished parts. Automated vision systems on part-removal robots can perform thermal imaging sweeps during every ejection sequence, logging temperature profiles into factory quality databases.
Cushion Recovery and Gate Seal Timing
Screw cushion persistence serves as a primary indicator of mechanical repeatability. The cushion represents the residual resin left in front of the check ring when the hold phase ends. If the cushion bleeds off to zero, injection pressure collapses completely, leaving cavities under-packed and vulnerable to sink marks or dimensional shrinkage.
A drifting cushion signals check ring wear, barrel tip erosion, or thermal degradation of non-return valve components. If the non-return valve fails to seal instantly when injection begins, polymer flows backward over screw flights, consuming effective stroke volume and dropping peak cavity pressure. Tracking cushion position at the end of hold time gives an early warning for required press maintenance.
Gate seal timing tests determine how long polymer in the gate channel takes to solidify completely. Holding pressure applied past gate seal wastes energy, extends cycle time, and risks stress cracking at the gate stub. Conversely, cutting hold pressure before gate seal allows pressurized polymer in the cavity to backflow into the runner, causing part weight drops and sink marks across impressions.
Standard quality agreements specify that press control parameters must remain locked within established process limits, stipulating that any unapproved alteration invalidates part sign-off certifications.

Yield
Evaluating multi-cavity tooling economics balances upfront capital expenditure against piece-price reductions from higher cavitation. Doubling cavitation from 16 to 32 impressions increases tool expense due to complex hot runners and tight plate machining tolerances. However, higher cavitation reduces required machine hours, spreading fixed operating rates over greater part volumes.
Cavity failure during production disrupts the baseline economic model. When an impression in a 32-cavity tool suffers mechanical damage, gate galling, or heater failure, operators often block off the damaged runner channel to keep running. However, operating with blocked impressions alters thermal dynamics, pressure drops, and shear rates across all active cavities.
Running multi-cavity tooling with inactive cavities introduces flow imbalances that compromise part quality in adjacent impressions. Resin redirected from blocked channels accelerates through operational drops, raising shear rates and thermal friction. The resulting pressure redistribution overpacks impressions near the blocked drop, causing parting-line flash and changing finished part weights.
| Tool Configuration | Effective Production Yield | Unit Cycle Time Deviation | Amortized Tooling Cost Delta | Landed Piece Price Impact |
|---|---|---|---|---|
| 16-Cavity Baseline (Fully Active) | 100 percent (16 of 16) | Baseline (12.0 seconds) | Standard amortised rate | Baseline calculated price |
| 16-Cavity (1 Blocked Cavity) | 93.75 percent (15 of 16) | Plus 0.4 seconds (rebalancing) | Plus 6.6 percent per part | Plus 4.2 percent cost increase |
| 32-Cavity Baseline (Fully Active) | 100 percent (32 of 32) | Baseline (14.5 seconds) | Standard amortised rate | 31 percent lower than 16-cavity |
| 32-Cavity (2 Blocked Cavities) | 93.75 percent (30 of 32) | Plus 0.8 seconds (rebalancing) | Plus 6.6 percent per part | Plus 5.1 percent cost increase |
| 32-Cavity (4 Blocked Cavities) | 87.50 percent (28 of 32) | Plus 1.8 seconds (thermal shift) | Plus 14.2 percent per part | Plus 11.8 percent cost increase |
Dead Cavity Management and Amortisation Metrics
Tooling contracts should include clear dead-cavity management clauses before steel cutting starts. Running production with blocked cavities without re-qualification risks delivering non-conforming parts to assembly. Formal agreements specify the maximum percentage of inactive cavities allowed before removing the tool for overhaul becomes mandatory.
Amortization schedules tie tooling capital recovery to delivered part quantities over defined production timeframes. When blocked cavities lower hourly output, machine run times must extend to meet batch sizes. This extra run time increases press operating costs, eroding profit margins and delaying capital recovery for both buyer and supplier.
Mapping baseline viscosity curves prior to establishing dynamic holding windows guarantees that press-side process modifications adjust to material flow variations rather than masking underlying mechanical tooling imbalances.
Acceptance Transfer Protocols and Warranty Terms
Transferring multi-cavity tooling from the toolmaker’s shop to the production press requires structured verification protocols. Acceptance documentation includes First Article Inspection Reports, fill balance test data, sensor telemetry curves, four-hour stability logs, and verified capability indices across active cavities.
Tooling warranty coverage relies on strict compliance with agreed processing parameters. Exceeding maximum injection pressure, running abrasive resins without specified wear coatings, or bypassing mold protection interlocks voids structural guarantees. Maintaining continuous telemetry log files provides objective evidence of operating conditions, resolving liability disputes if mechanical failures occur.
Final commercial acceptance commits the buyer to paying outstanding tooling balances once all active cavities meet specified capability thresholds. The verified tool dossier sits with the sourcing team, documenting baseline performance parameters that serve as technical benchmarks throughout the mold’s operational life.