Decoupled Molding Setup Essentials for Precision Technical Components
Decoupled molding isolates fill velocity from hold pressure to neutralize resin viscosity variations and hold precision tolerances across volume runs.


Melt
High shear rates generated during fast fill align polymer chains within the nozzle orifice. Traditional setups blend velocity and pressure into a single phase, leaving cavity filling vulnerable to resin viscosity shifts between lots. Decoupled molding separates the cycle into distinct volumetric filling, hydraulic packing, and cavity-holding stages, using screw velocity to control the initial fill rate up to ninety-five percent of part volume without relying on pressure limits to dictate speed.

Decoupled Stage Architecture
Decoupled I relies on fast volumetric filling followed immediately by machine transfer to hold pressure, using mechanical injection speed to pack the remaining cavity volume. Decoupled II isolates ninety-five to ninety-eight percent of fill by stroke position under velocity control, then switches to a secondary hydraulic pack and hold phase to complete part density. Decoupled III fills at high velocity nearly to completion, using cavity pressure sensors to trigger hold pressure the moment the melt front hits the sensor face.
Stage boundaries, physical control variables, and dominant process risks for these strategies are outlined below.
| Setup Methodology | Primary Filling Variable | Transfer Trigger Signal | Viscosity Shift Exposure | Target Part Geometry Application |
|---|---|---|---|---|
| Decoupled I | Screw Injection Speed (mm/s) | Hydraulic Pressure Peak (bar) | High: viscosity drop causes flash | Thick-walled non-precision components |
| Decoupled II | Screw Velocity Profile (mm/s) | Screw Linear Position (mm) | Low: volume fixed by stroke | Precision engineering parts with core pins |
| Decoupled III | Controlled Flow Rate (cm³/s) | In-Cavity Pressure Transducer (bar) | Zero: fill dictated by cavity arrival | Thin-wall connectors under tight tolerance |
Decoupled II remains the standard for technical components because position-based cutoff isolates the cavity from thermal shifts. When resin viscosity drops from regrind changes or humidity, velocity control keeps the injection rate constant, forcing the press to deliver whatever hydraulic pressure is required to maintain speed until the screw reaches its transfer point.

Flow Front Behavior and Rheological Shifts
In-line rheology curves show that non-Newtonian polymer melt reaches a stable viscosity plateau at elevated injection speeds. Setting the fill speed on this flat region ensures minor speed variations will not alter viscosity through thin runner channels. Rapid injection also prevents premature skin formation on core pins, maintaining balanced pressure across internal geometries.
Failure points when incorrect machine limits interrupt velocity-controlled filling include:
- Pressure Limit Hesitation occurs when the machine hits hydraulic pressure limits before reaching position cutoff, decaying injection velocity mid-stroke and creating freeze lines.
- Unbalanced Cavity Filling results from low injection speeds that allow thin runner sections to freeze early, forcing excessive volume into thicker walls.
- Thermal Degradation Drops arise when excessively high shear rates cause localized melt overheating, breaking down molecular weight in delicate engineering resins.
- Cushion Depletion Events occur when an insufficient volumetric charge allows the screw to bottom out against the barrel nose before transferring to hold pressure.
Fast filling velocity creates uniform shear across multi-cavity tools. When runner networks experience identical shear rates, non-Newtonian fluid enters each impression simultaneously. Lowering injection velocity to fix surface jetting creates thermal gradients that throw off part dimensions; resolving cosmetic flow lines requires modifying gate geometry rather than cutting injection speed.
A twenty-percent increase in polymer melt viscosity changes injection pressure by forty bar while filling speed and part weight remain constant under position-based cutoff.
Separating velocity from pressure requires setting injection pressure limits high enough that the machine never clips the speed profile. If hydraulic pressure tops out mid-stroke, velocity control fails and the process reverts to being pressure-dependent. Operators verify velocity control by plotting screw position against time during full injection trials, where a linear slope confirms consistent speed across the fill distance.
As a working setup rule, injection velocity should sit on the flat, high-shear plateau of the viscosity curve, where higher speed produces no further drop in fluid resistance.
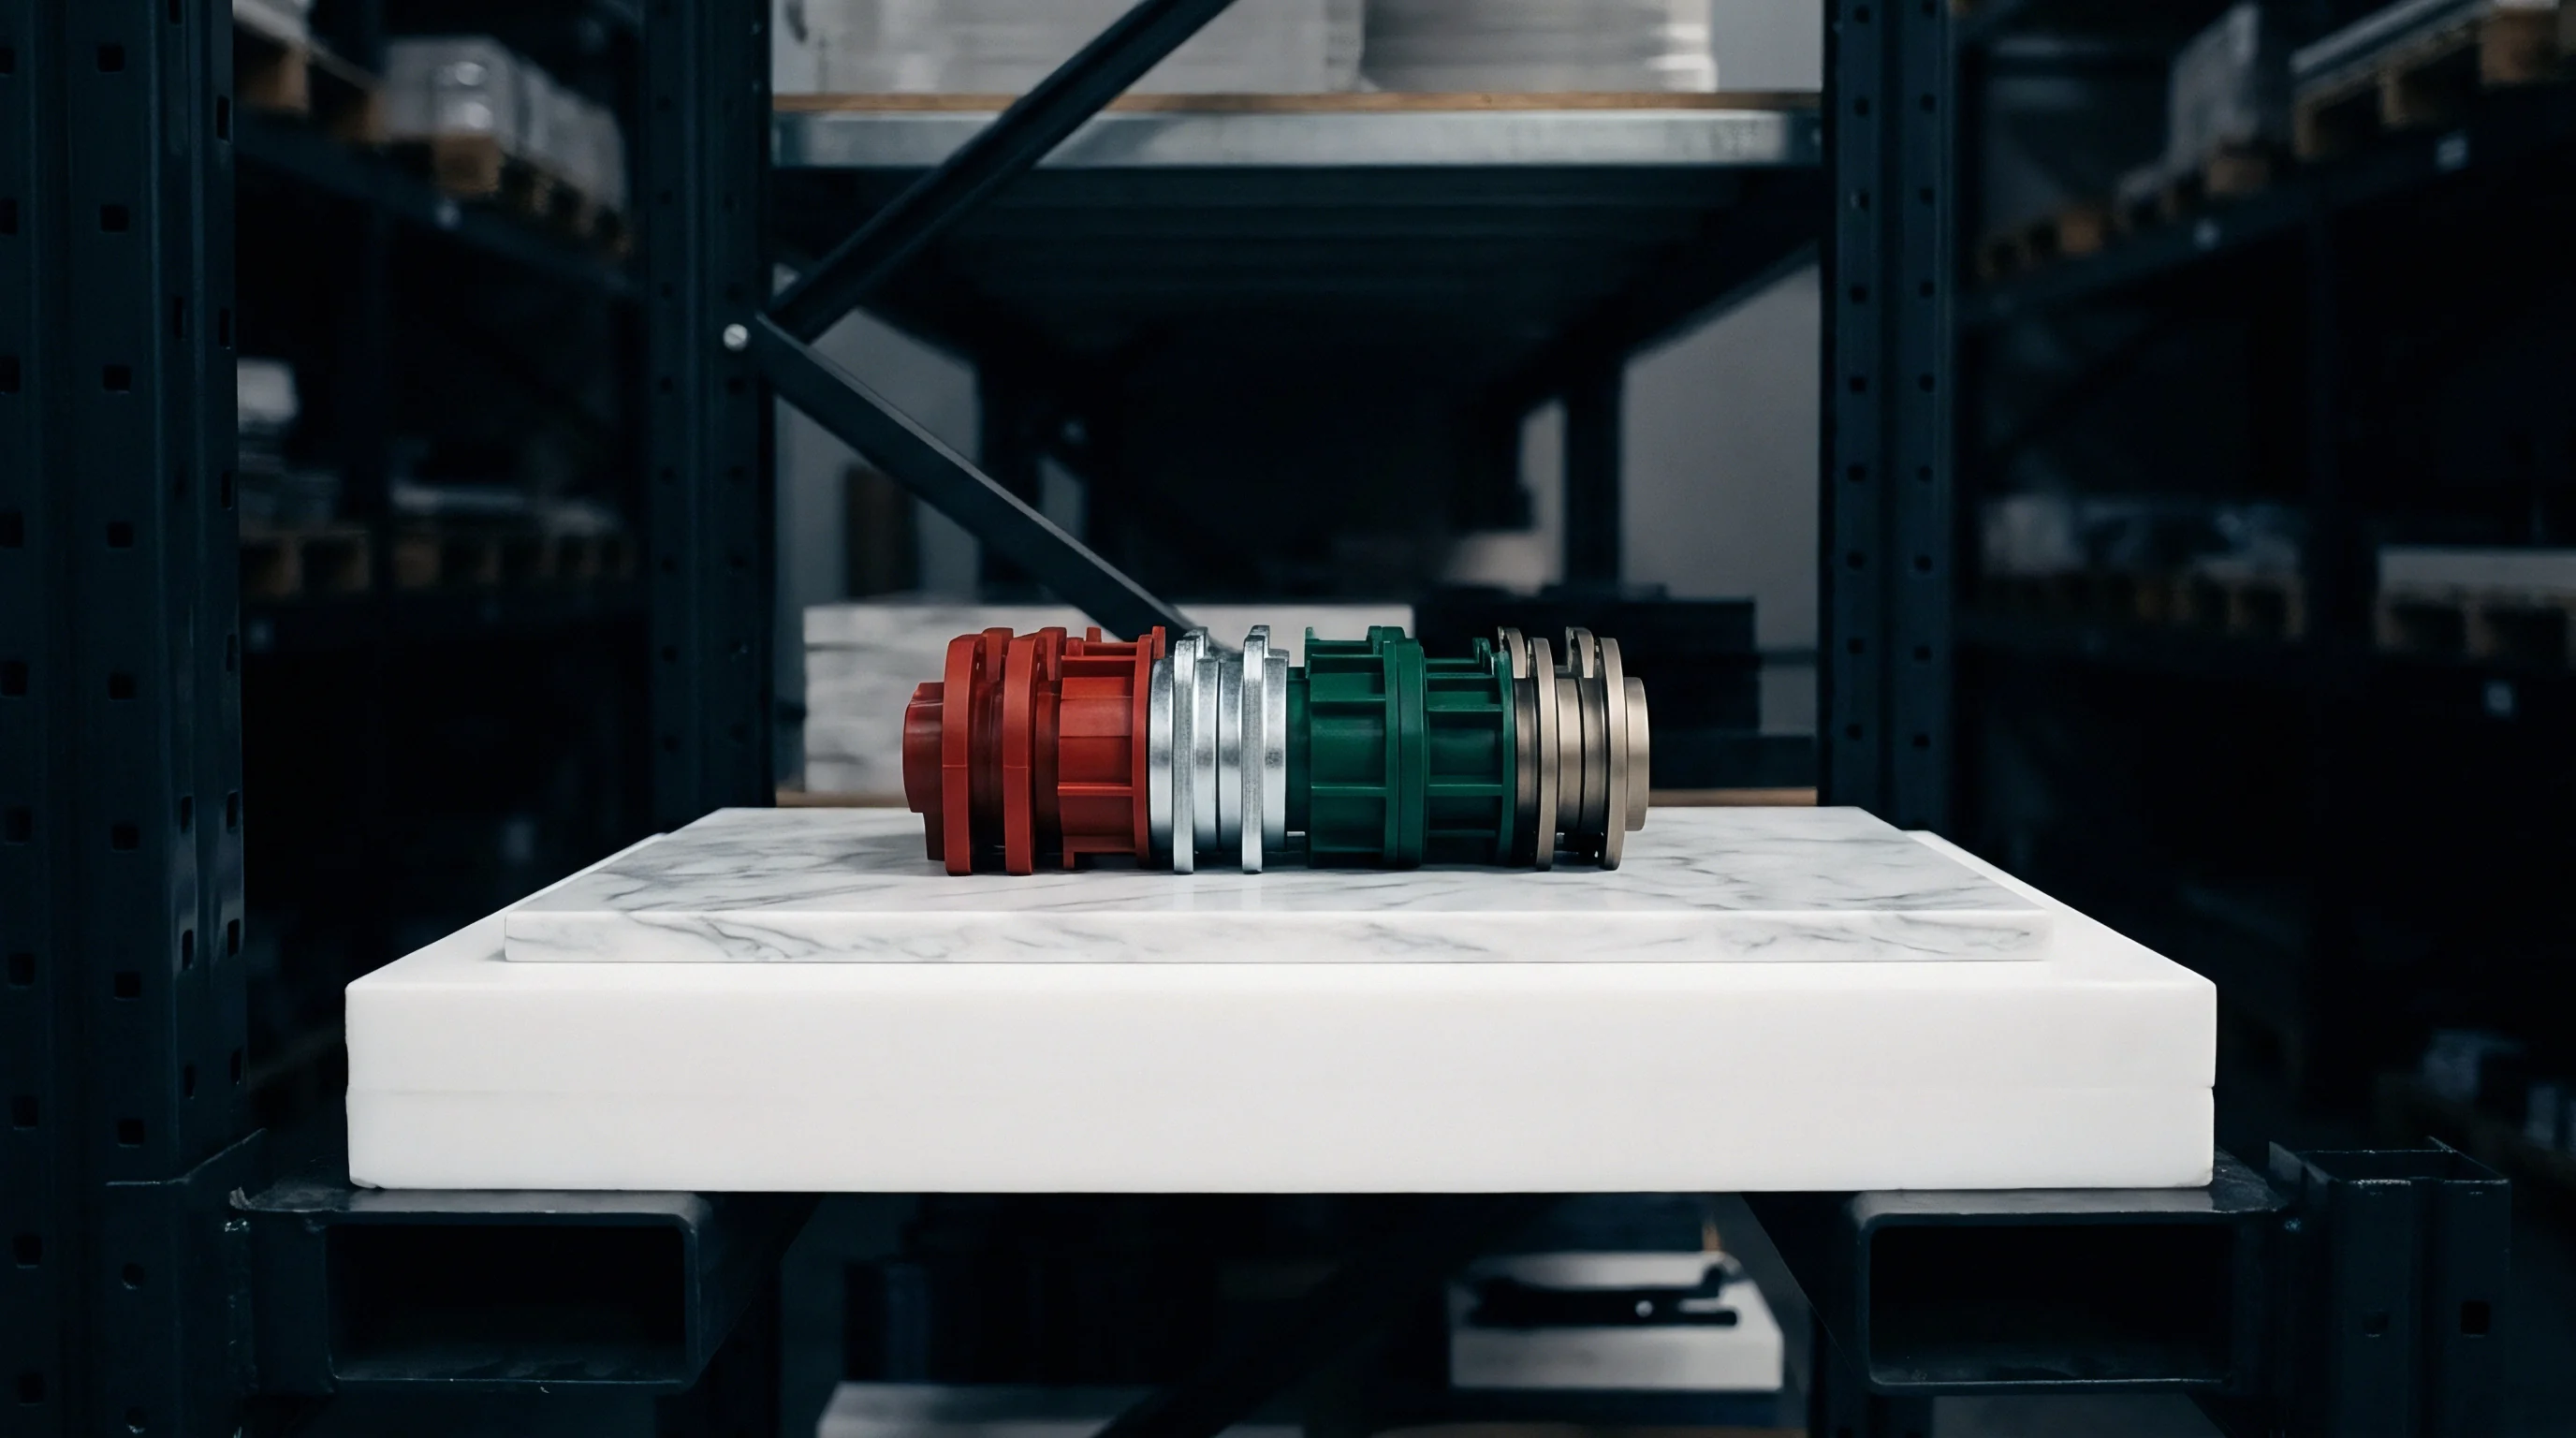

Gate
Hydraulic pressure spikes the instant the screw reaches its programmed cutoff position, where the second phase of decoupled molding transfers control from rapid linear motion to sustained hold pressure. This packing phase feeds additional polymer into the tool impression to compensate for volumetric shrinkage as the melt cools to a solid state.
Gate Seal Kinetics
Hold pressure must remain active until the liquid core within the gate solidifies completely. Premature release allows molten plastic to backflow into the runner system, causing sink marks and dimensional instability. Determining exact gate freeze time involves weighing parts across incremental hold times while holding injection speed and cooling fixed.
Establishing gate seal timing requires the following sequence:
- Set hold time to one second while keeping injection speed, melt temperature, and mold chill settings constant.
- Run five consecutive cycles, collect parts, strip runner channels, and log average component mass on a balance calibrated to one milligram.
- Increase hold time by one-second increments, repeating part collection and weighing at each step.
- Plot component mass against hold time to identify where part weight levels off into a horizontal line.
- Add one second to that threshold weight time to establish the baseline production hold duration.
Below the freeze threshold, dimensional variation scales directly with hold duration. Once the gate freezes, additional hold time adds no mass, serving only to generate unnecessary heat and press wear.

Cavity Pressure Signal Decoupling
In Decoupled III configurations, piezoresistive or piezoelectric pressure sensors behind ejector pins track energy transfer inside the impression. Peak cavity pressure recorded during packing dictates final component density, volumetric shrinkage, and pitch dimensions between core pins. Monitoring cavity pressure decay measures the rate of thermal dissipation inside the steel core.
A two percent variation in screw cushion at transfer translates to a fourteen bar drop in peak cavity pressure during semi-crystalline resin processing.
Maintaining a stable cushion is mandatory for pressure transmission during phase two. The screw acts as a hydraulic piston pushing liquid resin into the cavity; if the cushion drops to zero, metal-to-metal contact halts energy transfer. The cavity depressurizes rapidly while the core remains molten, inducing high internal stress and void formation.
Reliable cushion retention depends on check-ring seating, barrel temperature profiles, and uniform granule plasticization.
If packing pressure is wrong or gate seal timing is ignored, parts undergo differential thermal shrinkage, creating out-of-spec warp profiles that cannot be corrected by extending the cooling phase.
Chill
Heat extraction controls the rate of molecular crystallization in technical thermoplastics. Phase three of decoupled molding relies on thermal conduction through core and cavity steel once the gate has frozen and hold pressure ends. Mold surface temperature consistency dictates internal stress levels, optical clarity, surface finish, and final room-temperature dimensions.
Reynolds Number Limits in Cooling Channels
Turbulent coolant flow maximizes heat transfer between tool steel or aluminum and water loops. Laminar flow leaves a stagnant boundary layer along channel walls, retarding heat extraction and creating thermal gradients across cavity plates. Preventing this requires maintaining a Reynolds number above four thousand within every cooling circuit.
Coolant velocity is calculated from flow rate and line diameter. The thermal parameters in the table below connect coolant conditions to dimensional tolerance classes governed by DIN 16742.
| Coolant Velocity (m/s) | Flow State Regime | Reynolds Number Range | Delta T Across Circuit (°C) | DIN 16742 Tolerance Grade |
|---|---|---|---|---|
| 0.5 | Laminar Flow | Re < 2,100 | > 5.0 | TG7 (Broad Commercial) |
| 1.2 | Transitional Flow | 2,100 ≤ Re ≤ 4,000 | 2.5 to 5.0 | TG5 (Standard Technical) |
| 2.2 | Fully Turbulent | Re > 4,000 | < 1.0 | TG4 (Precision Technical) |
Mold temperature directly governs final shrinkage. Higher surface temperatures reduce differential contraction, allowing polymer chains to relax before solidifying. This lowers molded-in stress and minimizes warpage in asymmetric structural components.
Conversely, cooler mold temperatures shorten cycle times at the expense of higher internal stress, which can trigger environmental stress cracking under solvent exposure later.

Dimensional Stability across Thermal Gradients
Unequal heat removal between cavity and core halves pulls components toward the warmer steel during ejection. Controlling water loop pressure drop ensures the temperature delta between inlet and outlet manifolds stays under one degree Celsius. Validating thermal balance when commissioning a new tool requires the following steps:
- Connect temperature control units directly to designated circuit ports, eliminating restrictive quick-disconnect fittings and flexible hoses.
- Purge air from lines, adjust supply pressure, and verify through flow meters that Reynolds numbers remain turbulent inside the narrowest core channels.
- Run twenty stable setup cycles, stop the press, open guards, and scan core and cavity surfaces with a calibrated pyrometer matrix.
- Adjust circuit flow control valves until thermal surface variance across all cavity impressions drops below two degrees Celsius.
Blaming dimensional warpage on resin batch variation during tool trials often masks uneven cooling across core slides.

Audit
Statistical process verification separates machine variability from polymer lot variations. A decoupled setup must demonstrate repeatability over extended production runs without manual intervention. Measuring screw recovery time, fill time stability, and peak hydraulic pressure across hundreds of consecutive cycles shows whether the process window can absorb ambient shop floor shifts.
Viscosity Curve Construction
A viscosity study establishes the optimum injection velocity for a given mold and machine setup. By varying injection speed while holding barrel temperatures constant, the technician records fill time and peak hydraulic pressure at transfer. Converting hydraulic pressure to relative viscosity reveals the material’s shear-thinning behavior.
ISO 294 demands specimen mold temperature stability within two degrees Celsius across forty consecutive cycles before dimensional baseline logging.
Operating on the flat section of the shear rate curve insulates the process from viscosity changes caused by regrind variations, moisture fluctuations, or minor colorant additions. Running injection speeds too low places the process on the steep portion of the curve, where minor velocity drifts cause massive shifts in fill pressure.
When Does Machine Volumetric Repeatability Fail Decoupled Control?
Machine wear degrades decoupled setup stability over time. Non-return valve leakage allows plastic melt to slip back over the screw during hold pressure, causing cushion drop and erratic cavity packing. A damaged barrel or worn screw flights prevent uniform melt plasticization, resulting in thermal non-homogeneity within the shot volume.
Process capability studies quantify machine performance using process capability indices. A robust setup requires a capability index exceeding 1.33 on critical part dimensions. Verifying machine capability involves the following validation protocol:
- Set up baseline Decoupled II parameters, holding position cutoff and cushion stability within strict limits.
- Run thirty consecutive molding cycles without altering settings, logging peak injection pressure, fill time, cushion position, and screw recovery time.
- Measure target critical-to-quality dimensions on parts from every fifth cycle using an optical coordinate measuring machine after twenty-four hours of thermal stabilization.
- Calculate process capability indices for fill time and critical part dimensions to confirm machine stability.
If the process capability index drops below 1.33, machine hydraulic valves, encoder accuracy, and check-ring wear require mechanical overhaul before tool baseline sign-off.
Standard quality clauses in technical contracts state that any process parameter drift exceeding five percent from the approved setup dossier automatically invalidates lot acceptance and requires full dimensional re-qualification.


Payout
Tooling capital expenditure interacts directly with press machine-hour rates during production. Selecting the optimal cavitation level balances upfront steel cost against cycle-time savings over the product lifespan. Decoupled setup protocols protect this investment by preventing flash damage, core pin deflection, and premature tool wear caused by excessive hydraulic pressure.
Machine Rate Impact on Cycle Seconds
The financial viability of precision components hinges on minimizing cooling seconds while maintaining structural and dimensional compliance under DIN 16742. Multi-cavity tools reduce machine time per unit, but increase mechanical complexity, initial tooling costs, and scrap exposure if thermal or filling imbalances occur across cavities.
The sensitivity model below illustrates cost breakdowns for single, four, and eight-cavity tools producing a technical component at an annual volume of five hundred thousand units, based on a fifty-euro per hour machine rate.
| Cavitation Count | Initial Tool Cost (€) | Base Cycle Time (s) | Hourly Output (units) | Machine Cost per Unit (€) | Amortized Tool Cost/Unit (€) |
|---|---|---|---|---|---|
| 1 Cavity | 18,000 | 12.0 | 300 | 0.167 | 0.036 |
| 4 Cavities | 45,000 | 13.5 | 1,066 | 0.047 | 0.090 |
| 8 Cavities | 82,000 | 15.0 | 1,920 | 0.026 | 0.164 |
Increasing cavitation extends total cycle time slightly due to larger runner systems and higher cooling demands, but total unit cost drops significantly as volume grows. Higher cavitation increases risk if runner balance shifts ~ a single short-filling cavity ruins the entire shot.

Cavitation Vs Shrinkage Variance
A multi-cavity tool under Decoupled II control requires identical thermal and rheological conditions across all impressions. Imbalanced runner layouts or uneven water channels yield cavity-to-cavity weight variance, forcing operators to over-pack some cavities to fill others ~ inducing residual stress, flash, and sticking in over-packed impressions.
Adding four cavities doubles tool maintenance reserves while reducing part machine-time expenditure by forty percent.
Evaluating the financial trade-off between single and multi-cavity tooling can be seen in a component with an annual volume of two hundred thousand units over a three-year lifecycle. A single-cavity tool costing twenty thousand euros with a ten-second cycle yields a machine cost of 0.139 euros per part on a fifty-euro hourly press rate. Upgrading to a four-cavity tool costs fifty-five thousand euros but extends cycle time to eleven seconds due to larger runner volume.
The four-cavity press rate increases to sixty euros per hour due to higher clamp tonnage needs, yet machine cost per unit drops to 0.046 euros. Across six hundred thousand total units, machine savings equal fifty-five thousand eight hundred euros, covering the thirty-five thousand euro tooling uplift and generating net savings of twenty thousand eight hundred euros over the project lifecycle.
Documenting these financial models alongside decoupled processing parameters ensures tooling investment decisions align with long-term production targets and dimensional quality specifications.