Cavity Pressure Sensor Selection for Precision Injection Tooling
Selecting cavity pressure sensors requires matching transducer force paths, thermal limits, and signal acquisition methods to tool cavitation and tolerance targets.


Pin
Polymer melt entering an injection cavity exerts multi-axial mechanical force against the surrounding steel walls. Capturing these physical forces requires transmitting pressure from the molten resin to a sensor element embedded within the tool housing. Toolmakers select between two primary physical mounting strategies: direct contact with the polymer melt surface or indirect transmission through an intervening force transfer rod.
Steel deforms under extreme clamping force. This structural bending Alters sensor pre-load alignments, shifting zero-point baseline values during injection cycles.
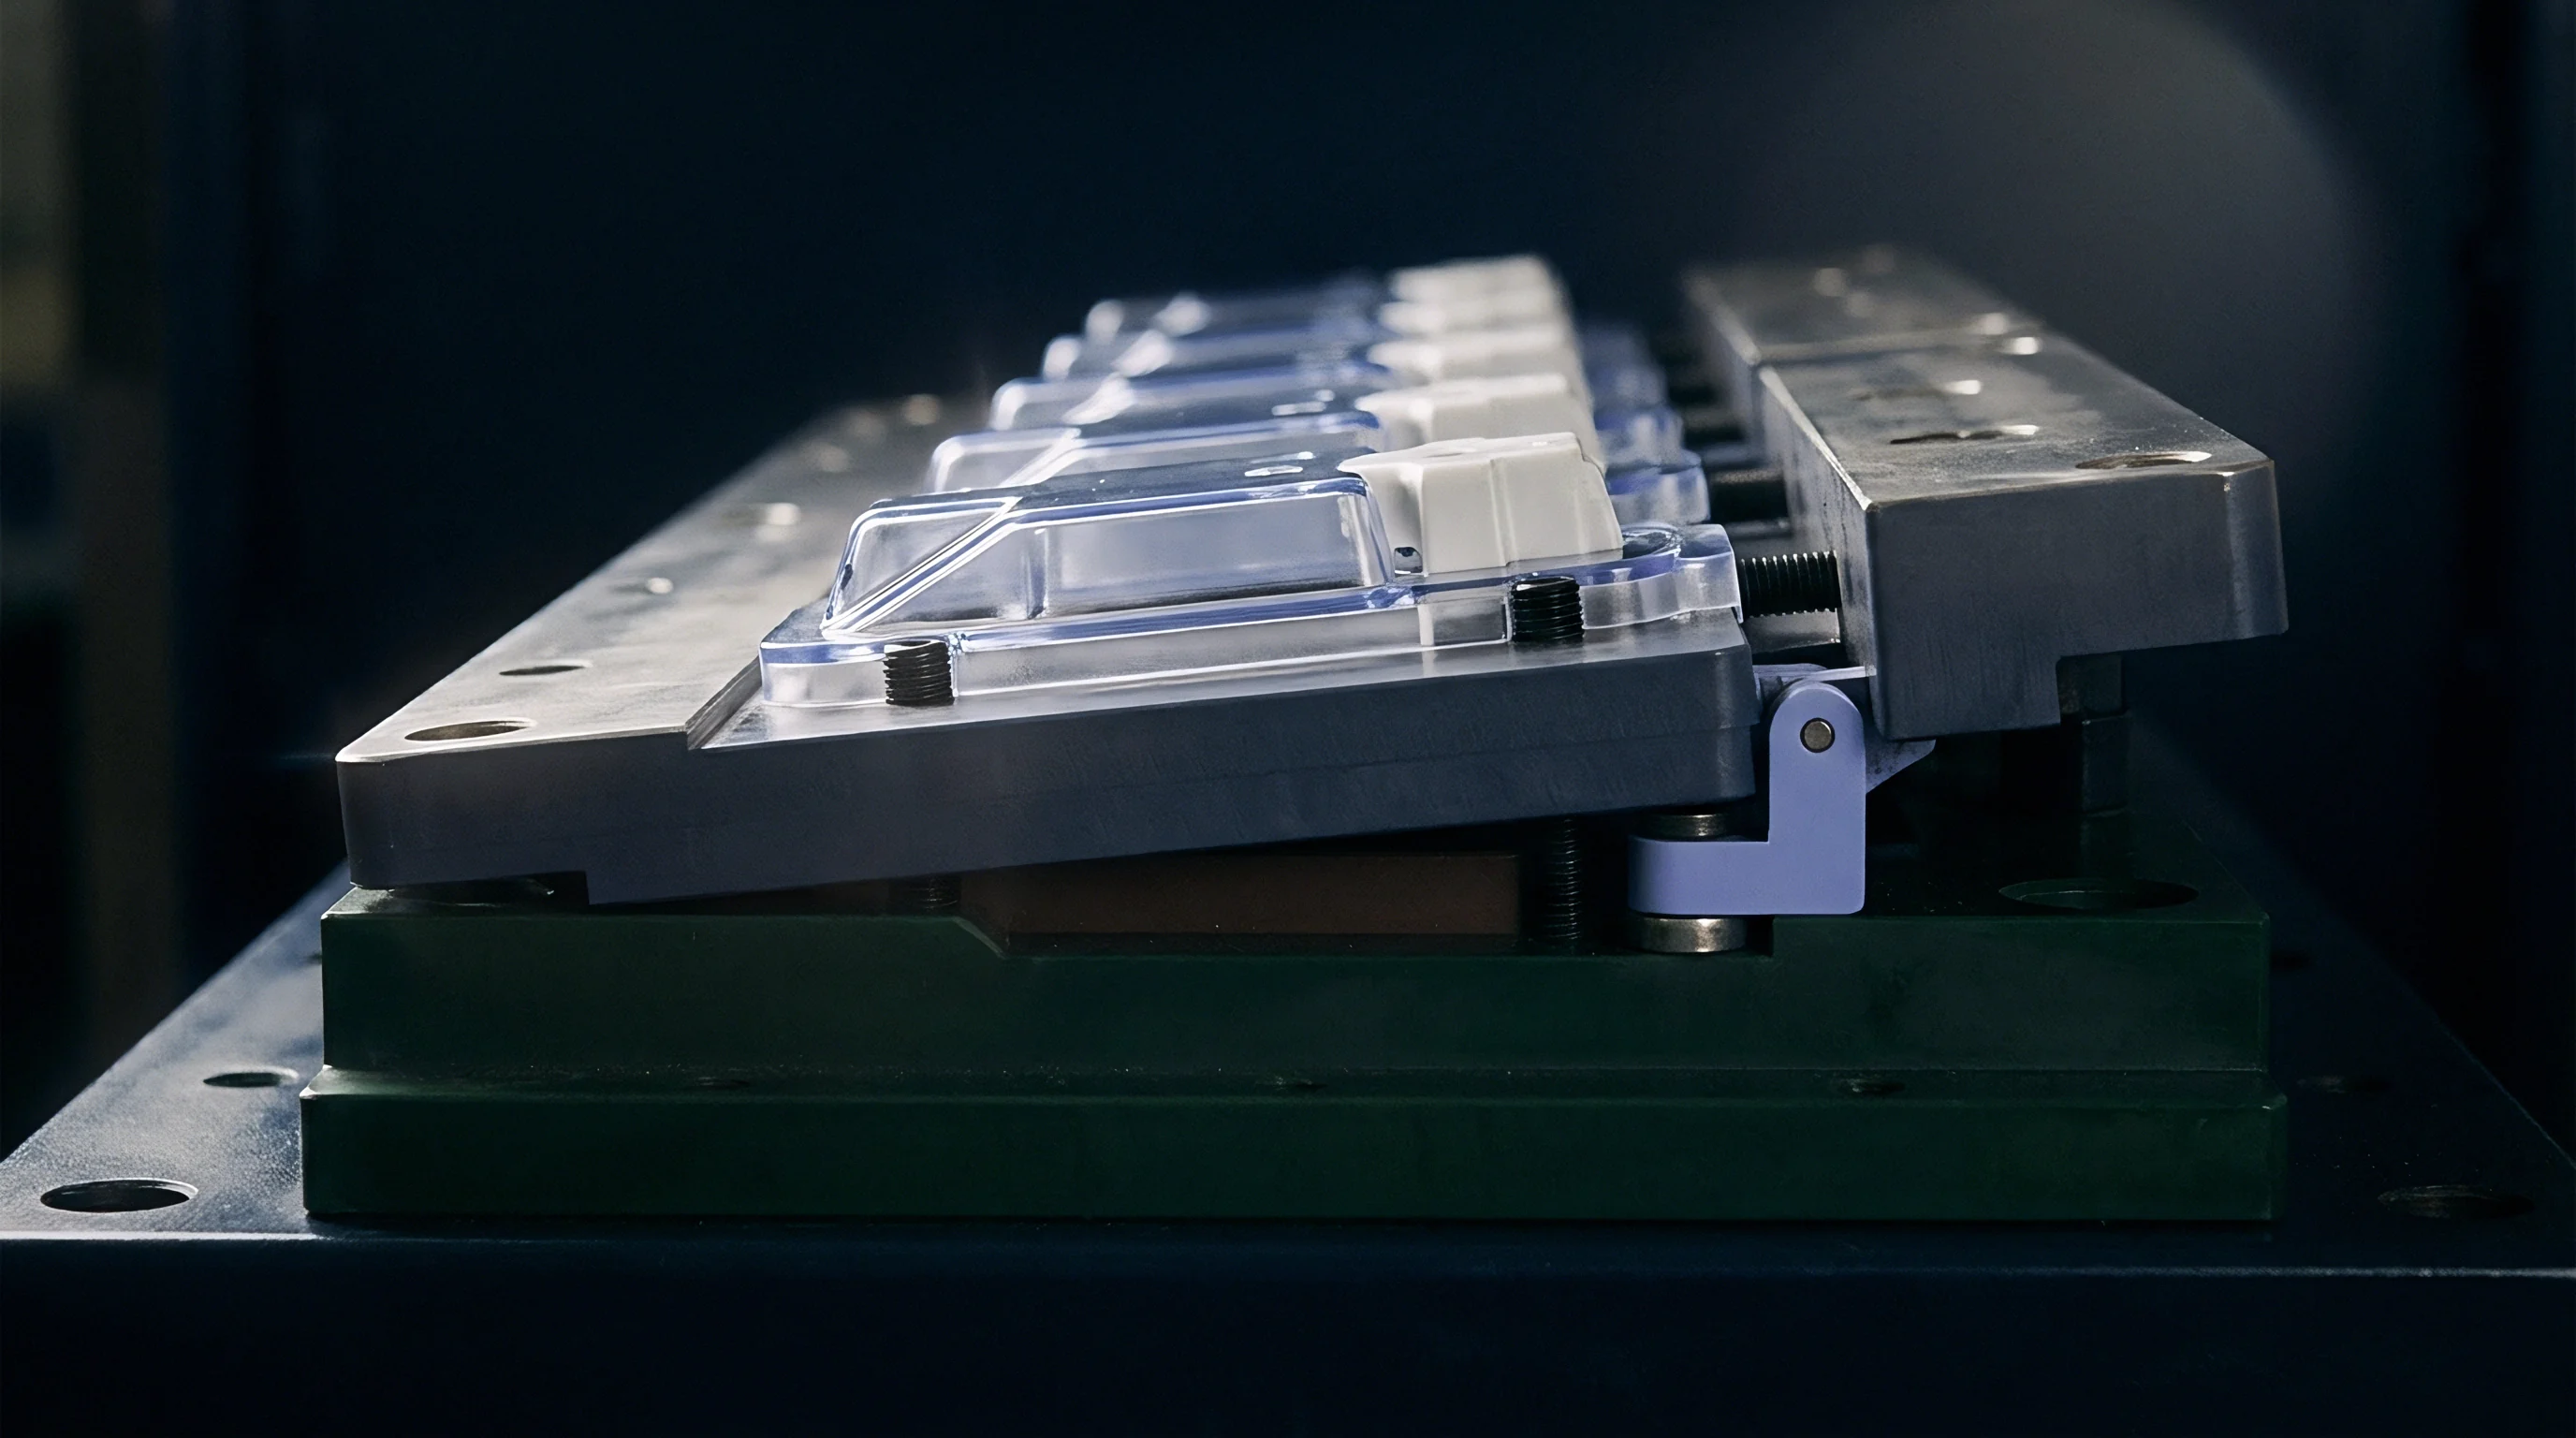
Direct sensing places the diaphragm interface flush with the cavity surface. This orientation eliminates mechanical force attenuation caused by ejector pin friction and lateral binding. High abrasive wear from glass-filled resins degrades direct diaphragm surfaces over extended production runs.
Direct mount geometries leave a permanent raised or recessed witness mark ranging from 2.5 to 6.0 millimetres in diameter on the finished part surface. Optical components and medical housings frequently reject witness marks in active functional areas.
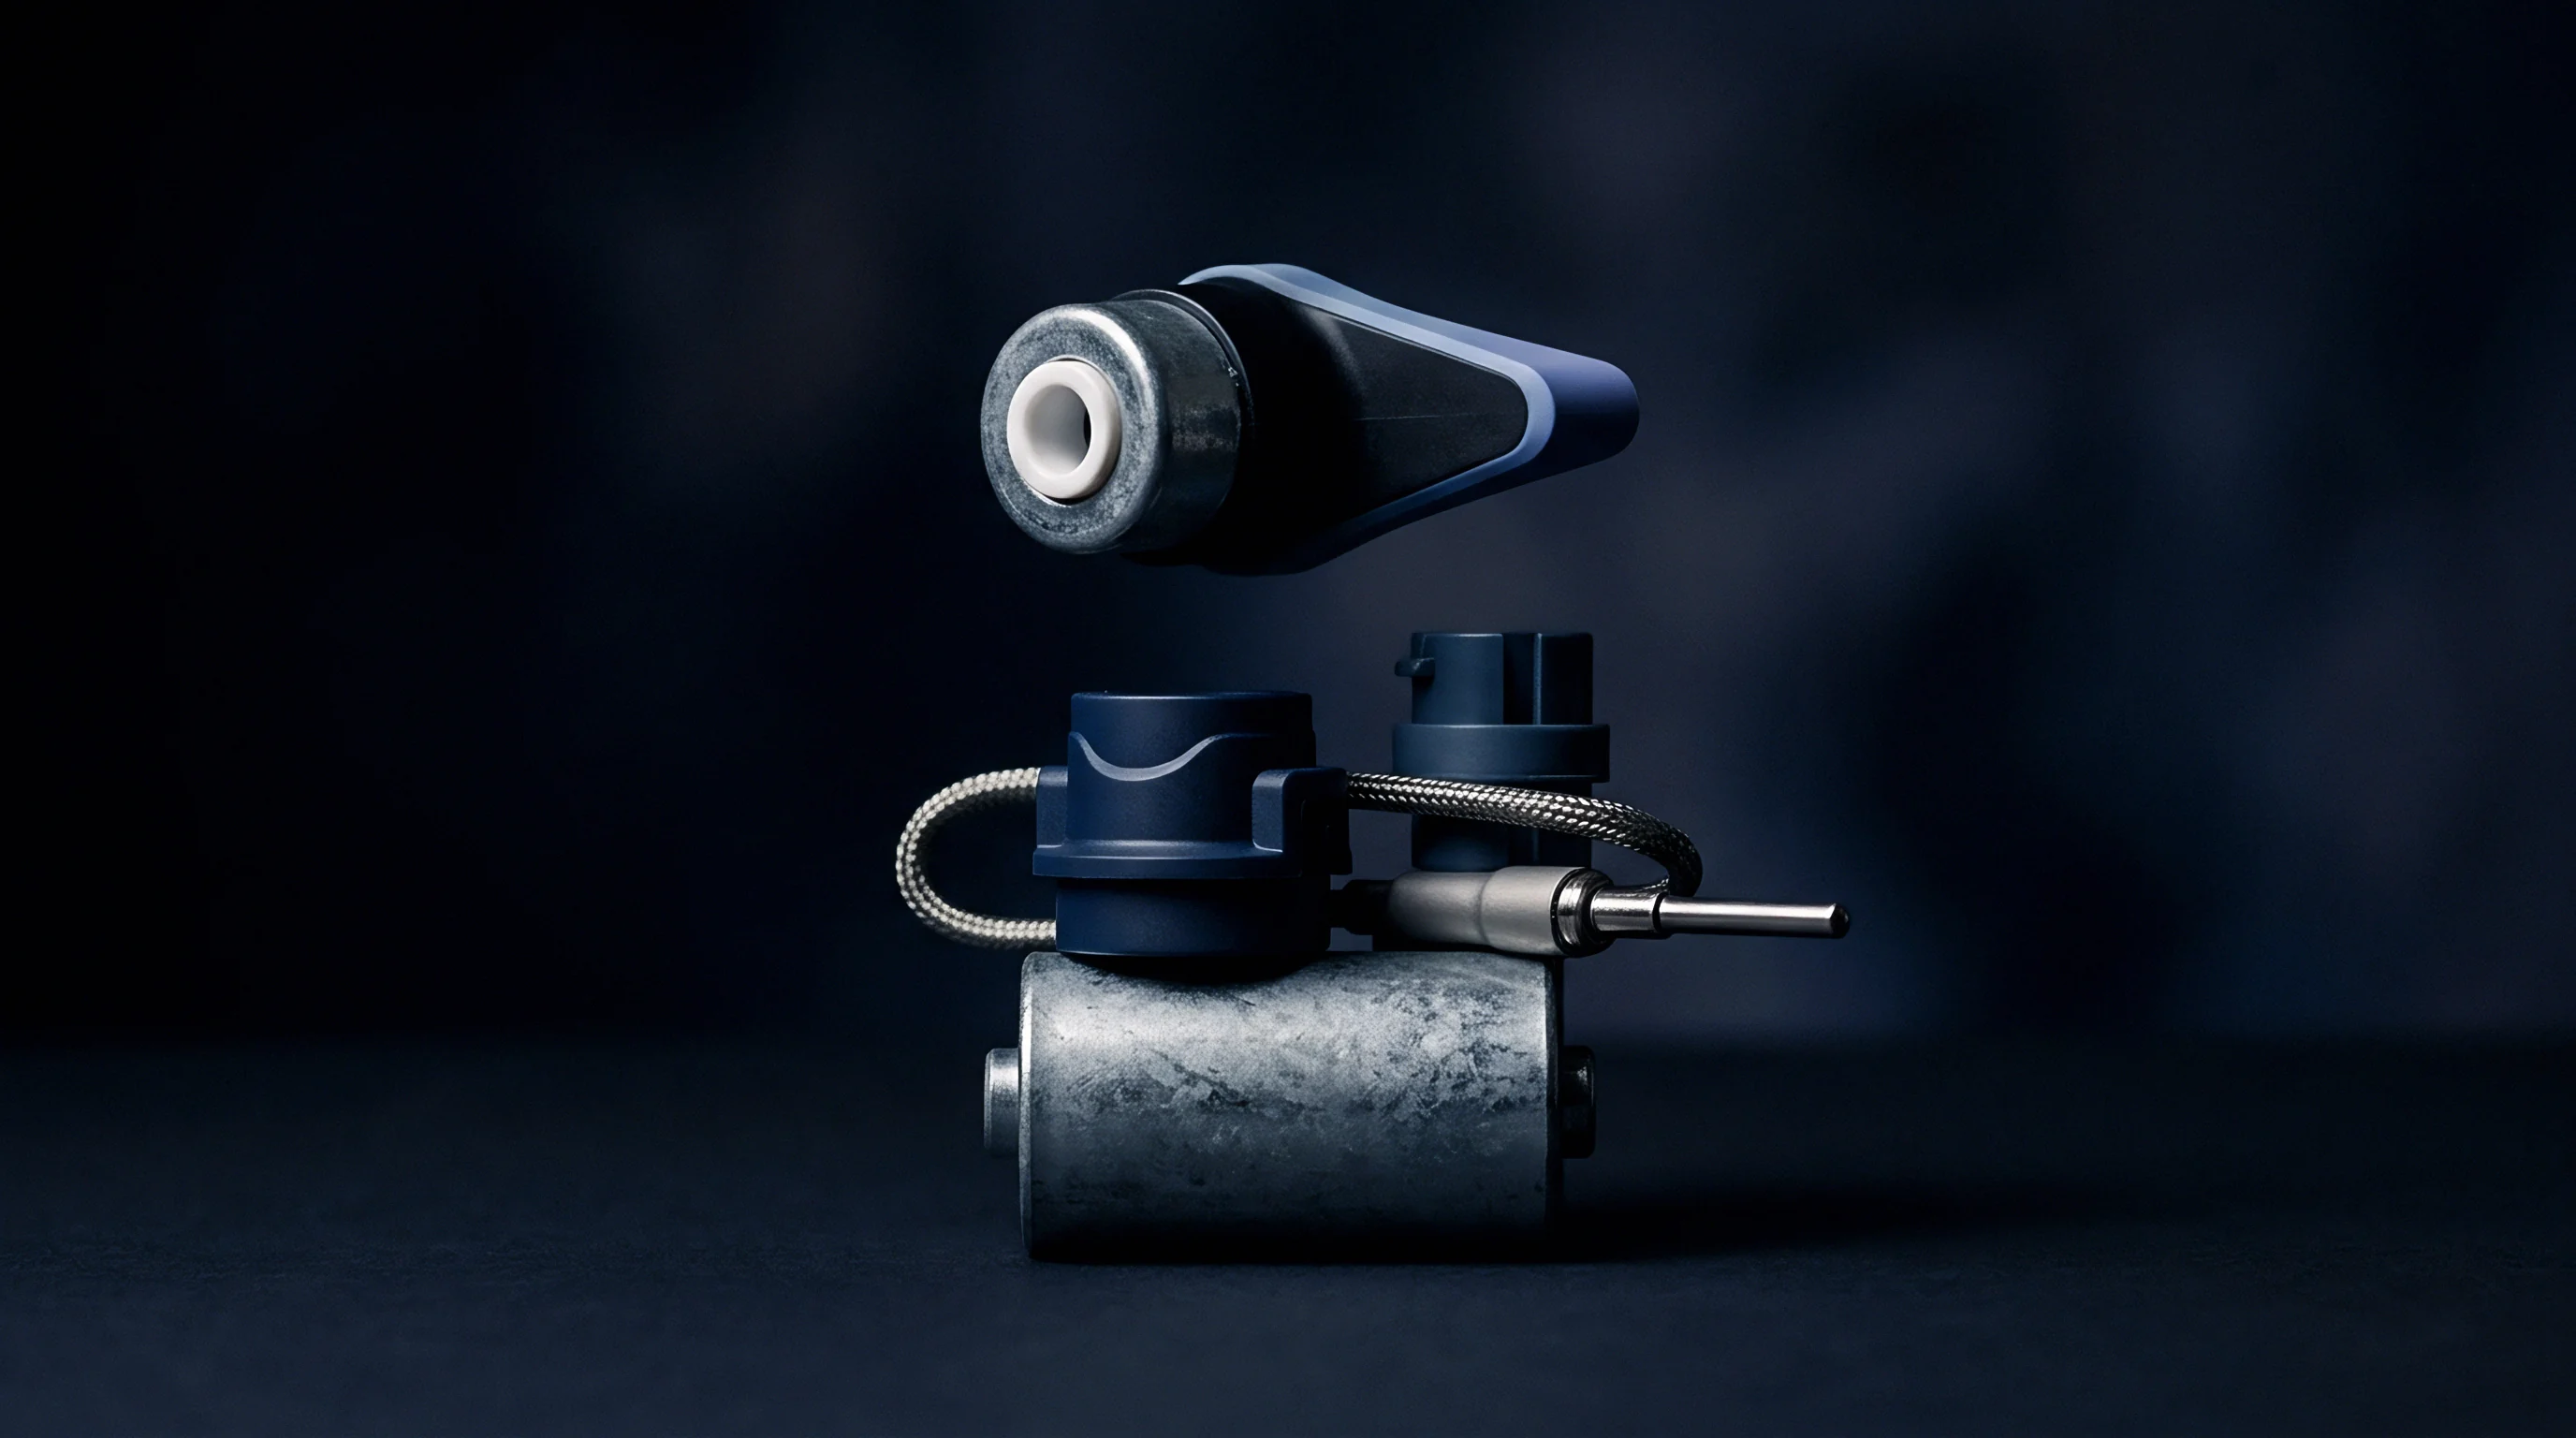
Force Transfer Dynamics in Cavity Pocketing
Indirect installations position a force button underneath a standard ejector pin or dedicated force pin. The pin collects hydraulic force from the melt and transfers that load along its longitudinal axis to the sensing head behind the ejector plate. Frictional losses along the pin hole wall absorb energy.
This attenuation reduces the net force reaching the sensor by 5 to 18 percent depending on pin clearance, length-to-diameter ratio, and lateral resin flash.
| Parameter | Direct Cavity Sensor | Indirect Pin Transducer |
|---|---|---|
| Contact Interface | Diaphragm flush with melt | Ejector or measuring pin base |
| Part Surface Impression | Circular witness ring | Standard ejector pin mark |
| Force Attenuation Range | 0 percent loss | 5 to 18 percent frictional loss |
| Pocket Machining Tolerance | H7 boring, Ra 0.4 roughness | H7 pin bore, flat pocket base |
| Thermal Isolation Capability | Direct melt contact heat exposure | Thermally isolated behind cavity wall |
Indirect mounting systems accommodate tighter space constraints inside complex multi-slide tooling inserts. Measuring pins as small as 1.0 millimetre in diameter can route force signals out of narrow ribs and isolated boss geometries where direct sensors physically cannot fit.
Indirect mounting transfers force through a secondary pin, introducing mechanical friction that absorbs peak force before signal transmission begins.

Mechanical Deflection and Pocket Tolerances
Sensor pocket preparation determines operational accuracy over millions of production cycles. Machining the sensor seat flat within 0.005 millimetres prevents asymmetrical loading across the quartz element. Non-parallel seats induce shear stresses that skew voltage output.
Toolmaking shops ground sensor pockets using specialized end mills to ensure perpendicularity to the pin bore axis.
Improper pocket depth creates mechanical binding or excessive pin float. A pin that extends too far into the cavity generates an indented flash trap, while a recessed pin allows polymer to freeze over the pin tip, locking the transmission rod in place.
- Pin misalignment ~ Angular deflection in the force transmission rod creates lateral friction that dampens peak pressure readings.
- Pocket thermal expansion ~ Clearance below target tolerances causes sensor housing binding when the tool reaches operating heat.
- Melt flash seepage ~ Excess clearance around the force pin permits resin penetration that locks the force transfer mechanism.
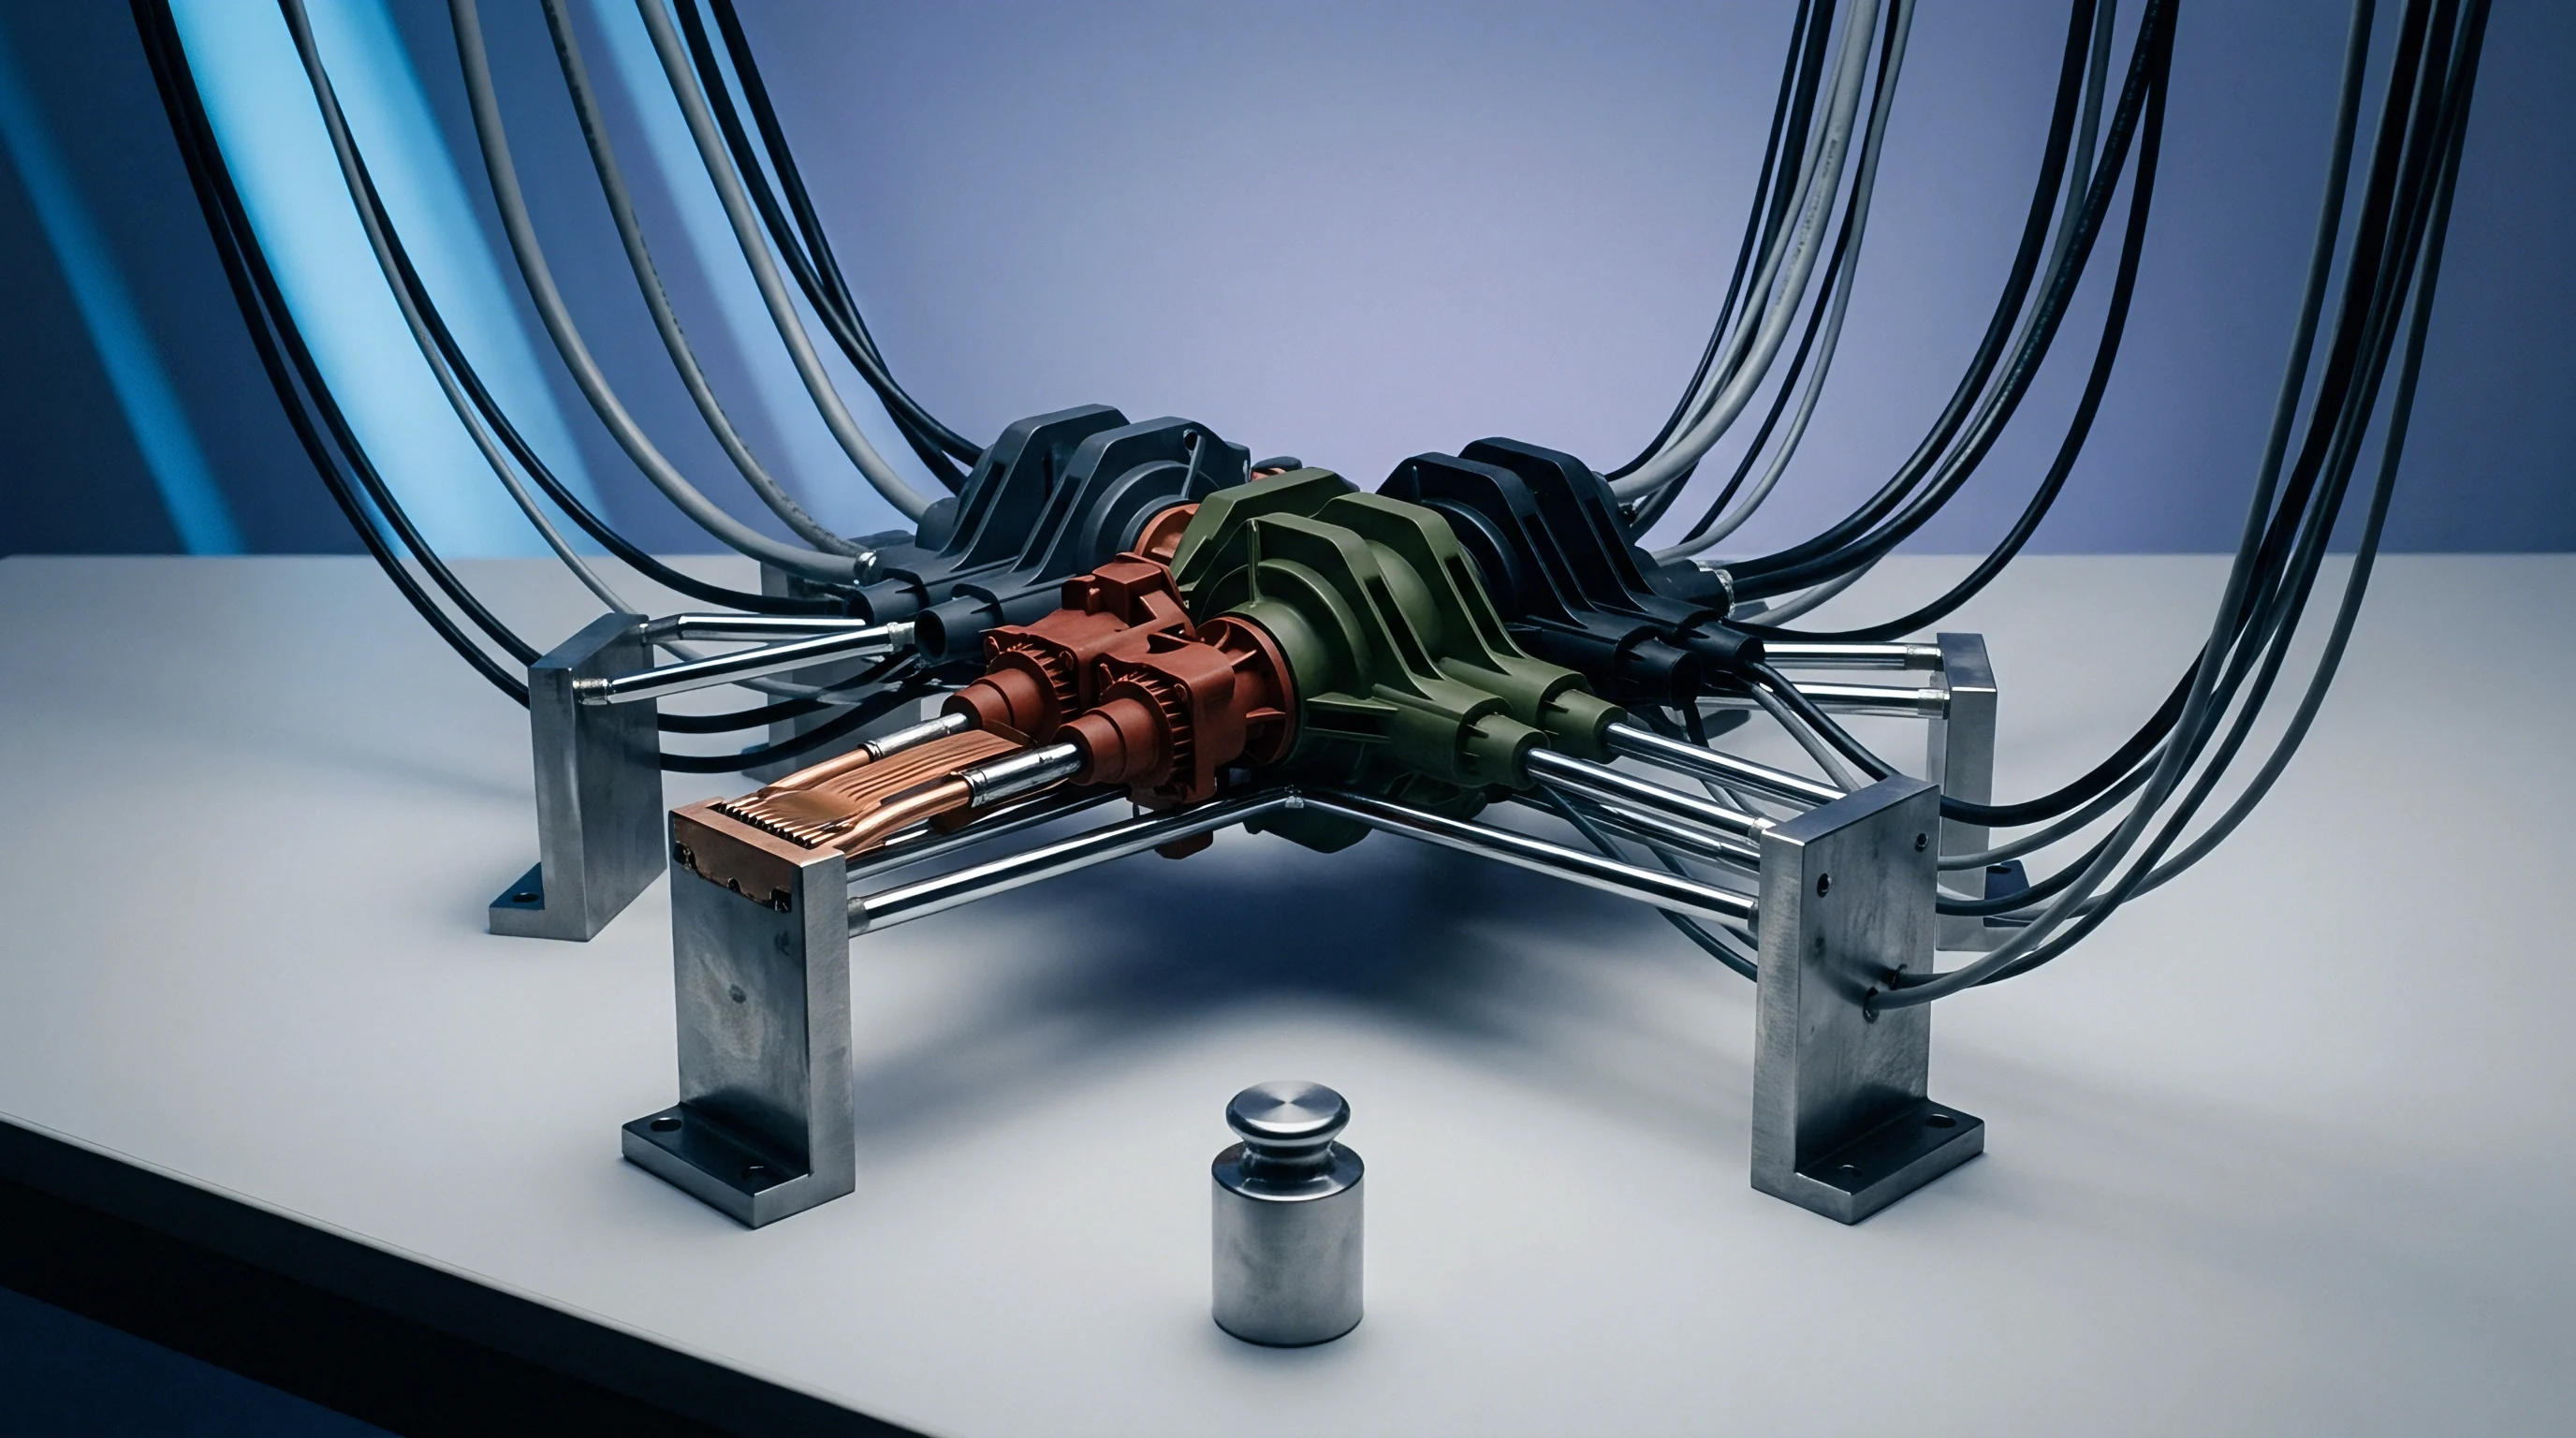
- Cable shear during ejection ~ Poor routing along the ejector plate pinches wiring during high-speed forward strokes.
Selecting incorrect pin clearances permits polymer melt migration into the ejector bore, binding the force transmission shaft and causing complete signal attenuation that misleads machine control systems into over-packing the cavity, which flashes the tool parting line and warps the core steel.

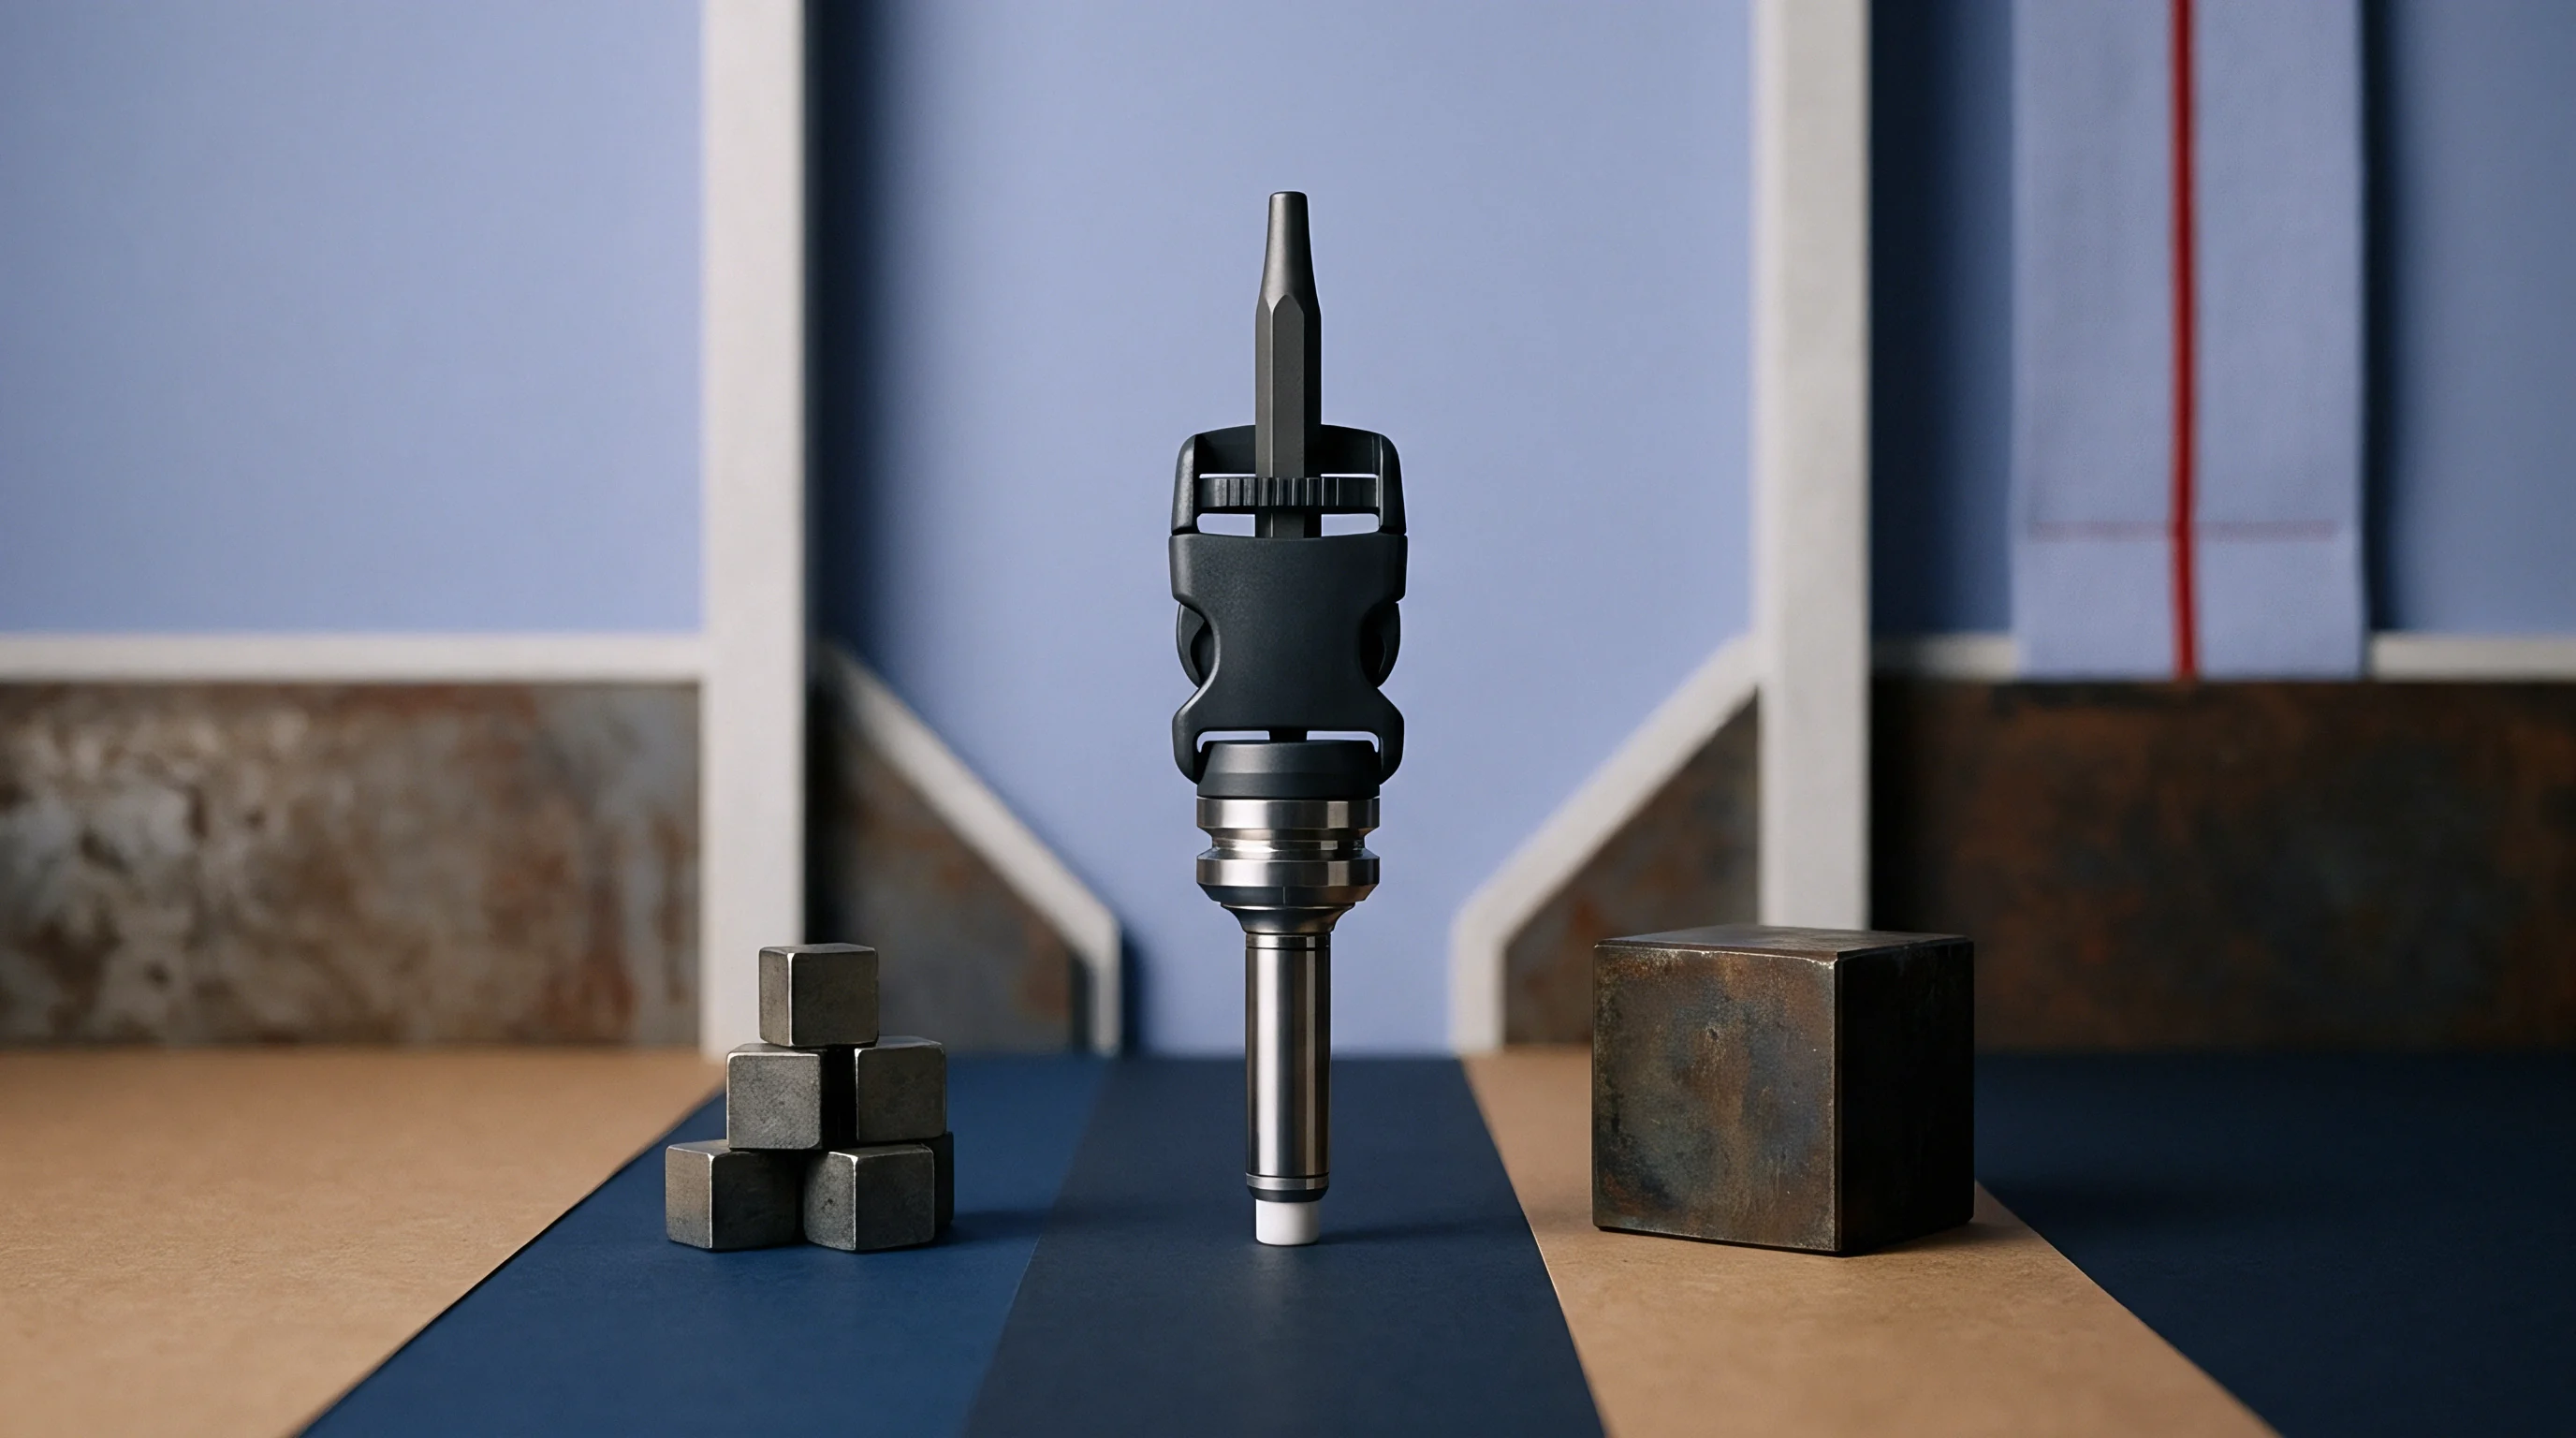
Transduction
Electric charge generation within synthetic quartz elements forms the foundation of modern high-frequency melt monitoring. Quartz crystals release a precise electrical charge in pico-Coulombs directly proportional to applied mechanical load. Quartz crystals generate linear charge.
Piezoelectric response remains instantaneous. This phenomenon maintains linear behavior across pressure ranges from 0 to 2500 bar, unaffected by mechanical transducer deflection.
Piezoresistive and strain-gauge sensors utilize semiconductor elements bonded to a flexing metallic diaphragm. Applied melt pressure alters electrical resistance across an energized Wheatstone bridge circuit. Piezoresistive configurations output continuous millivolt signals, making them suitable for slow continuous processing applications like extrusion monitoring.

Piezoelectric Quartz Vs Piezoresistive Sensing
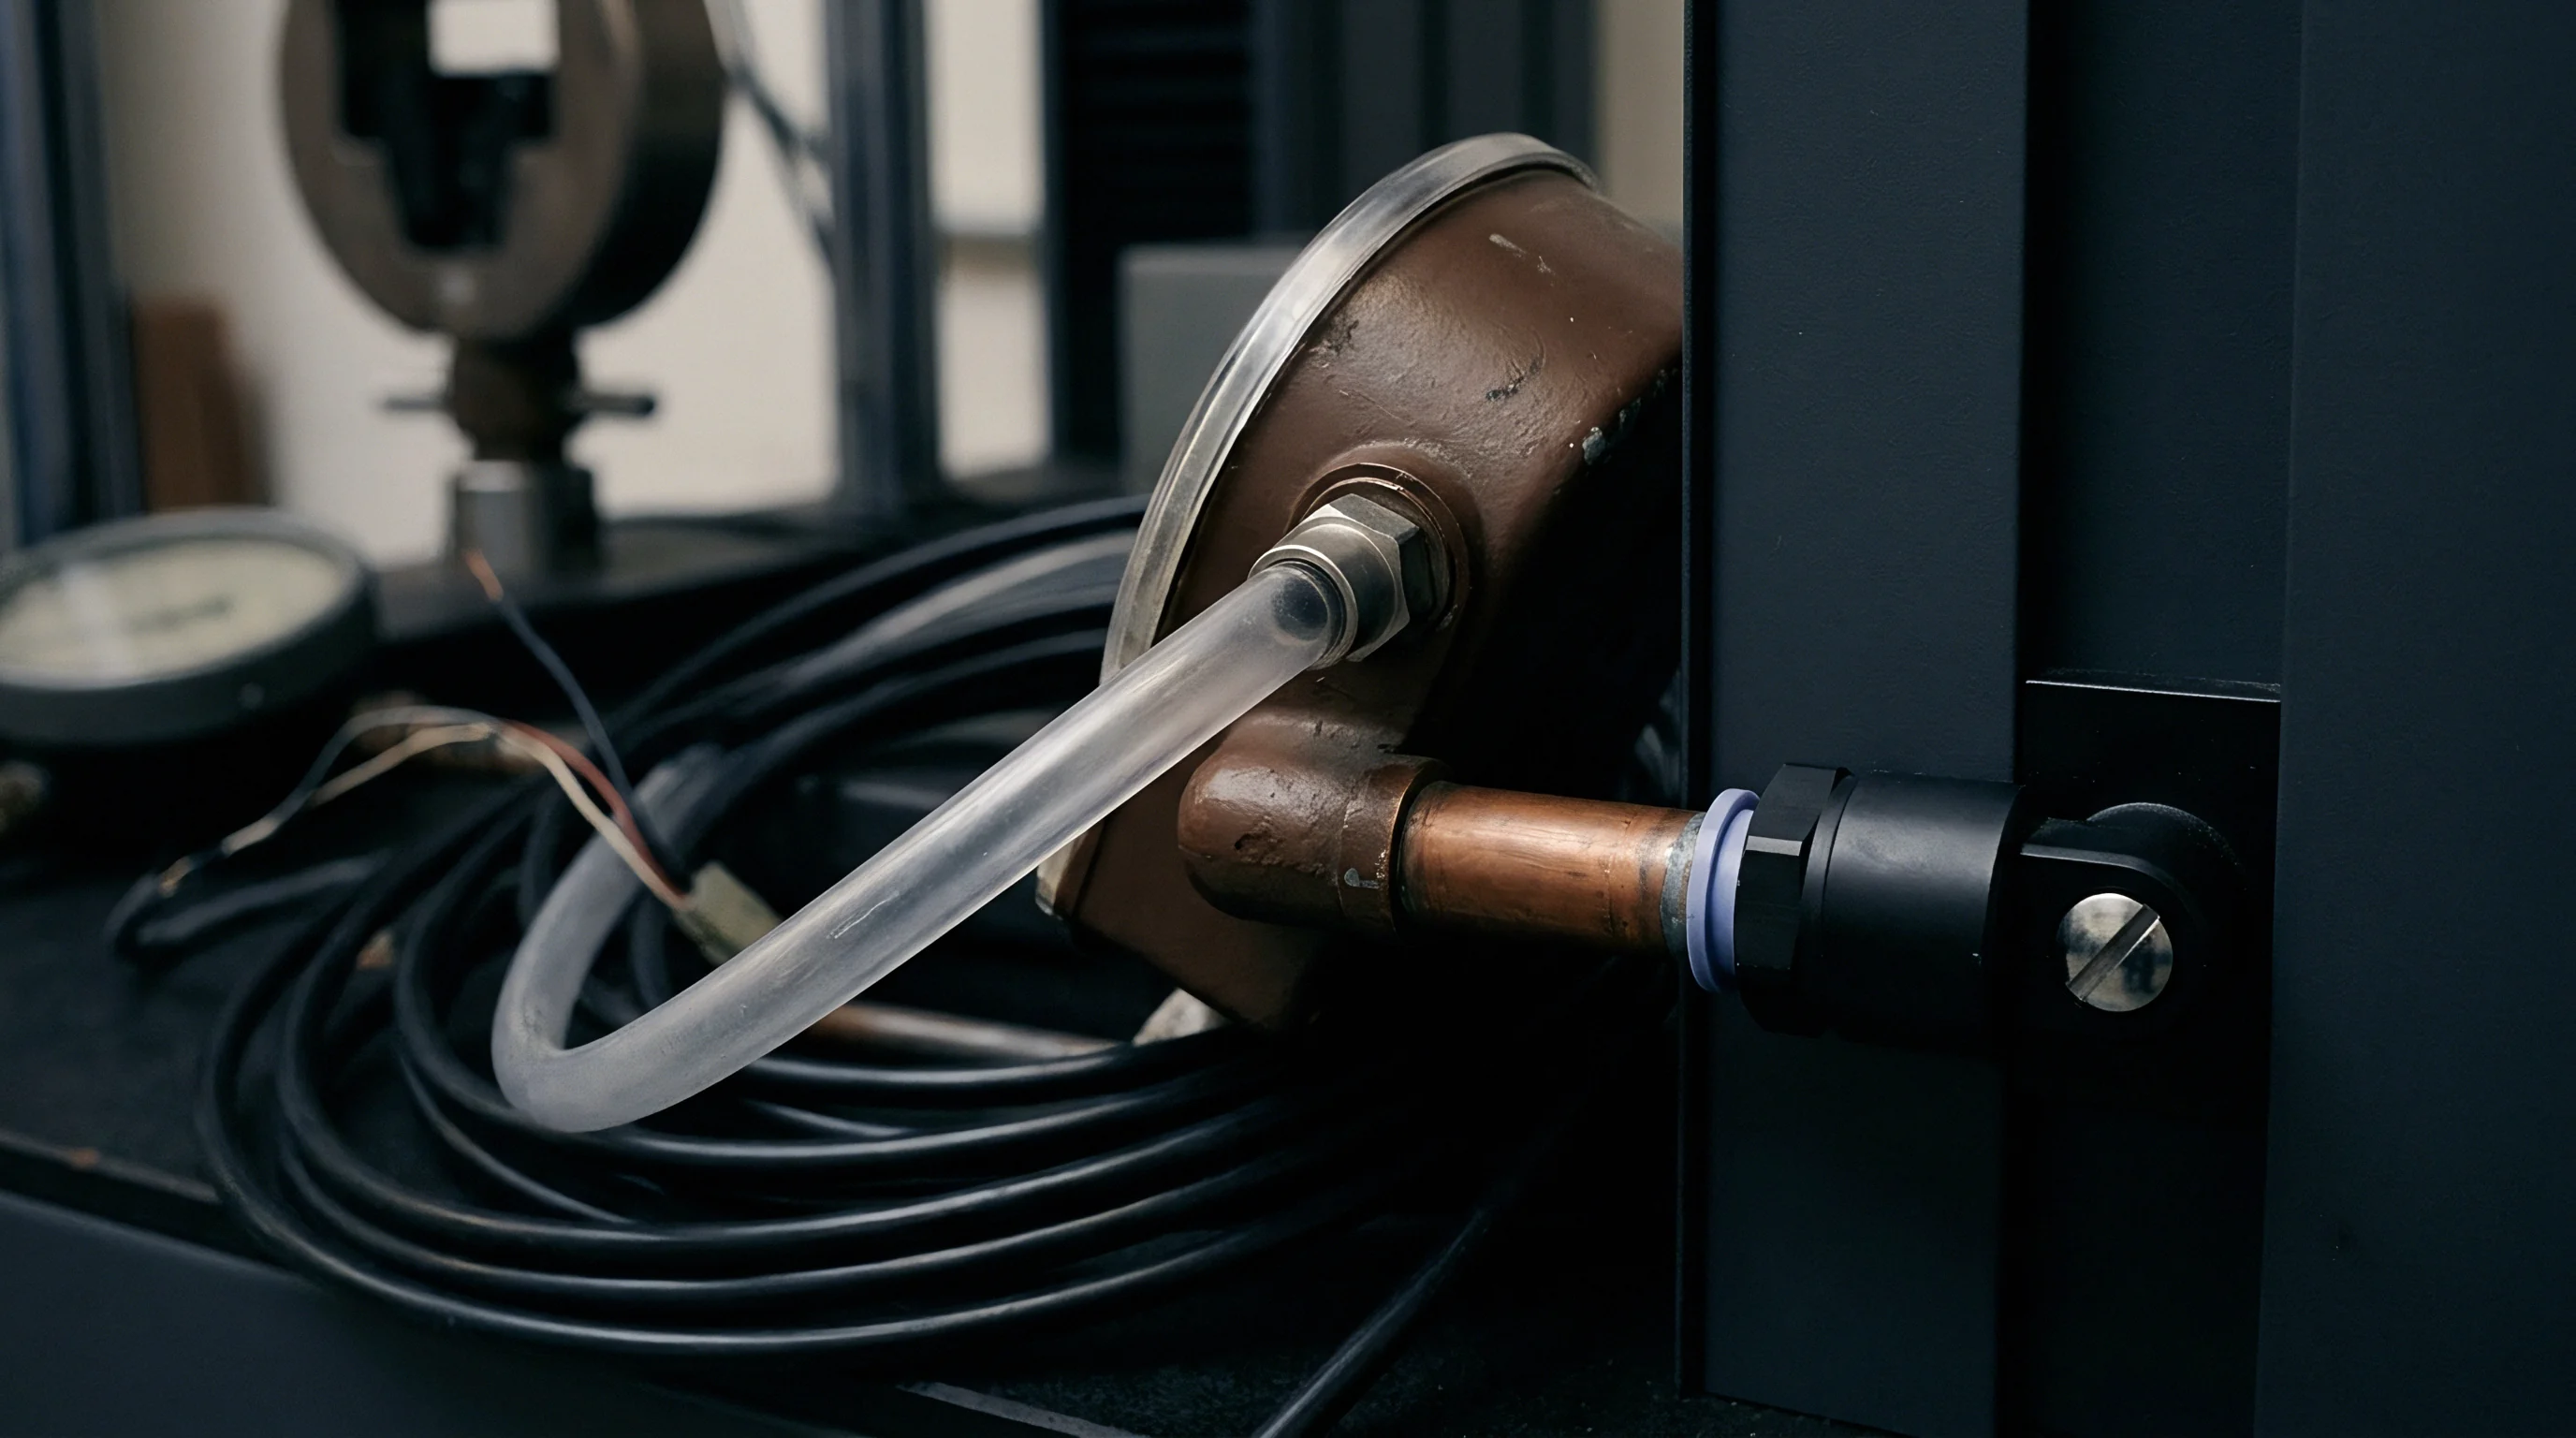
Piezoelectric sensors require ultra-high insulation resistance across signal cables to prevent charge leakage. Cable insulation values must exceed 100 teraohms. Contamination from cutting fluids or grease lowers cable insulation resistance, causing rapid signal drift down to zero.
Piezoresistive sensors bypass charge leakage vulnerabilities by using standard voltage or current loops, though their temperature limits sit lower than quartz options.
| Sensing Technology | Maximum Temperature | Drift Sensitivity | Space Requirement | Relative Cost Factor |
|---|---|---|---|---|
| Piezoelectric Quartz | 300 degrees Celsius | 0.01 bar per second | Compact 1.5mm to 6mm | 1.0 Baseline |
| Piezoresistive Diaphragm | 150 degrees Celsius | Zero static drift | Medium 6mm to 12mm | 0.75 Lower |
| Thick-Film Strain Gauge | 200 degrees Celsius | 0.05 bar per second | Large 10mm to 16mm | 0.60 Lowest |
Quartz sensors handle cyclic injection moulding dynamics where rapid pressure spikes occur within fractions of a second. The high natural frequency of synthetic quartz, often exceeding 100 kilohertz, captures high-speed pressure fronts without signal smoothing or phase lag.
Charge amplifiers operating at 200 degrees Celsius experience thermal drift exceeding 0.5 percent per minute when cable insulation resistance drops below 10 teraohms.

Thermal Drift and High-Temperature Signal Integrity
Thermal expansion alter zero points during continuous tool heating. As the mold temperature rises from ambient to operating setpoints, expanding pocket steel alters baseline pre-load forces on the sensor body. Piezoelectric charge amplifiers reset signal baselines between cycles to eliminate thermal expansion offsets.
Drift degrades long pack cycles. Extended hold times exceeding sixty seconds allow residual thermal drift to accumulate inside charge amplifiers, skewing integral pressure calculations. High-temperature applications above 200 degrees Celsius utilize specialized hard-wired mineral-insulated cables to withstand sustained heat exposure inside the mold frame without insulation degradation.
- Operating temperature ceiling ~ Piezoelectric elements function up to 300 degrees Celsius without thermal signal degradation.
- Measurement duration limits ~ Piezoresistive sensors maintain continuous stability for extended packing phases exceeding sixty seconds.
- Space envelope constraints ~ Direct miniature sensors fit spaces down to 1.5 millimetres diameter without requiring dummy pins.
- Signal noise immunity ~ Charge amplifiers situated within three metres of the tool mitigate capacitive loss across transmission lines.
Sensor manufacturers claim that signal instability beyond baseline specification limits stems entirely from operator mishandling and improper cable torque during mold installation rather than intrinsic crystal lattice depolarization under thermal cycling.

Window
Process optimization in scientific injection moulding relies on exact pressure transitions inside the mould cavity rather than hydraulic machine positions. Melt viscosity varies across batches. Hydraulic pressure masks cavity resistance.
Switching from high-speed filling to controlled packing based on internal melt pressure decouples processing stability from machine hydraulic drift and resin viscosity shifts.
Viscosity alterations occur when regrind content fluctuates or raw material lot properties shift. Standard machine control switches filling to packing when the screw reaches an axial position. If melt viscosity drops, position-based switchover over-packs the cavity, generating flash.
Cavity pressure switchover triggers the transition when polymer actually reaches the sensor, maintaining consistent volumetric filling regardless of viscosity variation.

How Does Cavity Pressure Decouple Melt Temperature Shifts?
Melt temperature alterations alter resin flow resistance along the flow path. Cooler resin increases flow resistance, reducing peak cavity pressure under fixed hydraulic injection profiles. Real-time pressure feedback allows closed-loop machine controllers to alter screw velocity and hold duration automatically to maintain target pressure integral curves.
Molders switch on pressure thresholds. Matching the pressure threshold to the filled cavity volume prevents cosmetic sink marks and dimensional flash. Tracking integral pressure values across the cycle correlates directly with part weight and linear shrinkage values.
Setting up an accurate velocity-to-pressure switchover profile requires systematic calibration during initial tool commissioning:
- Fill the tool under velocity control to ninety-five percent volume without applying holding pressure.
- Record the peak pressure sensor voltage attained at the precise moment of volumetric fill completion.
- Set the machine switchover trigger value to match ninety percent of the measured peak cavity signal.
- Increase holding pressure gradually while monitoring part weight until gate seal occurs.

Velocity to Pressure Switchover Control Mechanics
Transferring control at exact pressure thresholds eliminates short shots caused by cold resin batches. Real data replaces machine estimates. Position switchover strategies leave the process vulnerable to thermal expansion of the injection screw and barrel, which alters effective cushion volume across shifts.
Sensors located near the gate monitor switchover conditions, while end-of-fill sensors confirm complete cavity packing. Dual-sensor setups compare pressure timing differences to calculate effective melt velocity through the tool geometry.
Switching control off a gate-area sensor before volumetric fill completes causes jetting and sink marks along distant wall sections.

Dossier
High-speed data acquisition cards record charge signals at frequencies exceeding two kilohertz to capture real-time packing behavior. Digital sampling systems digitize analog pico-Coulomb signals, transforming continuous electrical output into numerical data curves for statistical analysis. High sample rates reveal spikes.
Bad data ruins good parts. Filtering algorithms strip out high-frequency electrical noise generated by heater bands and drive motors without smoothing critical pressure peak details.
Quality management systems utilize complete cavity pressure curve metrics as individual electronic part records. Comparing live pressure curves against an established template envelope enables automated part rejection immediately at mold opening, routing defective components to scrap chutes before downstream assembly takes place.
Data Acquisition Rates and Closed-Loop Feedback
Digital signal processors integrate cavity pressure curves over time, producing a single numerical value known as the pressure integral. The pressure integral value reflects total energy transferred into the polymer during filling and packing phases. Statistical process control software tracks pressure integral variations to predict final part density and post-mould shrinkage values.
Analog voltage outputs, typically 0 to 10 volts, connect directly into machine control cabinets. Real-time analog signals enable active closed-loop hold pressure regulation, altering hydraulic or electric servo torque within milliseconds to match preset curve profiles.
Under ISO 20457 Clause 6.3, dimensional acceptance for precision optical components requires continuous cavity pressure records for every shot within the lot dossier.

Quality Record Documentation for Medical and Automotive Tooling
Automotive and medical moulding operations archive curve data for total traceability compliance. Automated systems bind cavity pressure integral figures, peak pressure numbers, and switchover timing metrics directly to part serial numbers or batch lot IDs.
Validation frameworks demand detailed documentation proving sensor system calibration and operational repeatability across production runs:
- Signal calibration certificates ~ Factory calibration sheets establish exact pico-Coulomb per bar sensitivity constants for each channel.
- Wiring schematic drawings ~ Electrical layout documents detail connector pinouts and junction box grounding configurations.
- Sensor location drawings ~ Tooling blueprints specify exact cavity distances from gates and vent channels.
- Trial trace reference files ~ Baseline pressure profiles define the reference envelope for acceptable production parts.
Contractual quality clauses stipulate that any production lot lacking complete digital cavity pressure trace records per individual shot fails compliance verification, resulting in lot rejection and full financial liability for quarantined components.
Yield
Financial returns on precision tooling investments depend directly on scrap rate suppression and cycle time compression. Installing pressure monitoring systems increases initial tooling procurement costs by thousands of dollars per cavity. Tooling budgets require clear payback.
Multi-cavity molds multiply sensor expenses. Justifying transducer expenditures requires evaluating reduced startup scrap, eliminated destructive testing, and optimized cooling cycles.
Detecting short shots in multi-cavity tools without cavity sensors requires visual inspection or automated vision systems. Vision equipment fails to verify internal void formation or localized sink. Cavity pressure monitoring detects incomplete packing instantly, preventing defective parts from reaching downstream customers.
Cavitation Economics and Sensor Amortisation
High-cavitation tooling balance monitoring depends heavily on individual cavity sensor placement. Molds with 16, 32, or 64 cavities experience fill imbalance due to thermal variations across hot runner manifolds. Single-sensor monitoring fails to identify localized gate freeze or blocked vents in individual cavities.
| Cavitation Count | Sensor Capital Expense | Scrap Reduction Rate | Cycle Time Savings | Break-Even Volume |
|---|---|---|---|---|
| 4-Cavity Tool | 8,000 USD | 3.5 percent | 1.2 seconds | 140,000 units |
| 16-Cavity Tool | 28,000 USD | 5.0 percent | 2.0 seconds | 320,000 units |
| 32-Cavity Tool | 52,000 USD | 6.2 percent | 2.5 seconds | 510,000 units |
Amortising hardware expenses across high-volume production runs reduces unit overhead quickly. In a 16-cavity tool producing medical connectors, eliminating three minutes of scrap per shift covers initial sensor capital expenditure within six months of continuous operation.
Unmonitored cavitation drives tooling amortisation costs higher through undetected scrap runs during unattended night shifts.

Scrap Reduction Calculations and Tool Maintenance Budgets
Preventative tool maintenance scheduling uses peak cavity pressure trends to identify mechanical wear. Gradual increases in required peak pressure indicate venting degradation or gate erosion. Tracking these trends prevents catastrophic tool failures and unscheduled downtime.
Sensor maintenance budgets must include spare cable provisioning and periodic re-calibration services. High-cycle tooling subjects sensor wiring to millions of flex cycles, making cable replacement a standard annual maintenance line item.
What threshold of sensor installation cost relative to overall tooling build expenditure marks the economic boundary where full-cavity pressure integration ceases to deliver positive financial returns on medium-volume technical components?