Evaluating Shear Thinning Melt Disparities and Cavity Pressure Transducer Feedback in Multi Cavity Tooling
Real-time cavity pressure transducer feedback corrects shear-thinning thermal imbalances in multi-cavity tools by adjusting dynamic V/P crossover points.


Viscosity
Polymer melt moving through balanced injection moulding channels experiences non-uniform shear across its cross-section. Because polymer melts are pseudoplastic, they shear-thin during injection: higher shear rates untangle polymer chains and align them with the flow, dropping apparent viscosity. The highest shear stress develops along runner walls, where velocity gradients are steepest.
There, viscous dissipation converts mechanical energy into heat, raising localized temperatures while melt in the channel center sees almost no shear and stays cooler.
When this layered stream reaches a symmetrical branch, like a primary tee in a multi-cavity runner, those thermal layers split unevenly. The hot, high-shear boundary material along the wall flows preferentially into the inner branches, while the cooler, thicker core melt gets driven into the outer pathways. What started as a uniform melt stream splits into separate flows with noticeably different viscosity profiles.
Melt flowing through identical runner lengths experiences unequal thermal shear histories prior to cavity entrance.
These viscosity variations directly affect fill speeds, packing behavior, and local shrinkage. Amorphous resins like polycarbonate and polystyrene are especially sensitive to temperature, so small thermal shifts lead to large changes in flowability. Semi-crystalline materials like polyamide 66 and polybutylene terephthalate undergo steep viscosity changes around their melting points, turning minor shear heating differences into major filling imbalances between cavities.
Standard runner calculations based strictly on volumetric flow miss this boundary layer behavior. Even with identical flow lengths and diameters, outer cavities receive higher-viscosity melt, which demands higher fill pressure and delays gate seal. During initial tool trials, cavity imbalances are often attributed to minor surface finish variations or quarter-hundredth millimeter gate machining differences rather than non-Newtonian boundary layer rotation inside the feed system.

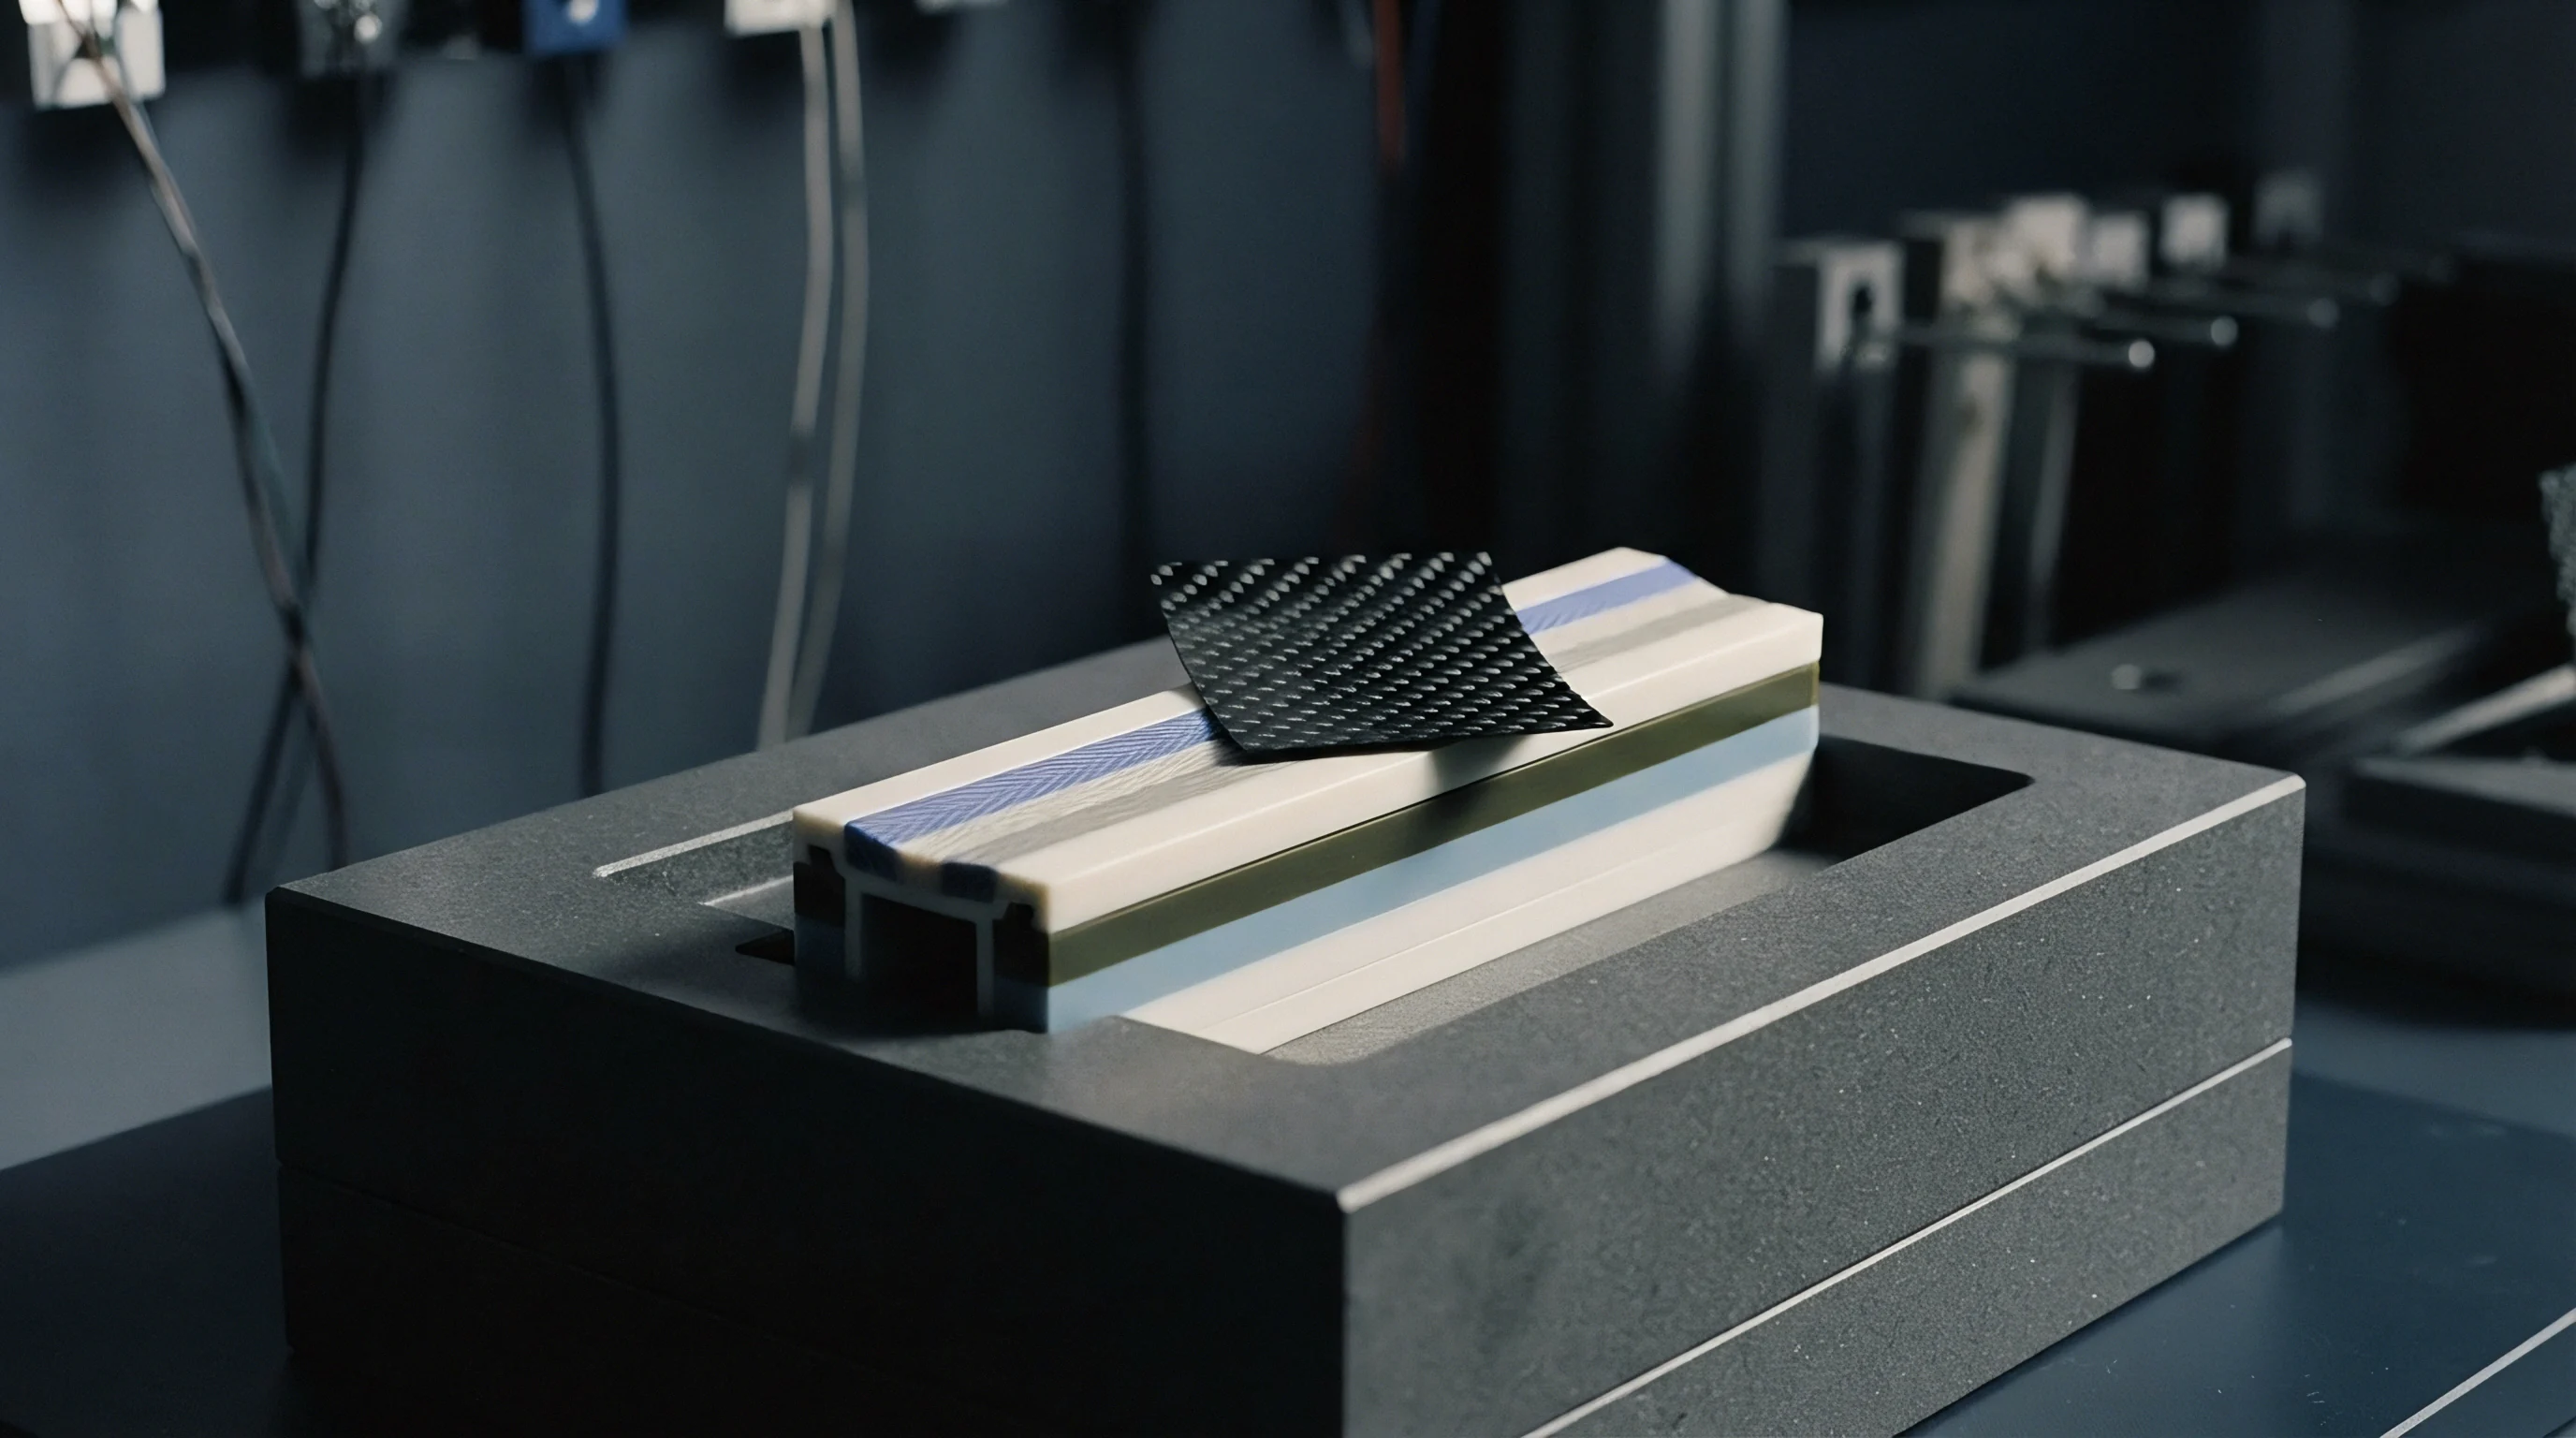
Branch
Correcting melt layer orientation across multi-cavity layouts requires geometric intervention upstream of the gates. Standard cold runner balancing relies on matching branch lengths and diameters. In eight- or sixteen-cavity H-patterns, this approach assumes a uniform, Newtonian fluid.
Instead, inner cavities collect the hotter wall melt while outer cavities receive the cooler core, causing predictable filling splits where inner impressions fill completely and outer ones short under identical injection pressures.
Melt rotation hardware changes this by physically shifting the shear-laminated layers at key junctions. Turn channels or specialized rotation inserts placed at secondary intersections flip high-shear material into the center of the runner stream before the next division. That way, each downstream branch gets an equal mix of high- and low-shear melt, balancing apparent viscosity at every gate.
Viscosity Disparity Metrics across Cavity Clusters
Thermal measurements taken at gate entrances show just how pronounced shear-induced temperature differences become in standard runner layouts.
| Runner Layout | Polymer Grade | Shear Rate Delta (1/s) | Melt Temp Delta (C) | Cavity Weight Variance (%) |
|---|---|---|---|---|
| Standard Geometric H-Pattern | PBT 30% Glass Filled | 4,200 | 11.4 | 4.82 |
| Standard Geometric H-Pattern | Unfilled Polycarbonate | 5,800 | 14.1 | 6.15 |
| Melt-Rotated Runner Geometry | PBT 30% Glass Filled | 650 | 1.8 | 0.65 |
| Melt-Rotated Runner Geometry | Unfilled Polycarbonate | 820 | 2.2 | 0.88 |
- Flash formation on inner cavities occurs when lower viscosity melt fills inner impression clusters ahead of outer cavities.
- Short shots on perimeter cavities arise from excessive pressure drop through high viscosity core material.
- Differential part shrinkage develops because non-uniform packing densities shift localized cooling rates.
- Warping in thin wall geometries manifests when pressure transfer timing varies across cavity positions.
A shear-rate differential exceeding 5,000 inverse seconds across runner branches generates a 12 degree Celsius thermal delta between adjacent cavity gates.
Trying to balance a multi-cavity tool simply by tweaking gate sizes creates secondary problems. Opening up outer gates lowers local flow resistance and helps equalize fill time during first-stage injection, but larger gates take longer to freeze off. Outer cavities then over-pack during hold, proving that symmetrical channels with equal flow lengths cannot ensure uniform filling with shear-sensitive resins.
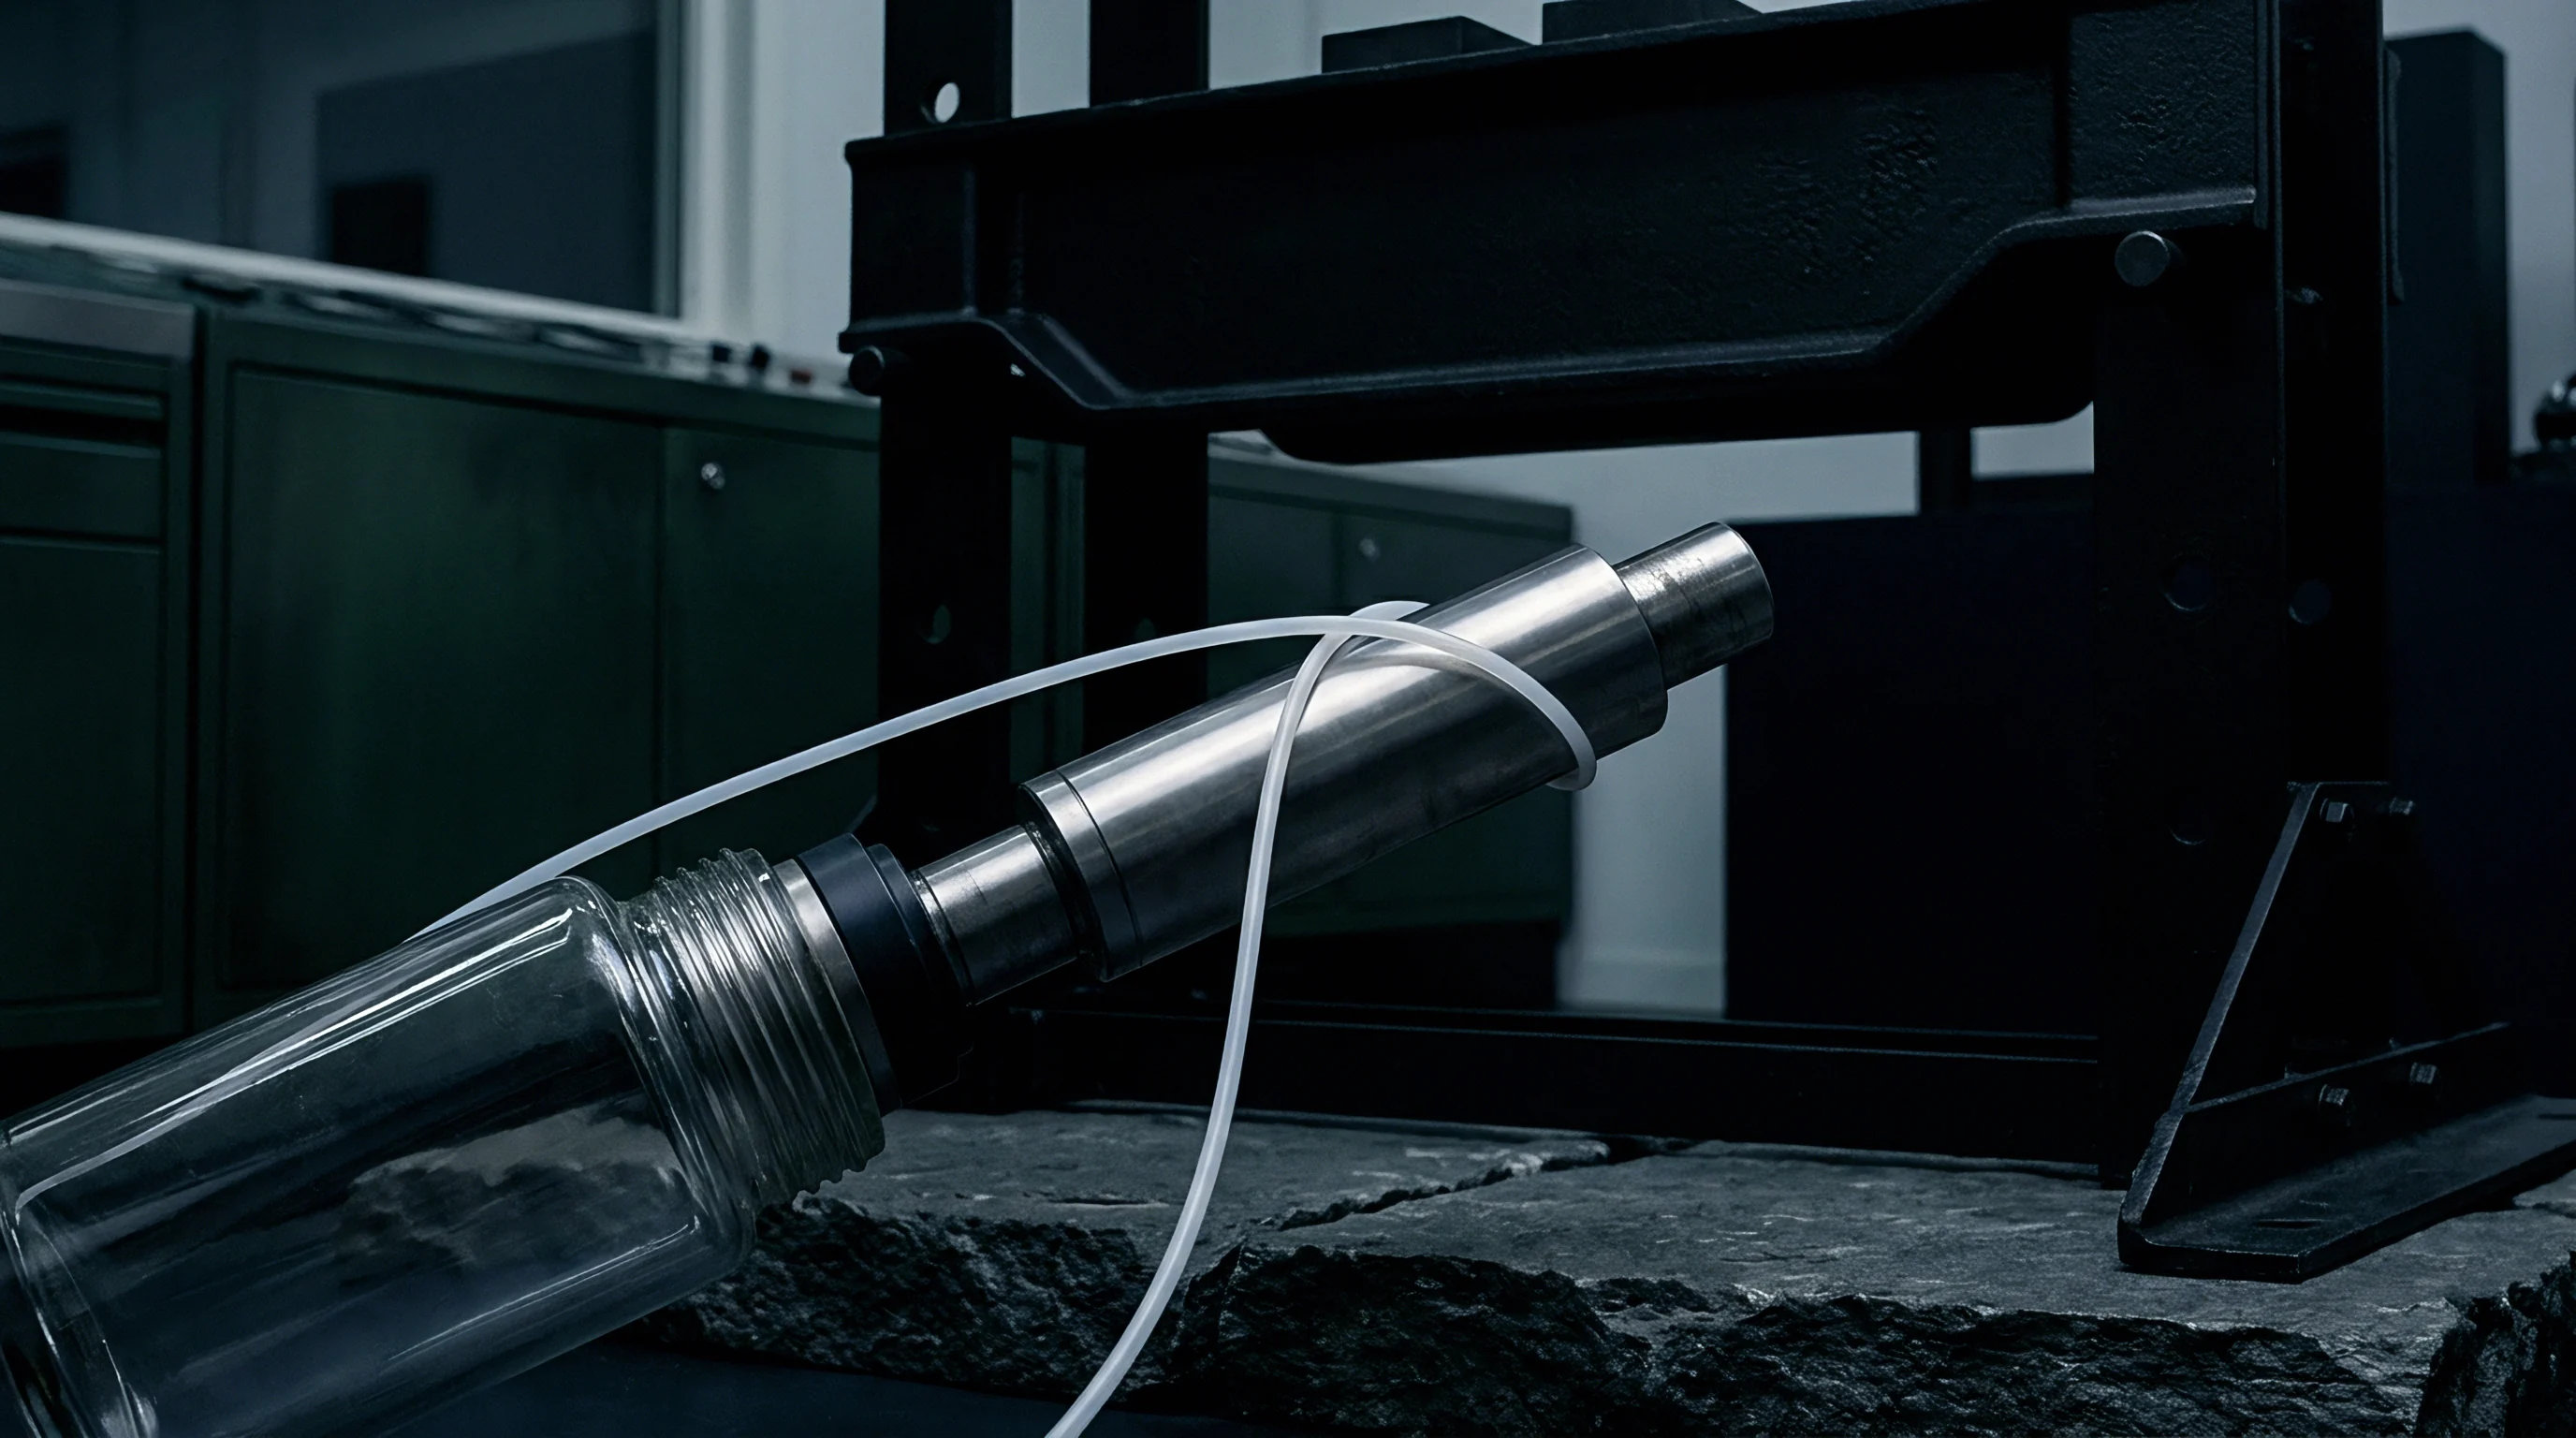

Probe
Piezoelectric quartz transducers convert mechanical cavity wall forces into measurable electrical charge during polymer injection. In-cavity pressure sensors give direct visibility into mould behavior during fill, pack, and cool. Piezoelectric quartz transducers work by generating an electrical charge proportional to compressive force.
They offer high rigidity, sub-millisecond response, and thermal stability up to 200 degrees Celsius. Strain gauge sensors use foil elements on a diaphragm; while less expensive, they suffer from greater thermal drift over long production runs.
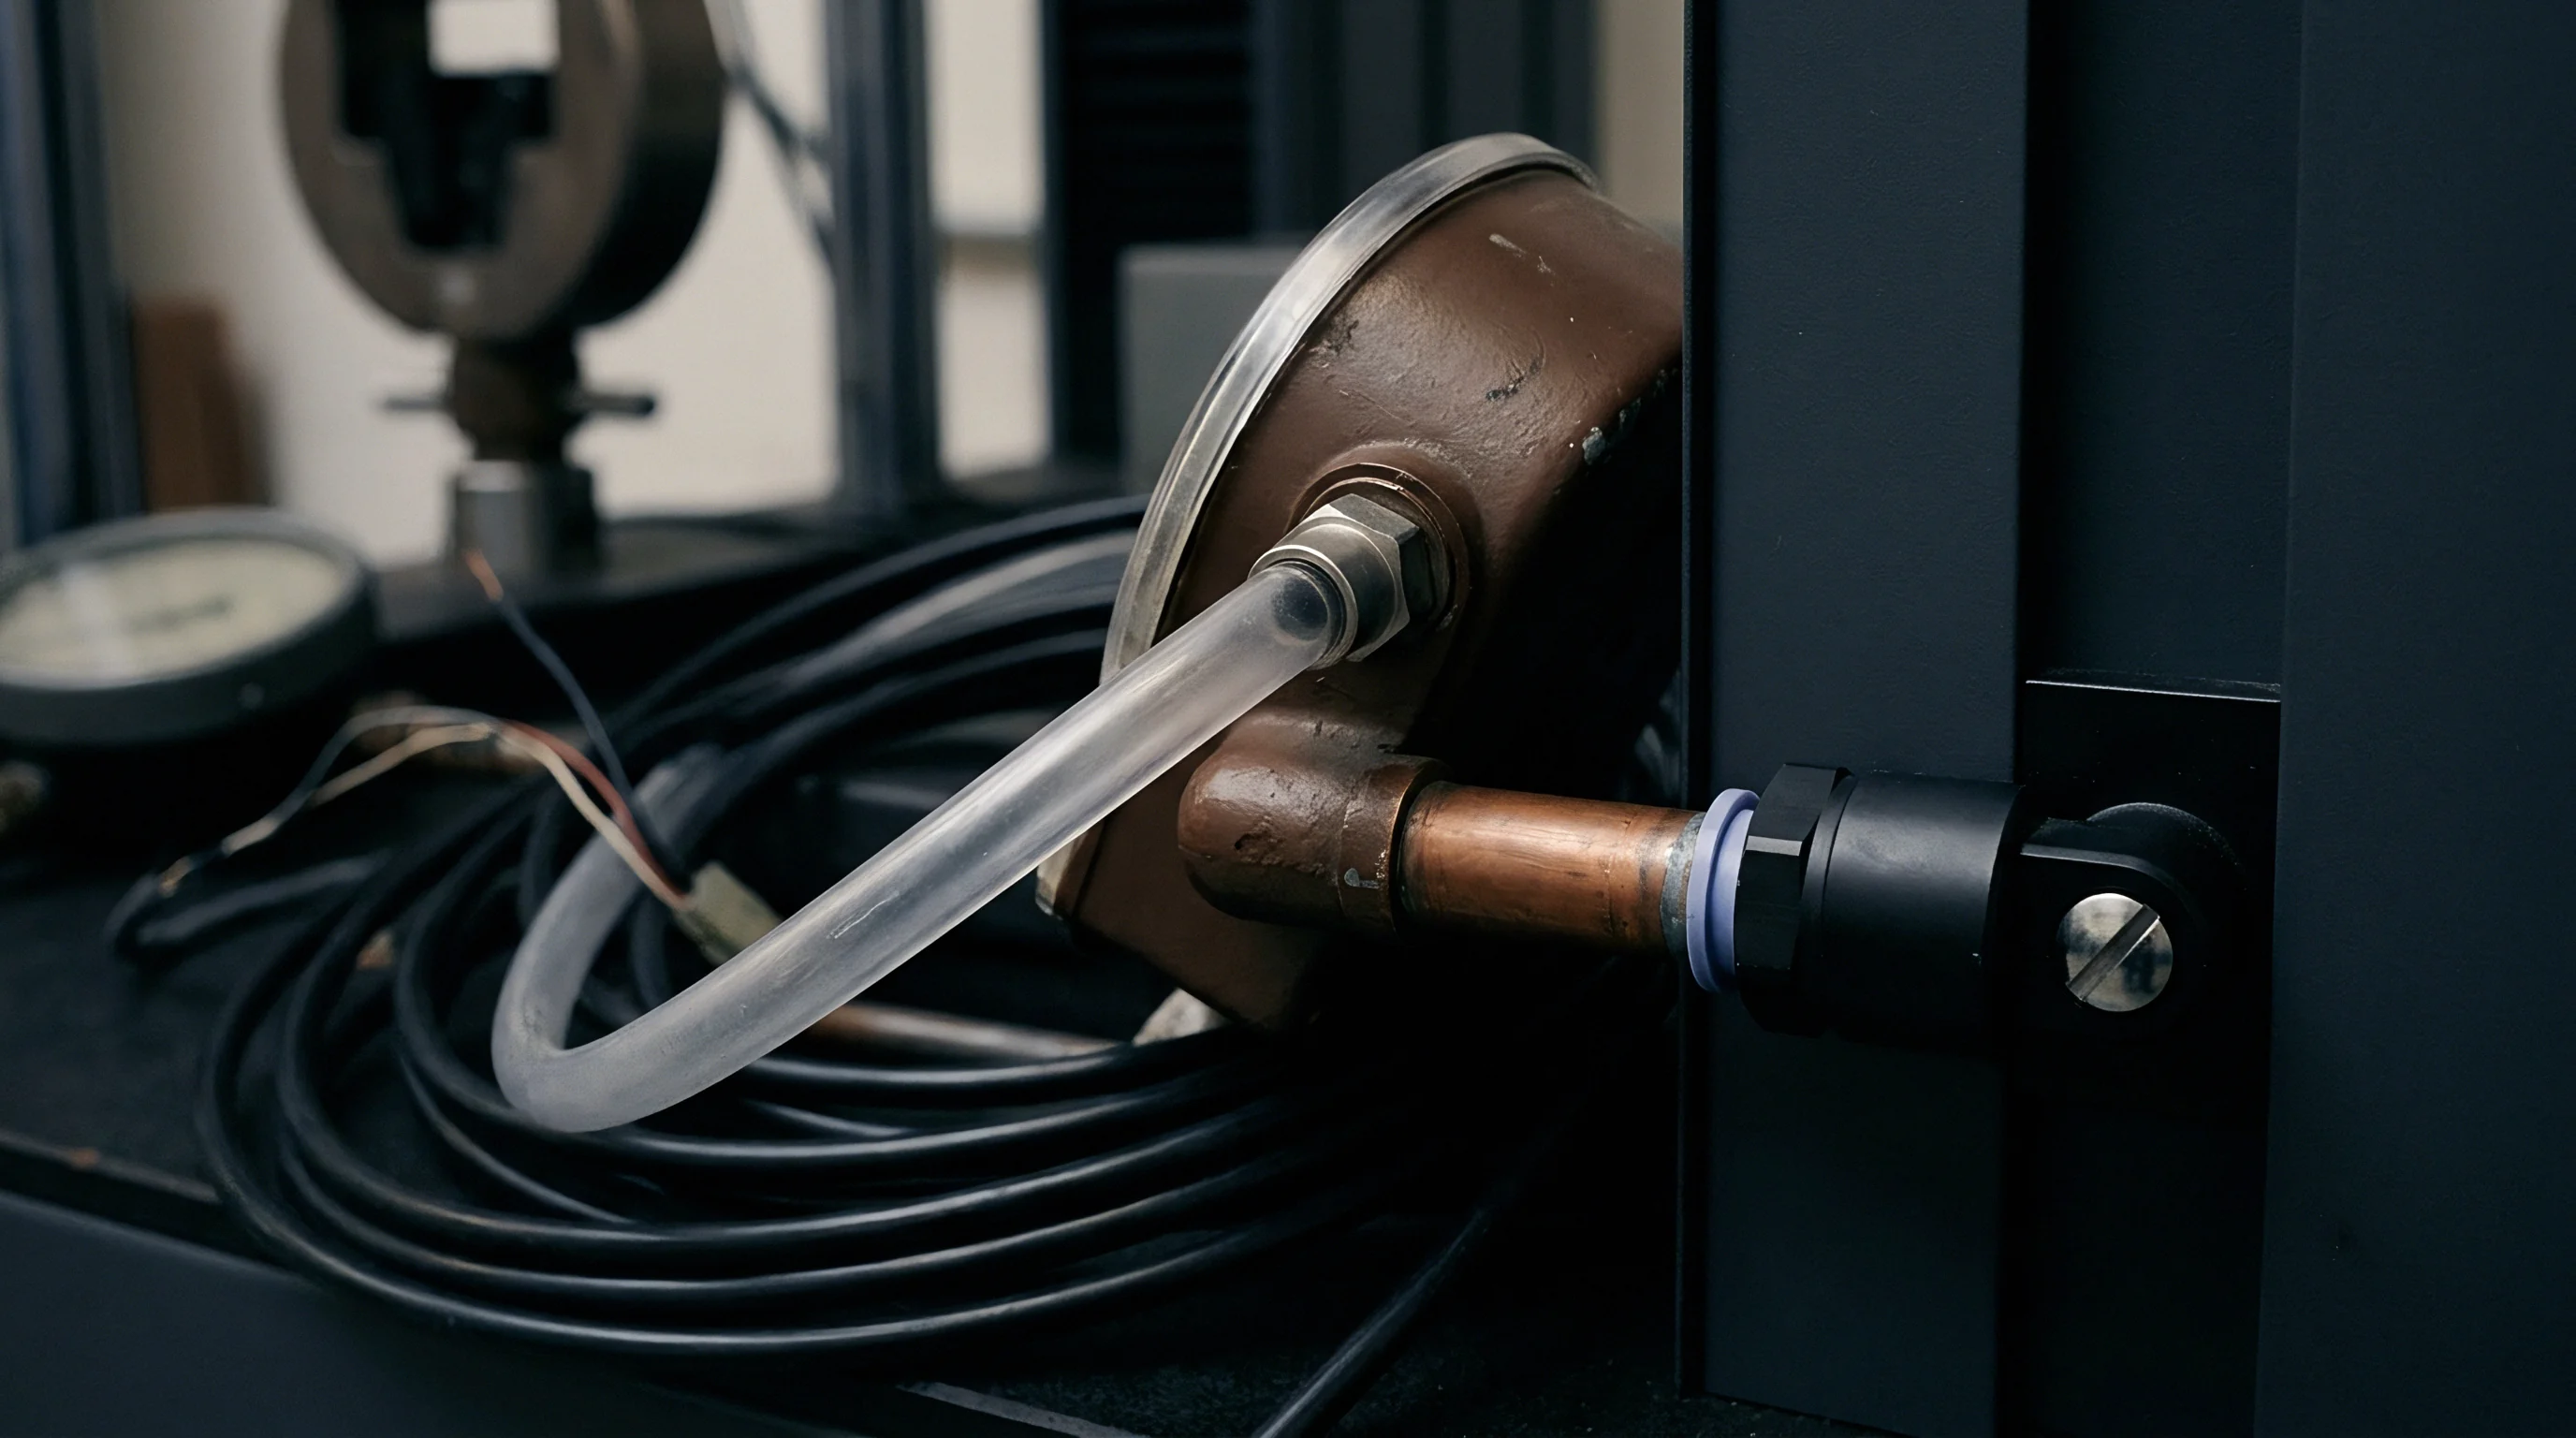
Can In-Cavity Piezoelectric Sensors Isolate Rheological Asymmetry?
Placing pressure transducers just downstream of the gate separates melt viscosity effects from machine-level hydraulic noise. Piezoelectric crystals produce fast linear voltage responses. As resin enters the cavity, the rate of pressure rise directly reflects local melt viscosity: hotter, shear-thinned material in inner cavities creates a steep pressure slope, while cooler melt in outer cavities produces a much flatter rise.
Tracking these slope differences reveals shear imbalances that machine hydraulics or screw position data miss.
- Machine precision sensor pockets into the ejector plate directly behind ejector pins located near gate entrances.
- Install high-rigidity quartz force buttons with pre-load torque calibrated between 1.5 and 2.0 Newton meters.
- Connect low-noise coaxial cabling from sensor housings to multichannel charge amplifiers mounted on the mold frame.
- Calibrate transducer output signals using a calibrated force gage to establish exact bar per millivolt conversion factors.
- Verify signal stability during dry cycles to ensure mechanical ejector plate motion introduces zero electrical noise.

Transducer Calibration and Rheological Signal Calculations
In an eight-cavity mold running 30 percent glass-filled polybutylene terephthalate, piezoelectric transducers sit behind 2.5 millimeter ejector pins located 3.0 millimeters downstream from each gate. At a machine velocity producing an average shear rate of 8,000 inverse seconds in secondary runners, symmetrical flow theory predicts identical pressure traces across all sensors.
Measured operational data shows Cavity 1 in the inner cluster reaching 350 bar cavity pressure in 0.18 seconds post-gate penetration, corresponding to a pressure rise rate of 1,944 bar per second. Cavity 8 in the outer cluster reaches 350 bar in 0.28 seconds, yielding a pressure rise rate of 1,250 bar per second. The apparent viscosity delta calculated via the Hagen-Poiseuille relationship for channel flow yields:
Viscosity Ratio = Pressure Rate Cavity 8 / Pressure Rate Cavity 1 = 1,250 / 1,944 = 0.643
The melt reaching Cavity 1 has an apparent viscosity 35.7 percent lower than that entering Cavity 8, driven entirely by shear heating at the primary runner junction. Correcting this 35.7 percent viscosity difference without altering gate dimensions requires adjusting boundary layer distribution through runner reorientation or localized thermal management.
Applying ISO 294-1 moulding parameters without active in-cavity sensing permits undetected cavity pressure variances above fifteen percent.
Sensor calibration must remain stable across long runs. Failing to adjust for thermal compensation during continuous operation shifts baseline transducer curves, often prompting technicians to make unneeded barrel temperature changes. Misreading cavity pressure traces can also lead to improper clamp force adjustments and premature wear on core pins.

Control
Switching machine phases using internal cavity pressure insulates part dimensions from machine hydraulic variations. Decoupled moulding divides filling from packing to keep processes repeatable. Decoupled II uses velocity control to fill 95 to 98 percent of the mold volume before transferring to hold on screw position or hydraulic pressure.
Decoupled III uses real-time cavity pressure feedback, triggering crossover automatically when melt reaches a target threshold inside the impression.
Shear-thinning differences mess with traditional position-based transfer. When outer cavities receive thicker melt, position crossover leaves them under-filled while inner cavities pack out early. Base transfer on post-gate cavity pressure instead, so crossover happens only when melt arrival and compaction reach target values in chosen master cavities.
| Process Parameter | Decoupled I (Pressure) | Decoupled II (Position) | Decoupled III (Cavity Pressure) |
|---|---|---|---|
| Crossover Trigger Mechanism | Hydraulic Pressure Peak | Screw Forward Position | Post-Gate Sensor Signal |
| Sensitivity to Resin Lot Variance | High | Moderate | Low |
| Peak Cavity Pressure Repeatability | +- 8.5% | +- 4.2% | +- 0.8% |
| Volumetric Part Weight Delta | +- 1.2% | +- 0.6% | +- 0.12% |
| Data recorded across 10,000 continuous cycles using glass-filled PBT on a 150-tonne electric press under ISO 294-1 test conditions. | |||
- Master cavity sensor selection assigns the most rheologically stable inner impression as the global transfer trigger.
- Multi-channel valve gate tuning adjusts individual hydraulic nozzle open delays to compensate for outer cavity filling lags.
- Dynamic hold pressure profile mapping scales packing force based on transducer pressure integral decay rates.
- Automated part rejection thresholds trigger scrap gates whenever cavity pressure integrals deviate from baseline limits.
Hot runner valve gates with individual servo or pneumatic actuators allow precise control over opening times. Linking post-gate pressure feedback to individual valve pin controllers lets outer gates open milliseconds before inner gates. This timing offset compensates for viscosity differences, bringing all melt fronts through the gates at the same time.
Equalizing peak cavity pressures across all impression sites stabilizes volumetric shrinkage across production shifts.
Closed-loop controllers can adjust ram speed dynamically during a single stroke based on pressure curve slopes. If higher viscosity resists flow into outer cavities, the press accelerates through the first 80 percent of stroke, driving up shear rates to drop apparent viscosity and maintain uniform filling. Meeting DIN 16742 tolerance group TG4 requires recording cavity pressure peaks continuously to verify capability during quality audits.

Verification
Validating a multi-cavity process statistically requires proving dimensional control cavity by cavity. Short shot studies expose runner shear imbalances. Pressure curves quantify total mold packing work.
Evaluating capability across a tool means calculating Cpk values for each position independently; pooling measurement data from all cavities into one distribution masks shear-induced variations. An eight-cavity tool can show an overall Cpk above 1.33 while individual cavity analysis reveals perimeter cavities below 1.0 and center cavities above 1.67 because of packing differences.
Progressive short-shot studies give direct visual proof of fill pattern progression. Cutting injection at 20, 40, 60, 80, and 95 percent of stroke without hold pressure highlights raw viscosity differences across runner paths. Weighing each cavity’s short component provides exact fill percentages, pointing directly to runner branches where shear heating alters melt flow.
Calculating the cavity pressure integral quantifies the mechanical work delivered to the polymer in each cavity throughout the cycle. The area under the pressure-time curve correlates directly with part weight, crystallinity, and post-mold shrinkage. Matching peak pressures and pressure integrals across all impressions keeps part dimensions tightly within DIN 16742 TG3 tolerance bands.
Combining short-shot weight data with continuous pressure tracking creates an audit trail for automotive and medical parts. When dimensions drift in production, comparing part measurements against saved pressure curves shows whether resin lot variation or tool thermal changes caused the problem. Whether self-learning machine controllers can adjust individual valve pins automatically to compensate for resin lot shifts remains an open area of trial in the field.