Biaxial Strain Hardening Metrics for High Draw Ratio Amorphous Sheet Thermoforming
Biaxial strain hardening metrics dictate wall thickness uniformity in high draw thermoforming; matching plug dynamics to material hardening prevents blowout.


Mechanics
Thermoforming amorphous sheet at draw ratios over three to one stretches polymer melt networks near their limit. When materials like poly(ethylene terephthalate glycol-modified) or polycarbonate soften past their glass transition temperature, how they respond to stress determines wall thickness across deep cavities. Biaxial tension drives this deformation rather than simple uniaxial pull.
As pneumatic pressure or a plug forces sheet into the mold, the material stretches in two orthogonal directions along the sheet plane. Preventing localized necking and runaway thinning comes down to the slope of the biaxial stress-strain curve at high extensions.
In an amorphous matrix, polymer chains form a dynamic network joined by topological entanglements that act like temporary crosslinks during fast deformation above the glass transition. At low draw ratios, the network yields with moderate resistance, showing a stress plateau or soft yield. Once the stretch ratio rises, polymer segments between entanglements approach their maximum contour length.
This limit in chain extensibility forces true stress upward relative to true strain ~ the strain hardening effect. The strength of this stress upturn determines whether an inflating bubble stays stable or develops local thin spots that blow out.
Biaxial Deformational Modes in Sheet Stretch
Vacuum and pressure forming act mainly through two strain fields: planar extension and equibiaxial extension. In equibiaxial extension, principal stretch ratios across the sheet plane are equal while thickness drops to conserve volume. This dominates at the center of an inflating bubble and across the flat bottom of cylindrical cavities.
In planar extension, one in-plane dimension remains fixed while the orthogonal dimension expands, pulling all required material from sheet thickness ~ as happens along the straight sidewalls of rectangular containers. Because of the multi-dimensional stress state on the network, maintaining equibiaxial deformation takes higher true stress than uniaxial elongation at the same stretch ratio.
Hyperelastic models modified for viscoelastic relaxation, such as the Mooney-Rivlin and Edwards-Vilgis formulations, describe how amorphous polymers behave in the rubbery regime. The strain hardening modulus ~ taken from the slope of true stress against the difference of squared stretch ratios ~ measures how strongly entanglements resist over-stretching. A high strain hardening modulus forces deformation across a wider area of the sheet.
As one zone stretches and hardens, adjacent warmer or thicker regions yield, self-stabilizing wall thickness across complex mold shapes.
| Polymer Matrix | Test Temp (C) | Glass Transition (C) | Strain Hardening Modulus (MPa) | Considere Biaxial Threshold | Max Stable Draw Ratio |
|---|---|---|---|---|---|
| PETG (Glycol Modified) | 145 | 80 | 1.42 | 2.10 | 4.2:1 |
| Polycarbonate (PC) | 175 | 150 | 2.85 | 1.85 | 4.8:1 |
| High Impact Polystyrene | 140 | 100 | 0.38 | 3.45 | 2.1:1 |
| ABS (Terpolymer) | 155 | 105 | 0.72 | 2.80 | 2.8:1 |
| PMMA (Acrylic) | 160 | 105 | 1.95 | 1.90 | 3.9:1 |

Molecular Entanglement Networks and Hardening Modulus
Entanglement molecular weight governs when strain hardening begins and how steeply it climbs. Polymers with low entanglement molecular weight contain more network junctions per unit volume. Polycarbonate, for instance, has a low entanglement molecular weight near 1300 grams per mole, which triggers strong strain hardening right after the network aligns.
High impact polystyrene sits near 18,000 grams per mole, giving it a soft network and weak strain hardening. This structural contrast is why polycarbonate handles deep draws without a plug assist, while high impact polystyrene needs heavy mechanical pre-stretching so walls do not fail locally.
Temperature changes alter network behavior quickly. Heating the sheet speeds up molecular relaxation, letting entanglements slip during stretch. That slippage lowers the effective strain hardening modulus and compromises the melt’s self-stabilizing behavior.
Cooling the sheet raises initial yield stress, requiring higher inflation pressures and raising the risk that surface micro-defects will trigger early tearing. Keeping sheet core temperatures within a two-degree Celsius window protects the target strain hardening modulus throughout the cycle.
Equal biaxial extension of high-molecular-weight polycarbonate at 175 degrees Celsius yields a strain hardening modulus of 2.85 megapascals at true strain levels above 1.2.
Considere Criterion under Equal Biaxial Tension
To suppress necking in simple uniaxial tension, the slope of true stress against true strain must exceed the true stress itself. Under equal biaxial tension, geometry changes the boundary. Thinning across two axes accelerates surface expansion much faster than single-axis pulling.
The equibiaxial Considere criterion requires the rate of true stress increase relative to stretch ratio to stay above twice the true stress divided by that stretch ratio. Because of this stricter limit, a material that stretches smoothly in a tensile tester can still neck and fail during bubble inflation.
Missing the biaxial Considere threshold causes runaway local strain. If a spot on the sheet runs slightly warmer or thinner, its local stretch ratio spikes. Unless strain hardening builds stress fast enough to balance geometric thinning, material at that spot thins until it tears.
High draw ratio forming works only when process temperatures keep the biaxial strain hardening slope above this stability limit through the entire stroke.
Pinpointing where entanglement slip overrides strain hardening at high strain rates remains difficult when rapid tool contact creates non-isothermal boundary conditions.
Bench
Standard uniaxial tensile testers cannot measure biaxial strain hardening properly. Uniaxial data misses the multi-axial stress fields active in thermoforming and overestimates formability by ignoring how molecular chains couple under orthogonal stretch. Lab evaluations rely on two main setups: constant-area bubble inflation rheometry and planar equibiaxial sheet extension fixtures.
Both capture true stress and true strain across strain rates and temperatures tuned to factory conditions.
In bubble inflation testing, pneumatic pressure inflates a clamped circular specimen inside a heated chamber. Optical sensors track the height and apex radius of curvature as pressure transducers log cavity pressure, allowing direct calculation of true stress and strain at the apex. Planar biaxial fixtures grip a square sample using independent pantograph arms or linear motors along four edges.
This setup controls X and Y stretch ratios independently, making it possible to simulate asymmetric stretching in complex rectangular molds.
Biaxial Rheometry and Bubble Inflation Mechanics
Inflating at a constant volumetric rate causes strain rates at the bubble apex to drift as deformation proceeds. Advanced inflation systems fix this with closed-loop optical feedback, adjusting pressure dynamically to hold a constant Hencky strain rate at the apex. Real thermoforming operates between one and twenty per second.
Slow, quasi-static bench tests miss the viscoelastic stress upturn because chains have time to relax and disentangle. High-speed testing is required to match the deformation rates created by plugs and high-pressure air.
Measuring wall thickness during bubble inflation takes high-speed optical profiling. Digital image correlation tracks speckle patterns printed on the sheet before heating, with stereo cameras recording 3D displacement at over one thousand frames per second. This maps strain gradients across the bubble surface, marking the exact stretch ratio where strain hardening begins and tracking local thinning down to sub-micron resolution.
Characterizing sheet formability requires a consistent testing protocol to compare incoming polymer lots reliably.
- Equibiaxial Bubble Inflation Chamber featuring closed-loop optical apex tracking, pneumatic pressure ramp control up to two megapascals, and multi-zone infrared radiant heating that holds isothermal conditions within zero point five degrees Celsius across the specimen surface.
- High Speed Digital Image Correlation system using dual stereo cameras operating at a minimum of twelve hundred frames per second with sub-pixel displacement resolution to map 3D true strain tensors during rapid inflation.
- Planar Biaxial Tensile Load Frame configured with eight independently driven servo-electric actuators, force transducers mounted directly on load grips, and an active environmental chamber for asymmetric stretch ratio testing.
- Capillary Viscometer and Melt Rheometer dedicated to measuring high shear rate viscosity and molecular weight distribution metrics to cross-reference entanglement calculations against biaxial hardening performance.

Optical Strain Mapping for High Strain Rates
Digital image correlation converts raw video into localized strain tensors. Computing deformation gradients at every surface node gives principal stretch ratios, effective Hencky strain, and local strain rate history. This resolution spots localized necking well before visible failure.
On sheet with a broad or poor molecular weight distribution, DIC maps show strain concentrating at low dome heights, signaling weak strain hardening.
Planar extension tests measure cross-directional stress coupling directly, though gripping square samples introduces edge effects. Stress concentrates at corners, distorting the local strain field near clamps. Standard procedures use flexible load-distribution fingers or scissor grips to allow lateral expansion along clamped edges.
Without them, edge artifacts distort true stress calculations, producing false strain hardening slopes that throw off plug design.
A single uncalibrated heater bank on an optical bench introduced an eight degree gradient across a polycarbonate specimen, altering measured strain hardening modulus values by thirty-two percent.
Bench testing high-draw PETG sheet without active thermal shielding against ambient convective drafts introduces a fourteen percent thinning spike. The resulting data error leads to incorrect plug speed settings during initial production trials, costing three days of machine press time before recalibration on the bench corrects the process window.
Platen
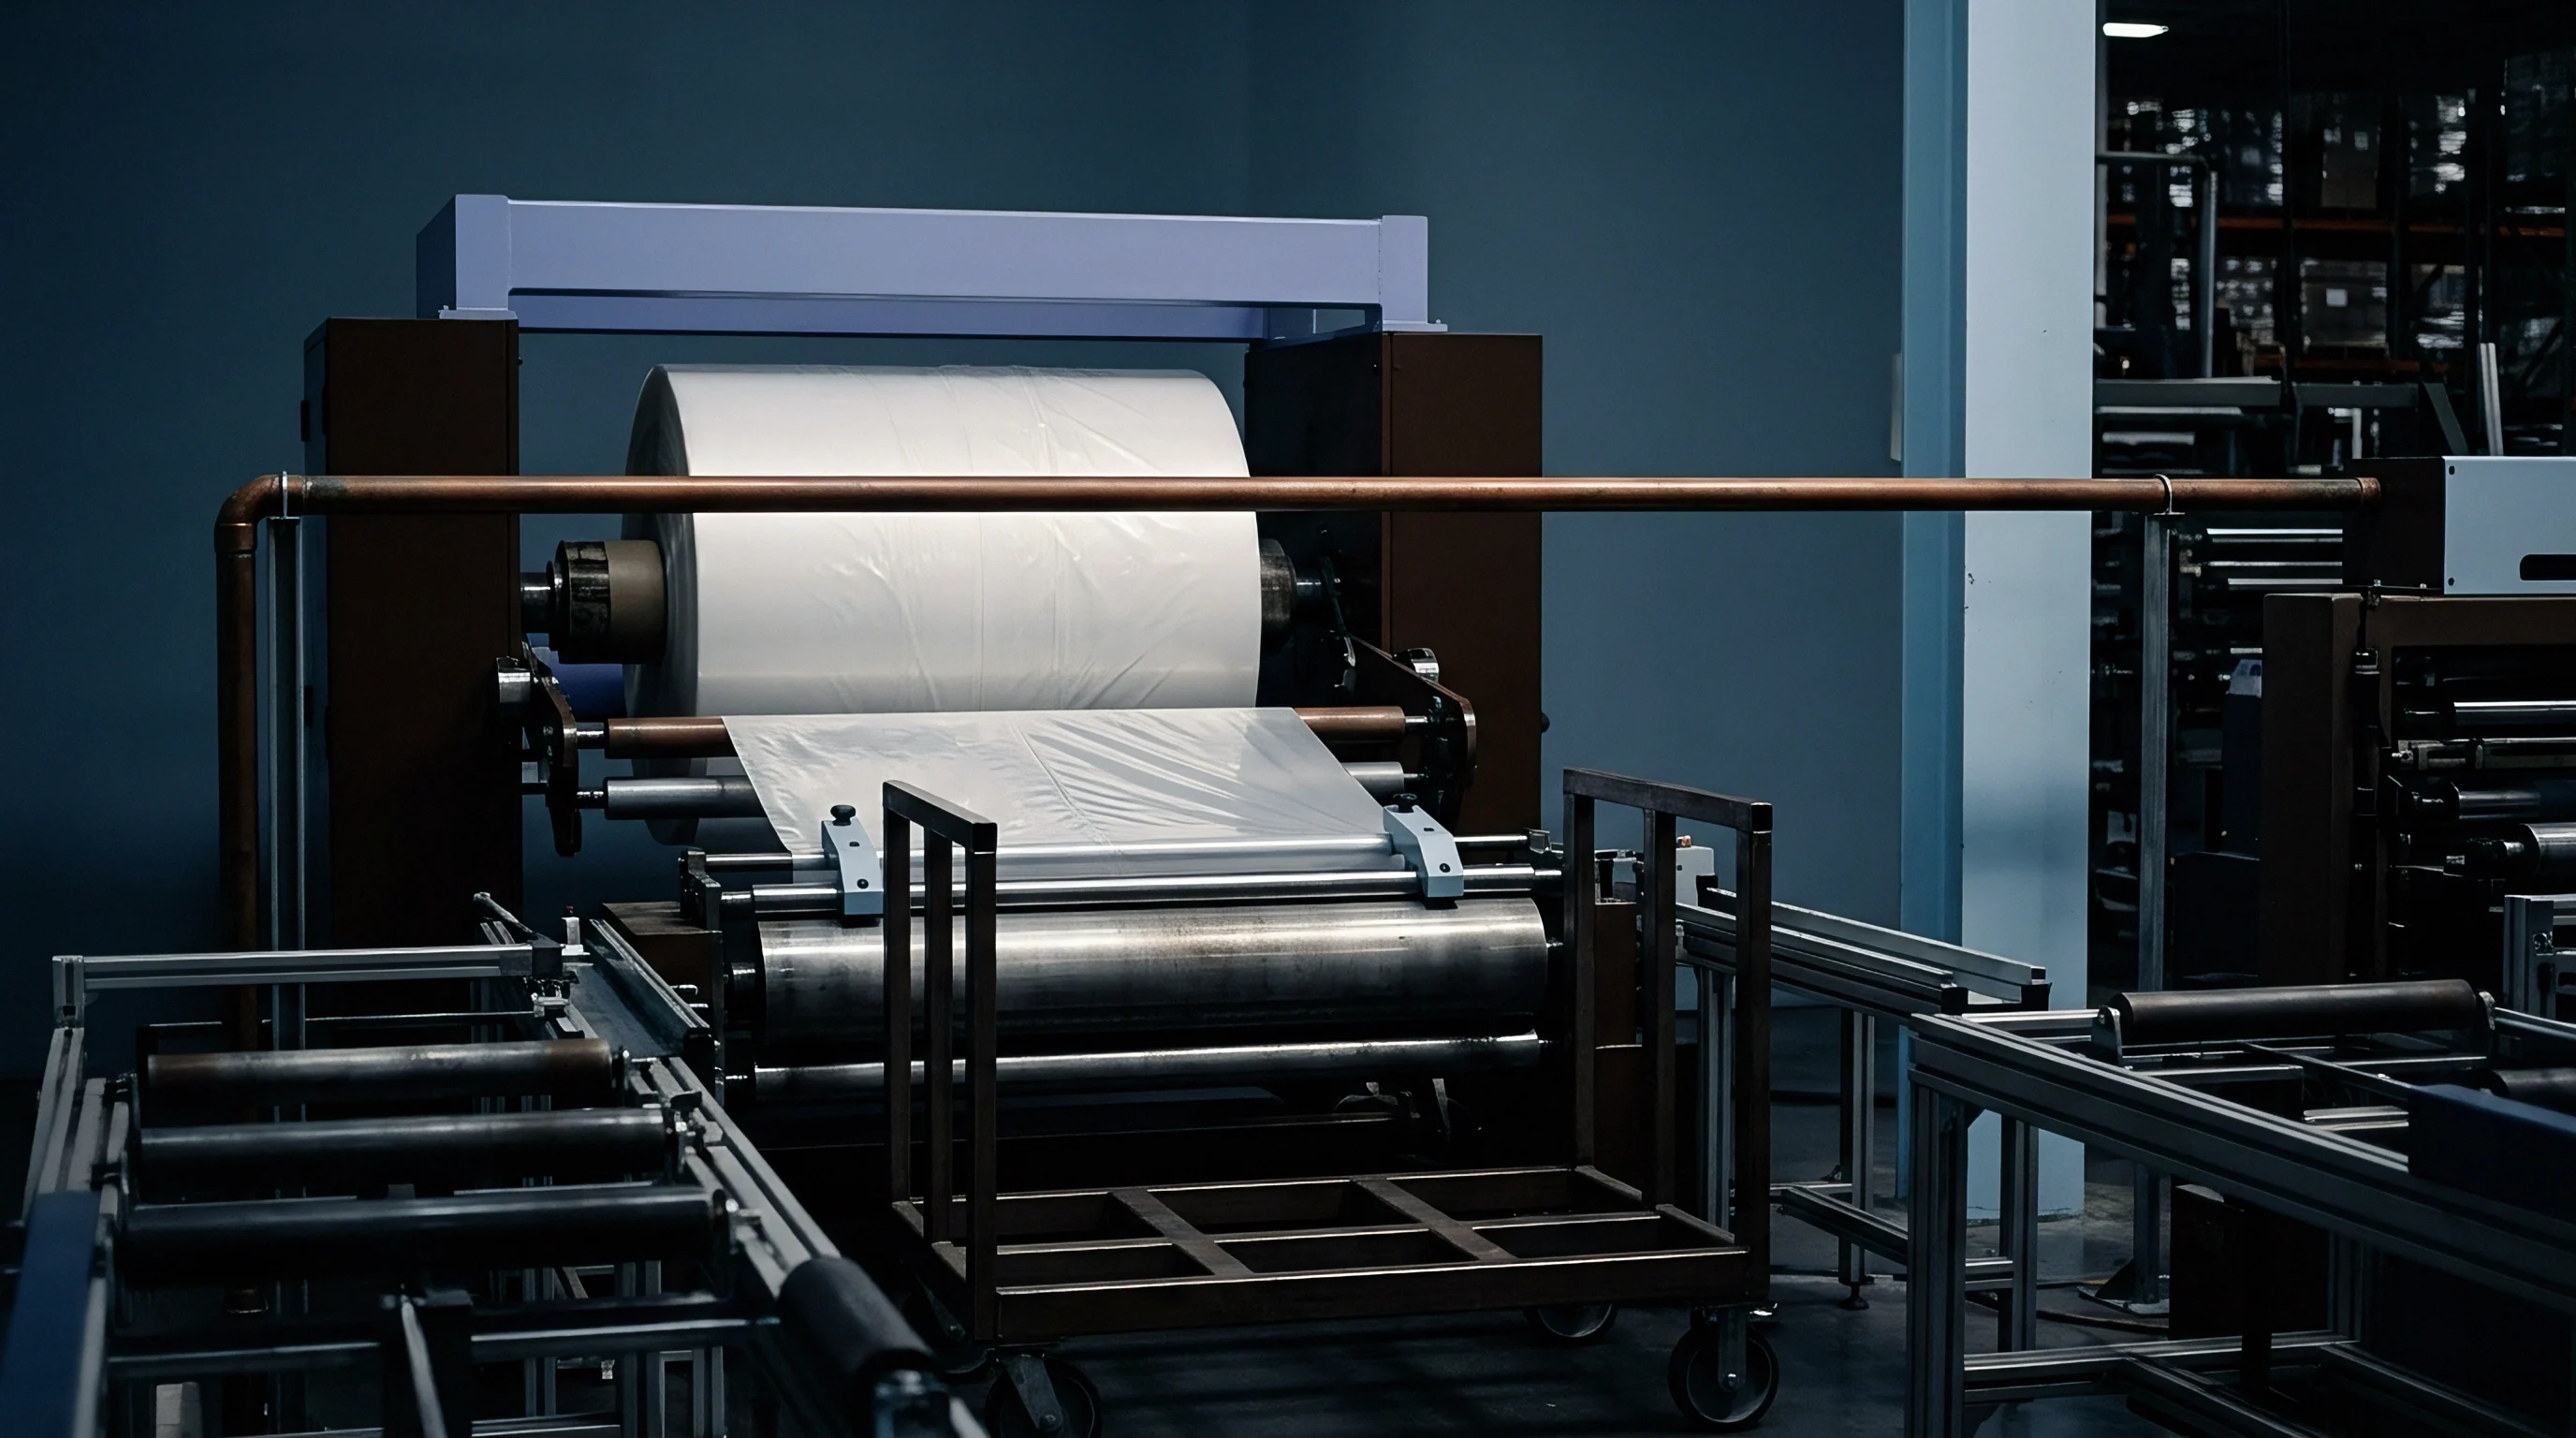
Translating laboratory strain hardening data to the factory floor happens at the machine platen. Forming high draw ratio amorphous sheet takes coordinated control over plug assistance, differential heating, and pre-blow air timing. The mechanical plug distributes strain physically: pushing softened sheet into the cavity before final vacuum or pressure moves material from the center out toward corners and sidewalls.
Contact between the plug material and sheet dictates how strain hardening develops during early deformation.
Friction at the plug interface constrains local stretching. High friction locks the sheet to the plug tip on contact, stopping material beneath the plug from stretching further and forcing subsequent deformation into the sidewalls ~ which causes severe thinning right below the contact line. Low friction lets the sheet slide over the plug during its stroke, spreading biaxial stretch across the center.
At the same time, heat transfer into the plug changes local sheet temperature, shifting the strain hardening modulus during forming.
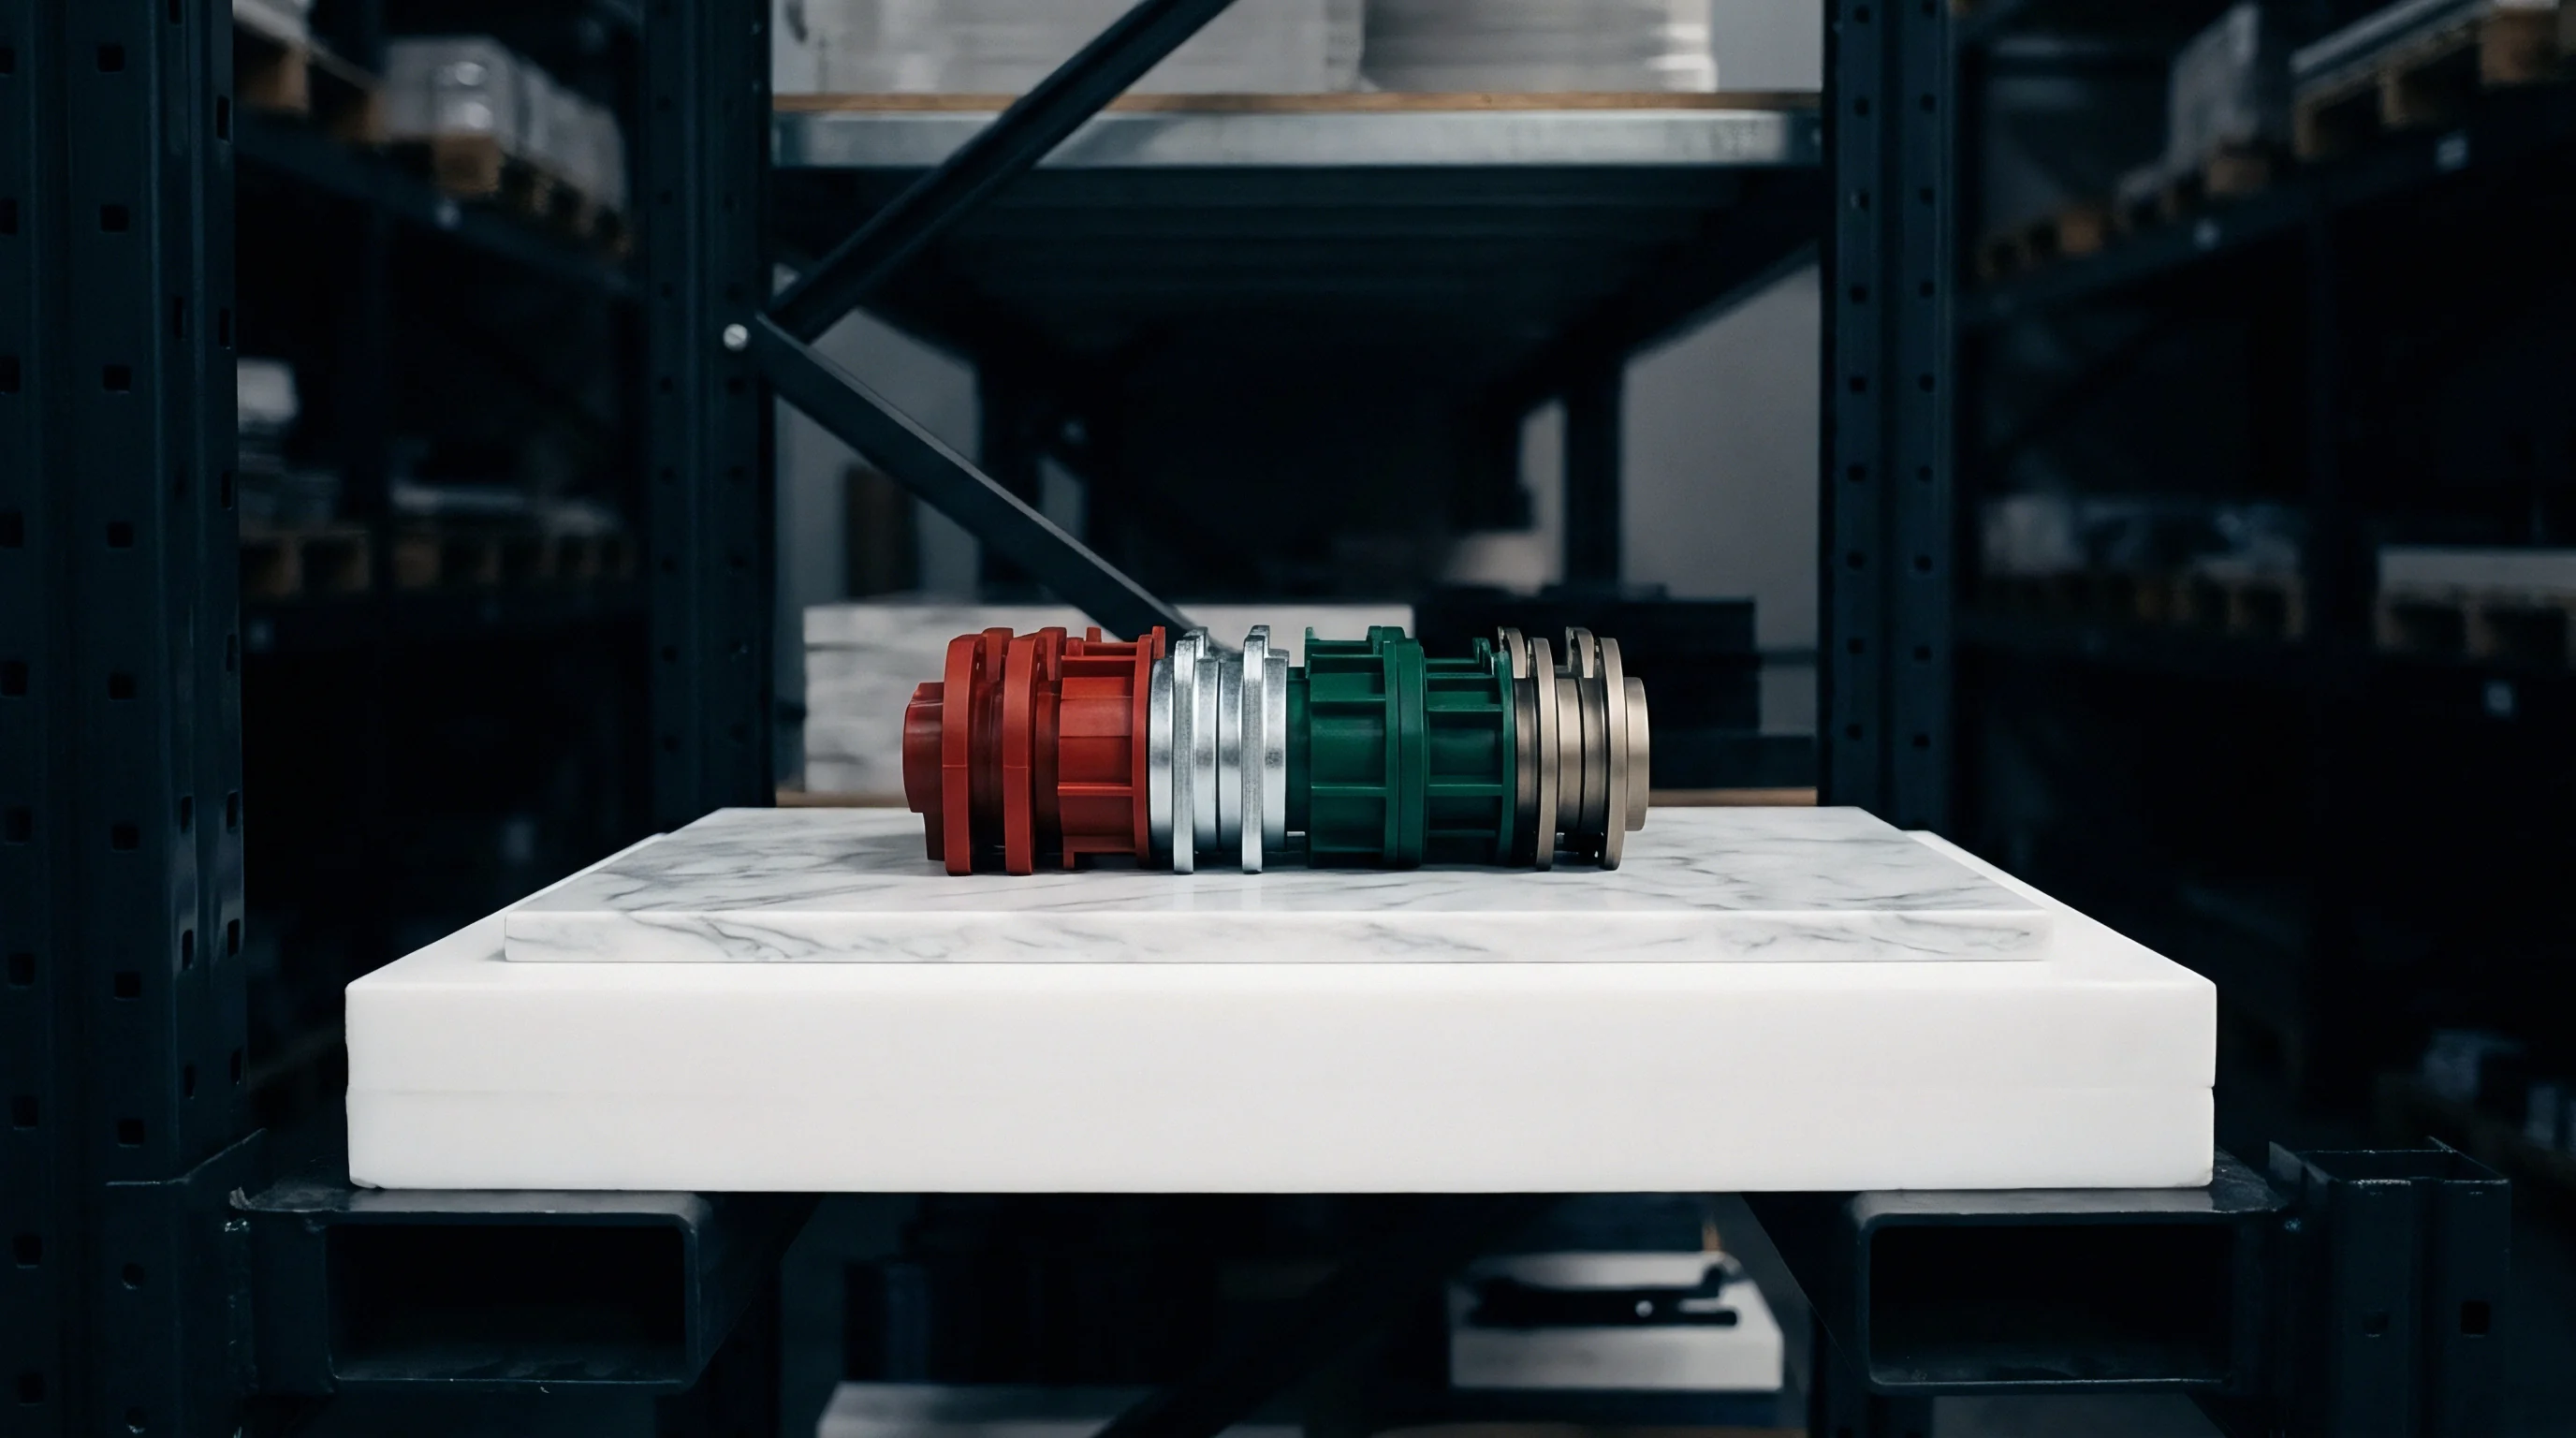
How Does Plug Material Dynamics Shift Local Strain?
Syntactic foam plugs offer low thermal conductivity and predictable friction compared to aluminum or solid plastic. Made of hollow glass microspheres in an epoxy or silicone resin matrix, syntactic foam has low thermal mass that limits heat loss from the sheet during the stroke, keeping material within its strain hardening temperature window. Aluminum plugs, even with internal heaters, tend to chill the sheet on contact.
Those cool spots raise local yield stress, forcing warmer adjacent areas to stretch early and thin out.
Surface texture on syntactic plugs provides mechanical control over sheet slip. Polished surfaces encourage sliding, resulting in thin cavity bottoms and heavy sidewalls. Micro-textured or bead-blasted surfaces add controlled friction, balancing mass distribution between the base and walls of deep-drawn parts.
Plug material and surface finish together set the effective draw ratio across different zones of the sheet, directly changing the strain hardening slope required to hold tolerances.
| Plug Material | Surface Finish (Ra µm) | Plug Temp (C) | Friction Coeff (µ) | Pre-Blow Pressure (kPa) | Min Wall Thickness (mm) |
|---|---|---|---|---|---|
| Syntactic Epoxy | 0.8 | 120 | 0.18 | 35 | 0.42 |
| Syntactic Epoxy | 3.2 | 120 | 0.35 | 35 | 0.28 |
| Porous Aluminum | 1.6 | 165 | 0.45 | 50 | 0.22 |
| PTFE Coated Steel | 0.4 | 110 | 0.12 | 20 | 0.38 |
| Syntactic Silicone | 1.2 | 130 | 0.22 | 40 | 0.45 |

Inflation Pressure Timing and Pre Blow Dynamics
Pre-blow air applies biaxial pre-stretch before the plug touches the sheet. Injecting low-pressure air through the lower platen expands the heated sheet upward into a dome. This free-bubbling stage subjects material to equibiaxial tension without mechanical contact, aligning polymer chains and initiating strain hardening.
Pushing a plug into this pre-blown bubble yields far more uniform walls than plunging straight into flat sheet.
Plug movement and pressure timing must align within milliseconds. Hitting the sheet with the plug before pre-blow finishes creates asymmetric stretch. Waiting too long to apply pressure after full plug stroke lets thin sidewalls cool, leaving internal stress and post-molding warp.
Digital servo platens and fast pneumatic valves provide the cycle-to-cycle repeatability needed across multi-cavity tools.
Optimizing a high-draw thermoforming cycle relies on a systematic setup sequence on the press.
- Load the amorphous sheet into the clamp frame and check clamping pressure across all edge seals so the sheet cannot slip during high-pressure forming.
- Reach target sheet core temperature using multi-zone top and bottom infrared heaters, checking thermal profiles with pyrometer arrays across cavity projections.
- Start low-pressure pre-blow bubble inflation, adjusting pressure ramp rate and duration to hit dome height without causing local micro-necking.
- Advance the servo-driven plug at full programmed speed to meet the apex of the inflated bubble, driving material evenly down into the cavity.
- Apply main forming pressure up to six hundred kilopascals right as the plug reaches full stroke, seating the sheet against temperature-controlled aluminum mold walls.
- Hold dwell cooling pressure until the part surface drops below glass transition temperature to prevent warp and distortion after ejection.
- Retract the plug, vent cavity pressure, and actuate stripper plates to release parts without scuffing surfaces or bending flanges.
Temperature Distribution across Deep Draw Profiles
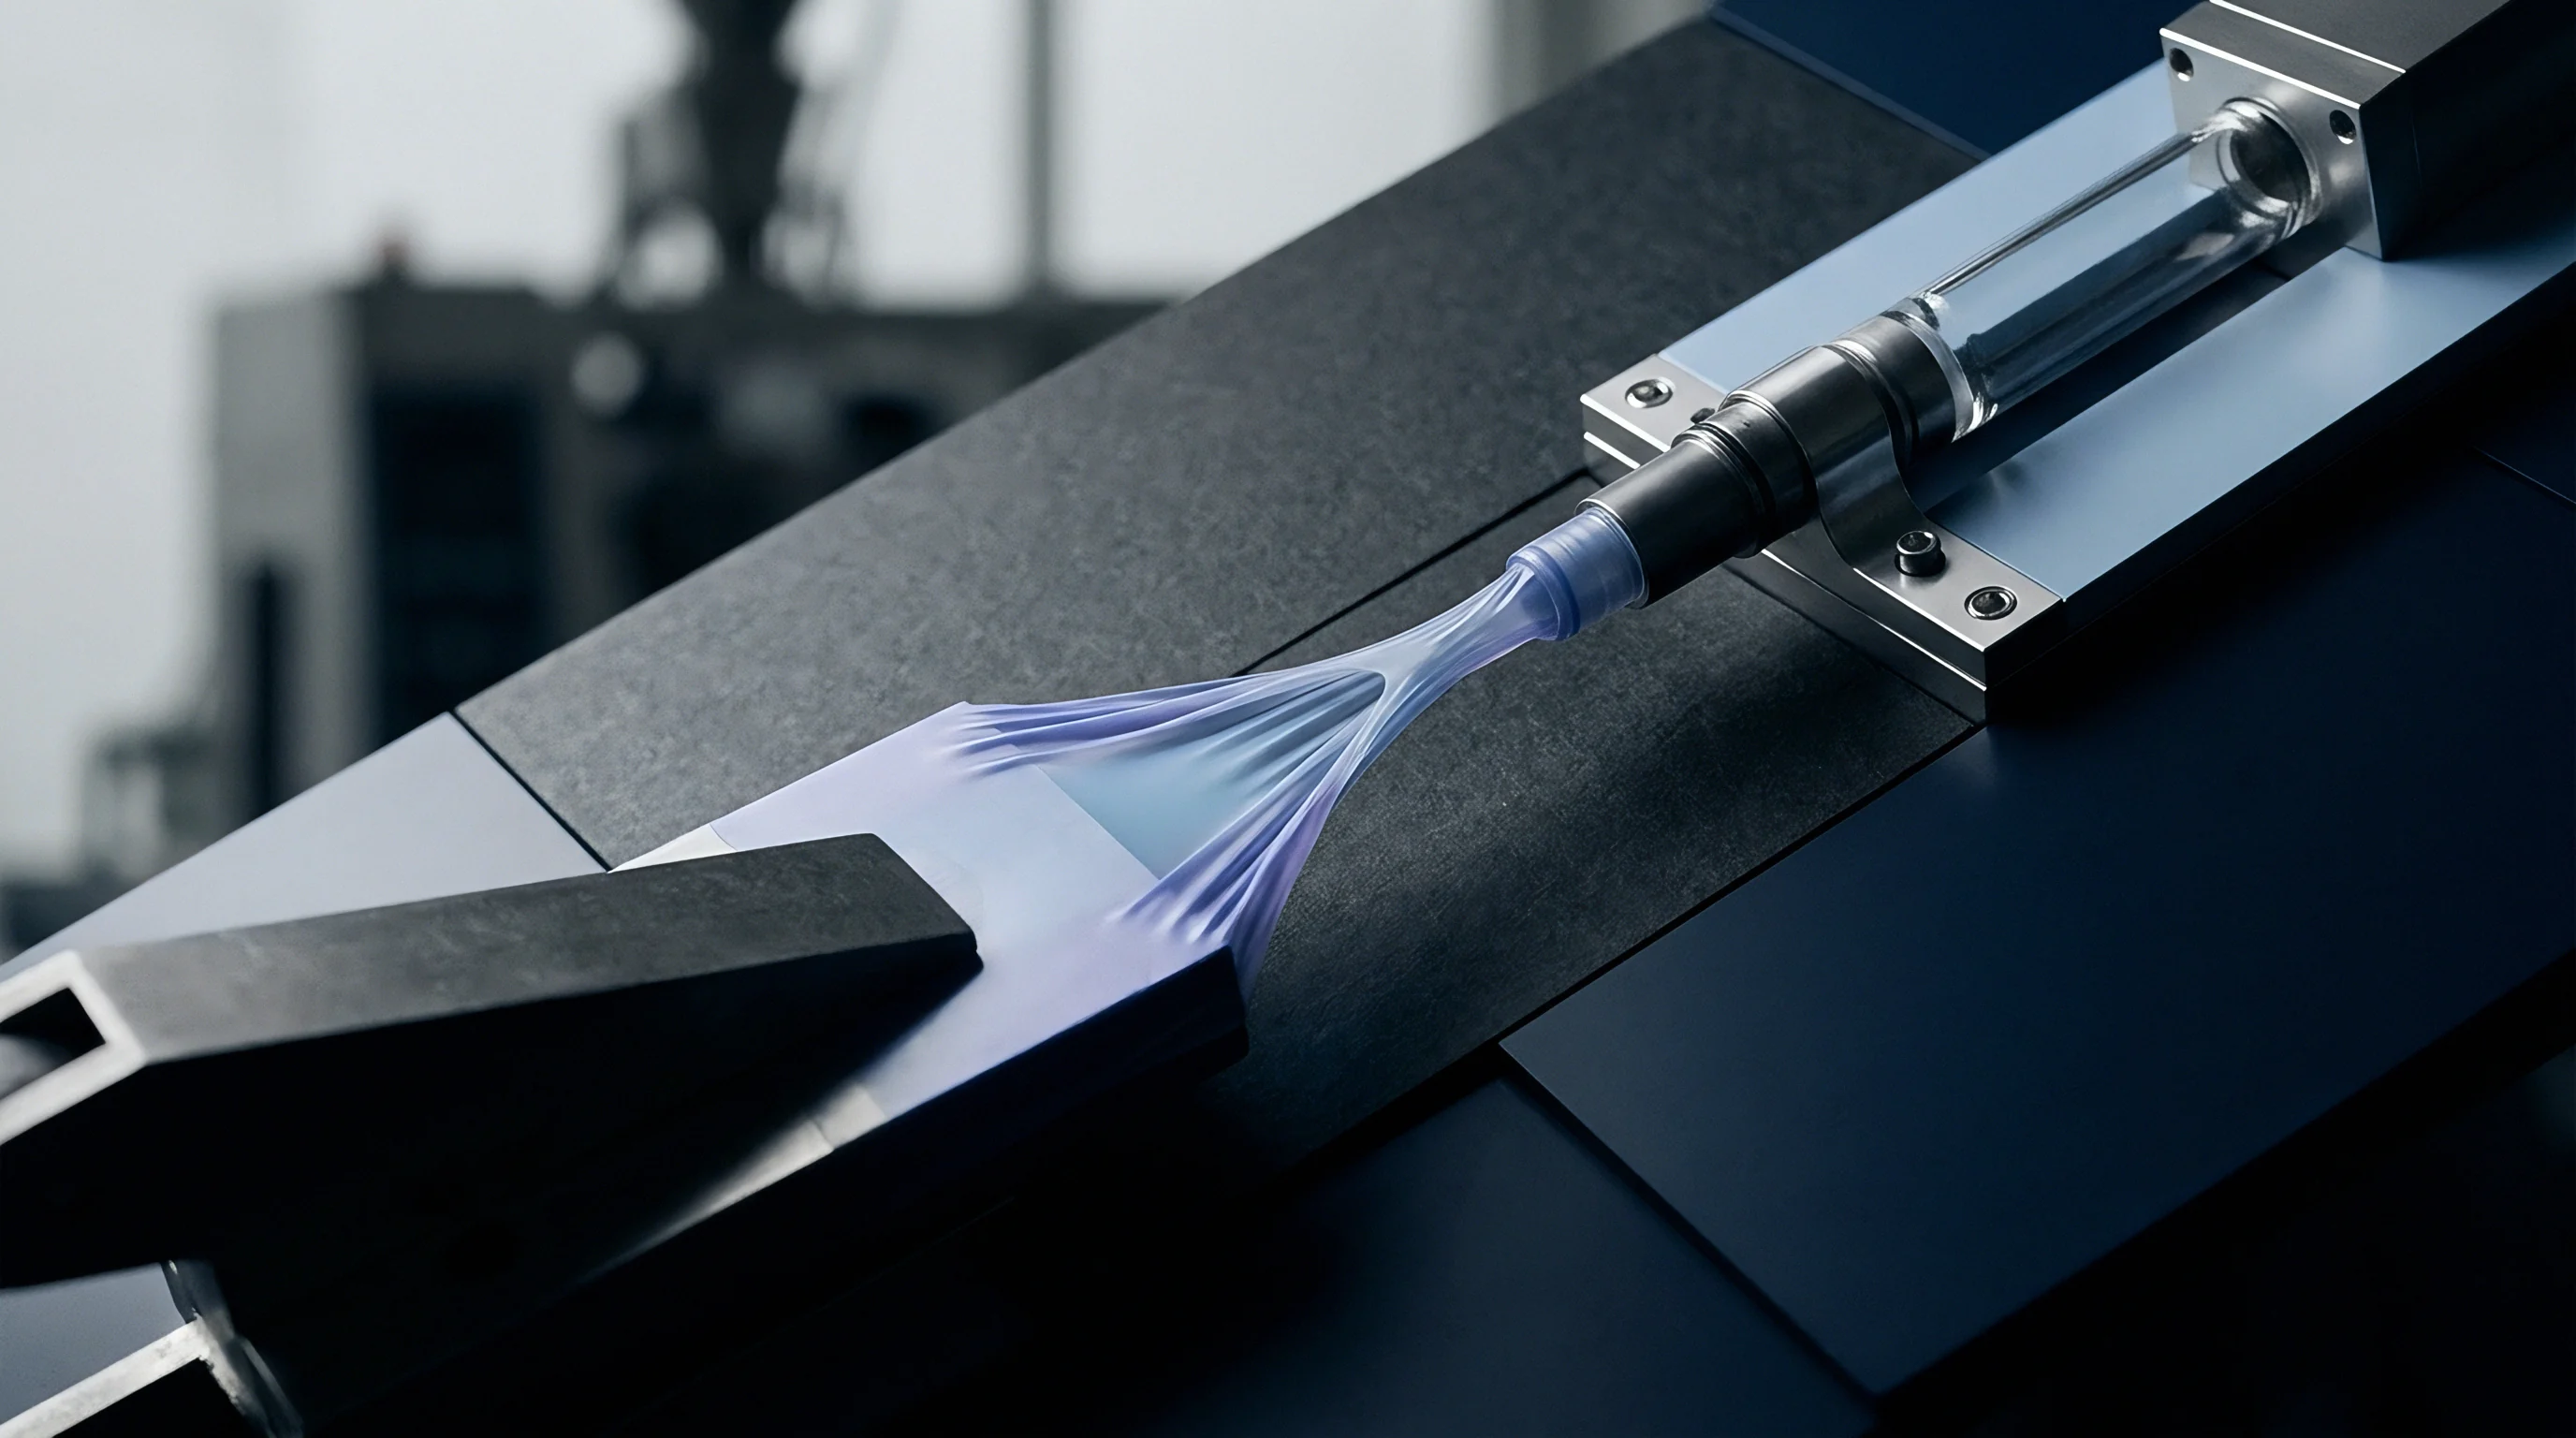
Surface temperature readings hide core thermal gradients. Because amorphous thermoplastics conduct heat poorly, fast radiant heating warms the surface while the core stays cold. When this temperature-stratified sheet forms, hot outer layers yield easily while the cold core resists, altering strain hardening through the sheet cross-section.
Getting uniform strain hardening takes enough heater soak time to balance temperatures through the full thickness.
Differential heater zoning fixes edge heat loss. Clamp frames act as heat sinks, cooling sheet around the perimeter. Turning up power on edge heater zones balances edge temperatures with the center.
Without zone control, cooler perimeter areas exhibit higher yield stress and a weaker strain hardening slope, leading to torn edges and thin corners in outer cavities.
Standard PETG grades subjected to high draw ratios can exhibit up to thirty percent thickness variation regardless of plug material when processed under aggressive plug designs.

Defect
Defects in high draw thermoforming stem from a mismatch between process strain demands and material strain hardening capacity. When local strain rates outpace the polymer network’s ability to harden, local thinning takes over. On deep draws with depth-to-width ratios above two to one, this shows up as necking bands, corner tears, optical lines, and webbing.
Finding the root cause requires mapping thinning patterns against strain fields and tool contact timing.
Corner thinning is the most common failure in deep rectangular containers. Drawing material into a three-way corner creates complex deformation, stretching and compressing the sheet at once. Without a strong biaxial strain hardening modulus, stress collects at the tightest radius.
The wall thins rapidly until forming pressure punctures the material, causing a blowout that stops the line.

Localized Necking and Corner Wall Thinning
Localized necking begins when a spot on the sheet strains past yield without prompt strain hardening. If amorphous sheet runs too far above glass transition, high thermal energy causes fast molecular disentanglement, making the material act more like a viscous liquid than an elastic network. Stress can no longer scale with strain, concentrating deformation into narrow bands.
These bands show up as optical stripes in clear parts and compromise top-load strength.
Fixing localized necking takes lower sheet temperatures or faster deformation speeds to push response back into the viscoelastic regime. Lowering temperature raises the strain hardening modulus, stabilizing stretch. Increasing plug speed raises the strain rate, outpacing molecular relaxation and forcing entanglements to bear load.
When machine limits prevent temperature or speed adjustments, resin selection must move to a higher molecular weight grade with greater entanglement density.
Corner wall thickness below zero point two zero millimeters in a two-liter polycarbonate container triggers immediate structural collapse under vertical compression loads exceeding four hundred newtons.
Webbing Mechanisms at High Area Ratios
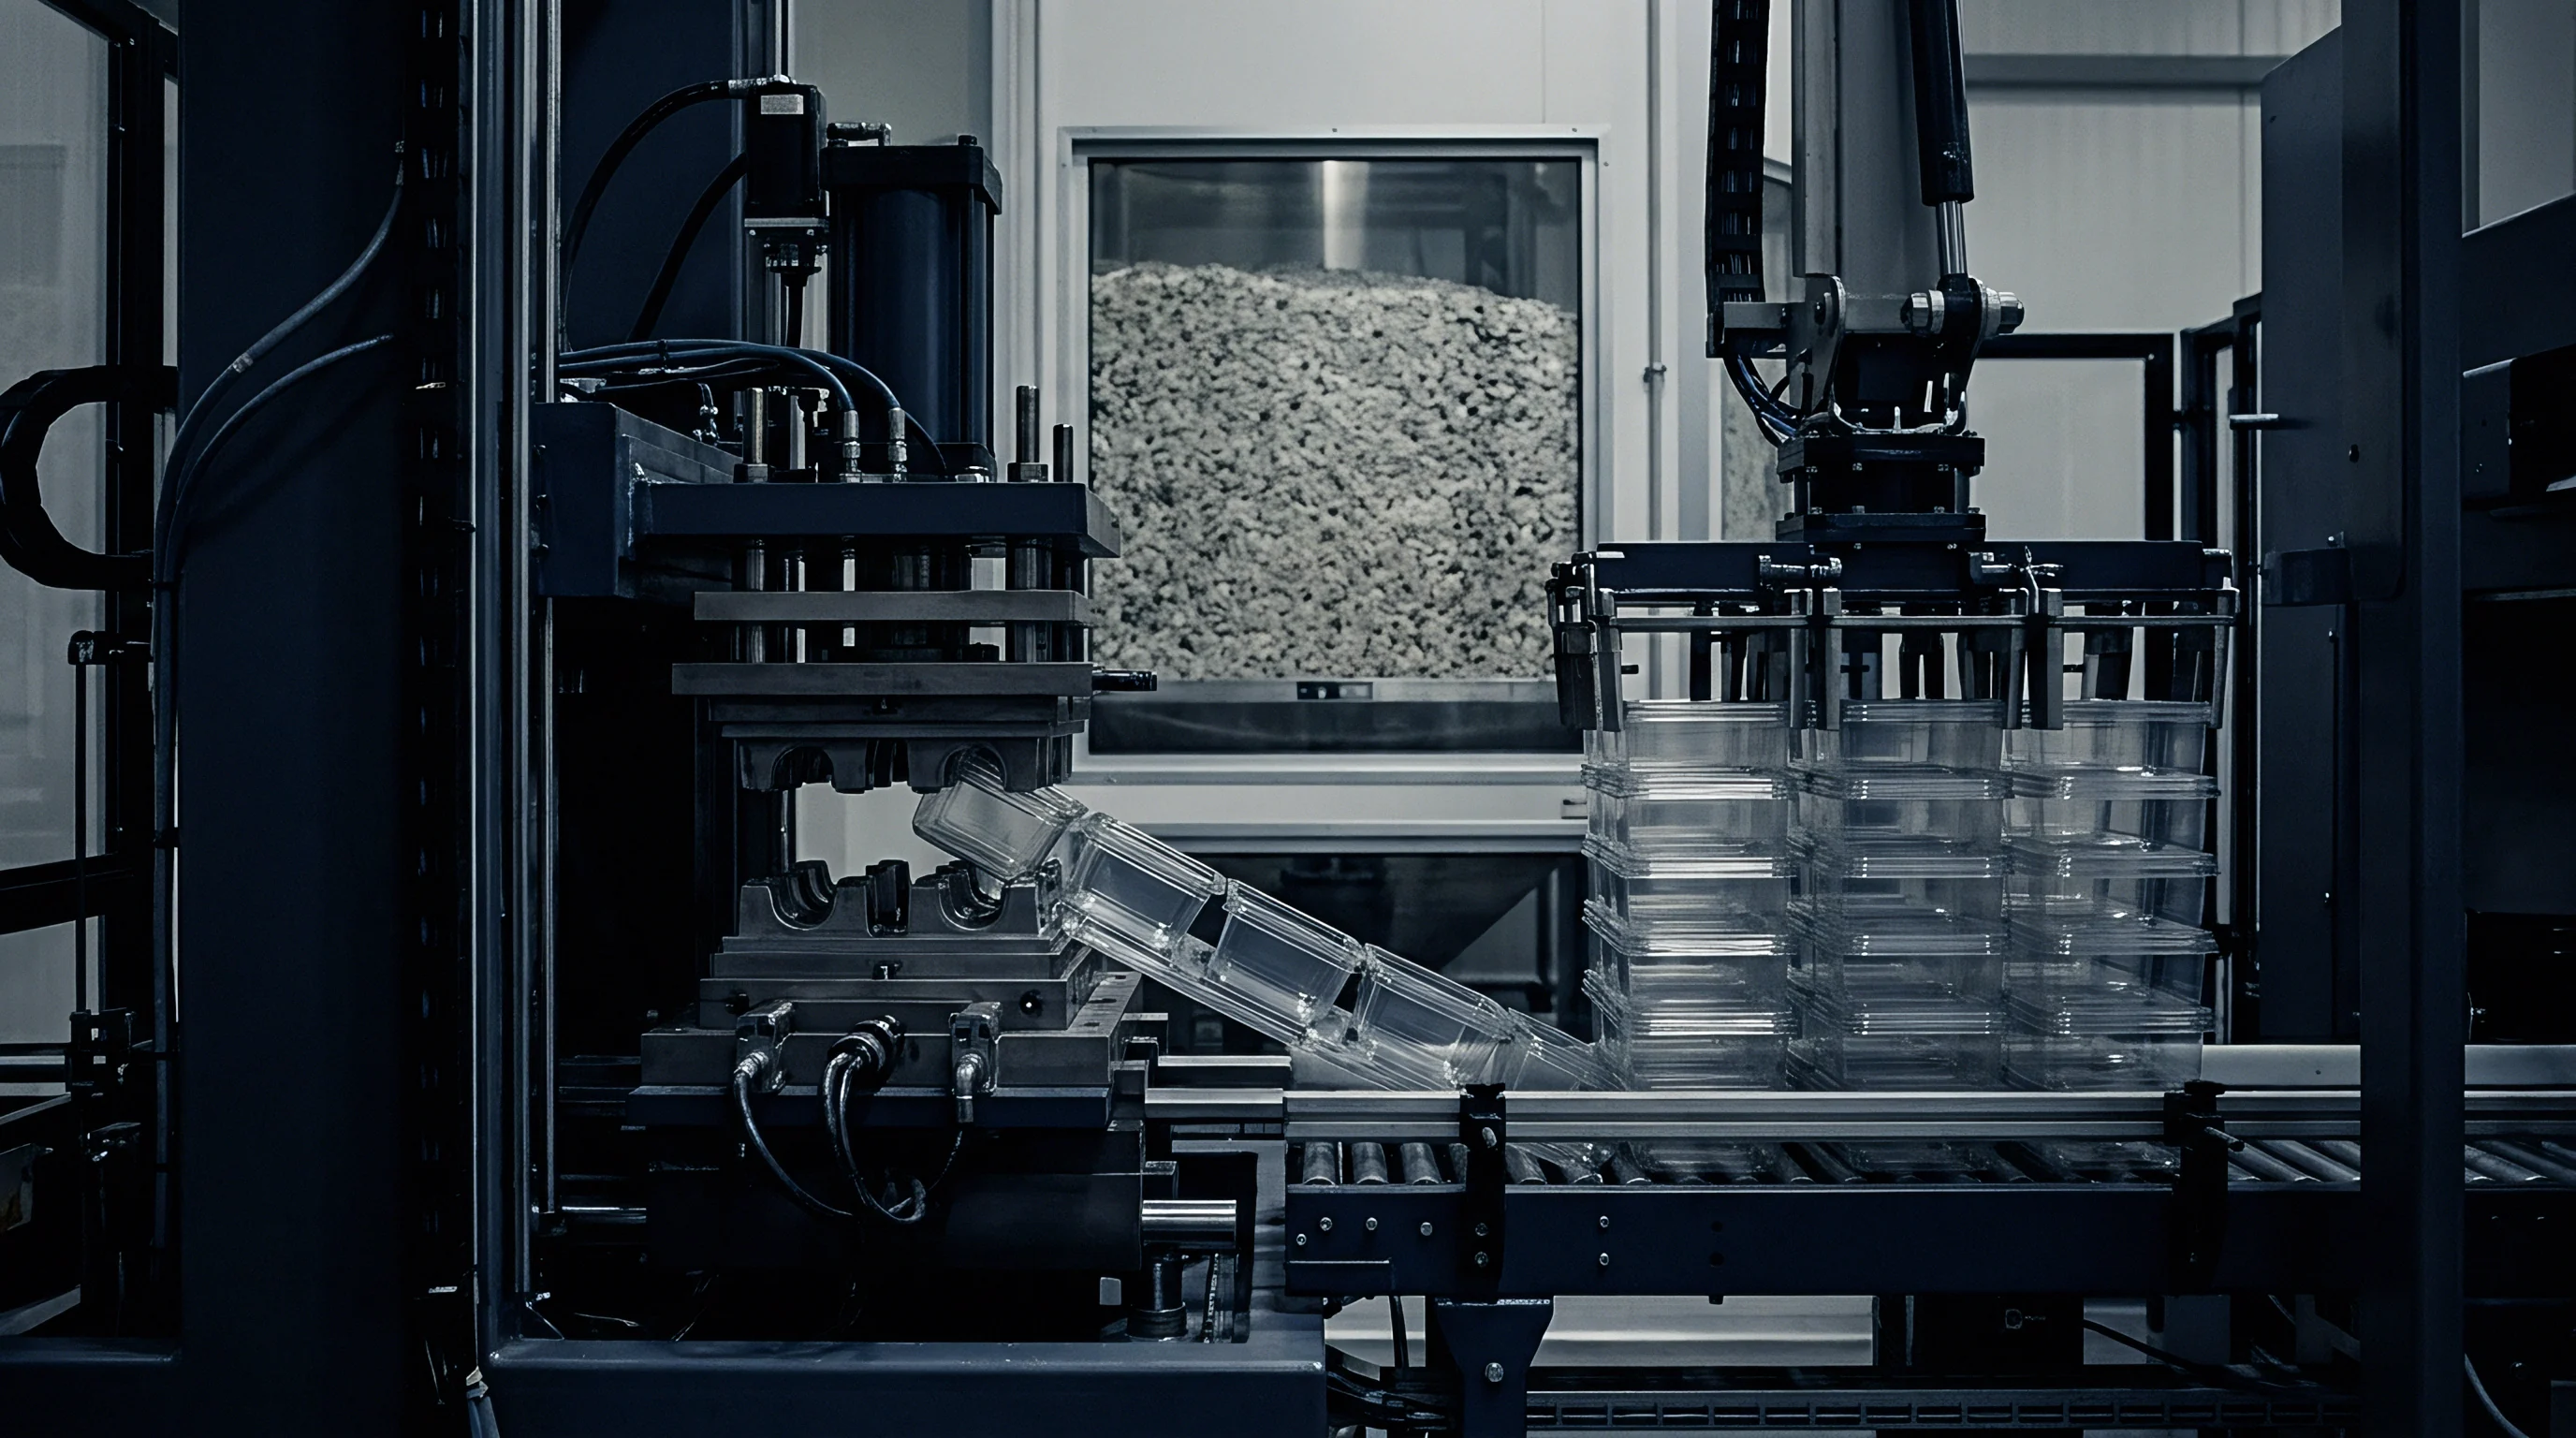
Webbing happens when loose sheet folds over onto itself between mold cavities or around sharp tool projections. It starts when unconstrained sheet expands faster than cavity volume during early inflation. As the plug moves down, it draws excess material into tight folds that weld together above glass transition temperature.
This forms heavy unwanted ribs that ruin part nesting, stack height, and trim accuracy.
Preventing webbing means tweaking the pre-stretch profile to consume extra sheet area before the plug enters. Higher pre-blow volume inflates the sheet into a dome, pulling material away from potential fold lines. Modifying plug geometry with step radii or altering cavity spacing changes tension distribution.
Resins with high strain hardening resist webbing naturally: local folds create sharp bending stress that triggers hardening, pushing material back into flat spans.
Amorphous sheet stretched beyond its strain hardening limit tears at the sharpest corner radius before filling the mold floor.
Thermoforming defects follow spatial patterns tied directly to tool contact order and local strain geometry.
- Corner Blowout Rupture characterized by jagged fractures at female corner radii from localized necking when the biaxial strain hardening slope falls below the Considere limit.
- Sidewall Banded Thinning consisting of horizontal optical lines and thickness drops caused by premature contact with cold plug surfaces before full pressure application.
- Inter-Cavity Sheet Webbing manifested as welded folds running between adjacent male tool cores, driven by unconstrained excess sheet area during plug entry.
- Optical Distortion Wavefronts visible as localized refractive index variations from non-uniform orientation and frozen-in stress gradients across deep draw transitions.
- Base Corner Chill Scuffing appearing as surface cloudiness or micro-abrasions where sheet slides under high contact pressure over rough tool radii at low local temperatures.

Dossier
Consistent high draw thermoforming requires explicit material specs in procurement dossiers. Standard datasheets reporting melt flow index, density, and uniaxial tensile strength tell you nothing about biaxial strain hardening above glass transition. A resin lot that meets every datasheet metric can still fail on a deep draw press from minor shifts in molecular weight distribution, branching, or extrusion thermal history.
Technical contracts must require metrics tied directly to melt elasticity under biaxial strain.
Sheet quality assurance must cover physical orientation along with chemical purity. Extrusion introduces machine- and transverse-direction orientation into roll stock. If orientation is unbalanced, the sheet shrinks unevenly under platen heaters, distorting the pre-blow bubble and altering local strain hardening.
Capping allowable heat shrinkage in oven tests ensures isotropic behavior on the machine.

Resin Molecular Weight Specification Clauses
Molecular weight distribution defines the width of the processing window. A high molecular weight tail increases entanglement density, driving up the strain hardening modulus. Low molecular weight fractions do the opposite ~ acting as plasticizers that speed up disentanglement and flatten hardening slopes.
Purchase dossiers should set polydispersity index limits measured by GPC alongside target weight-average molecular weight numbers.
Using regrind introduces risk in high draw operations. Prior heat cycles break molecular chains, shortening average lengths and reducing entanglement density. Mixing regrind into virgin resin drops the biaxial strain hardening modulus and narrows the processing window.
Sourcing documents must set strict limits on regrind percentages and mandate intrinsic viscosity testing for incoming blended lots.
Purchasing contracts specifying ISO 1133 melt volume rate limits without capping high-molecular-weight tail variations permit up to a twenty-five percent shift in sheet strain hardening modulus between resin batches.
Broadening the molecular weight distribution ratio of extruded PETG sheet from two point two to three point one causes corner blowouts on deep draw container lines, prompting lot rejection upon GPC testing.
A complete procurement dossier for high draw sheet requires explicit quality control parameters.
- Biaxial Strain Hardening Modulus Guarantee specifying minimum true stress upturn values measured by bubble inflation at target temperatures under Hencky strain rates of five per second.
- Gel Permeation Chromatography Profile defining target weight-average molecular weight, number-average molecular weight, and polydispersity limits to control entanglement density.
- Extrusion Thermal Shrinkage Limits establishing maximum unconstrained dimensional change under heat per ISO 11501 testing to prevent asymmetric draw during platen heating.
- Regrind Content and Quality Caps setting maximum permitted recycled content and mandating intrinsic viscosity test protocols for every production lot.
- Optical Clarity and Gel Count Limits defining limits for particulate contamination, cross-linked gels, and haze under ASTM D1003 standards.

Extrusion Thermal History and Orientation
Cooling rates during extrusion dictate frozen-in free volume and aging. Quenched sheet retains higher free volume, giving lower yield stress and better ductility when reheated on the press. Slowly cooled sheet relaxes structurally, showing higher yield stress and requiring more heat on the platen.
Dossiers must specify roll stack cooling temperatures during sheet production to ensure uniform thermal history through the sheet thickness.
Storage conditions also affect forming stability. Amorphous polymers like polycarbonate and PETG absorb moisture over time, which acts as a plasticizer during heating, lowering effective glass transition temperature and causing micro-foaming or bubbling. Specs must mandate moisture-barrier packaging and set clear moisture thresholds prior to processing.
Under Clause 8.2 of the international supply agreement for optical-grade amorphous sheet, any batch showing a strain hardening modulus variance over ten percent from bench baseline triggers complete lot rejection at supplier expense.


Ledger
The economics of high draw thermoforming come down to sheet thickness optimization. Resin accounts for sixty to seventy-five percent of landed container cost. Developing a resin blend and process window with strong biaxial strain hardening lets designers drop starting sheet gauge while protecting minimum wall thickness at critical corners.
Cutting starting gauge by ten percent yields substantial material savings across continuous runs.
Reducing gauge without raising scrap requires factoring in plug materials and cycle times. Syntactic foam plugs cost more upfront than wooden or basic plastic tooling. But their longer life and better strain distribution pay off quickly by dropping scrap from five percent down below zero point five percent, making the initial investment easy to justify over production runs.

Sheet Gauge Reduction Economics
Calculating landed unit cost means balancing sheet gauge, heat cycle times, and cooling demands. Thinner sheet heats faster on the platen, cutting dwell time and speeding up cycle rates. Dropping cycle time from five seconds to four increases machine output by twenty-five percent, spreading overhead, machine depreciation, and direct labor over more finished parts.
Pushing gauge reduction too far brings diminishing returns. If starting thickness drops too low, local draw ratios in corners exceed ultimate elongation and tear the sheet regardless of strain hardening strength. Scrap spikes, wiping out material savings.
Process engineers need to model the relationship between strain hardening, minimum corner thickness, and scrap costs to find the real economic optimum for sheet gauge.
| Parameter Metric | Baseline Spec | Optimized Spec A | Optimized Spec B | Aggressive Spec C |
|---|---|---|---|---|
| Starting Sheet Gauge (mm) | 1.50 | 1.35 | 1.20 | 1.05 |
| Part Weight (g) | 42.5 | 38.2 | 34.0 | 29.7 |
| Plug Tooling Type | Standard Nylon | Syntactic Epoxy | Syntactic Epoxy | Porous Aluminum |
| Tooling Investment ($) | 3,500 | 8,200 | 8,200 | 14,500 |
| Heating Cycle Time (s) | 4.2 | 3.7 | 3.2 | 2.8 |
| Scrap Rate (%) | 4.5% | 0.8% | 0.6% | 6.2% |
| Landed Unit Cost ($) | 0.142 | 0.124 | 0.108 | 0.115 |

Tooling Plug Selection and Wear Depreciation
Plug maintenance directly affects long-term margins. Syntactic foam wears down over repeated cycles with rigid sheet. As surface roughness increases, friction moves away from setup baseline values, altering how sheet slides and gradually eroding corner wall thickness over a shift.
Tooling budgets need regular allocations for plug inspection, re-polishing, and replacement.
Tooling ownership determines who absorbs the cost of plug wear and sheet spec failures. Sourcing contracts should explicitly assign maintenance duties between brand owner and contract molder. Where specs require expensive plug materials to compensate for low-hardening resin, clear ownership terms avoid disputes over replacement costs.
Aligning material strain hardening with tool design protects capital investments and stabilizes unit pricing over the life of the mold.
Amortizing the cost of a customized multi-cavity syntactic plug assembly across the first five hundred thousand units yields a net unit cost reduction of one point four cents per part while holding corner thickness tolerances within zero point zero five millimeters.
Calculating landed cost on multi-cavity lines also requires accounting for scrap recycling logistics. Internal regrind systems grind web scrap and feed it back to extrusion. The energy and labor to grind, re-dry, and re-extrude trim add real cost per kilogram of processed resin.
Minimizing web scrap with tighter cavity spacing and narrower clamp margins improves operating margins, reinforcing the financial value of precise strain hardening control across the entire process.