Quantifying Rheological Shear Sensitivity Variations in Recycled Polyamides
Recycled polyamide shear sensitivity varies with chain scission, requiring multi point capillary sweeps to prevent tooling flash and cavity short shots.


Slit
Viscosity measurements across shear rates from 10 to 10,000 reciprocal seconds reveal structural changes in reprocessed polyamide melts. Polymer molecules subjected to multiple thermal cycles undergo structural alterations that modify their response to mechanical stress. In virgin polyamide 6 and polyamide 66, the entanglement density creates predictable pseudoplastic behavior.
Recycled streams display variable shear thinning exponents due to random chain cleavage and thermal cross-linking. High shear rate alters apparent melt flow. These variations alter the pressure distribution along extrusion dies and injection moulding runner channels.

Non Newtonian Shear Thinning Mechanics in Reprocessed Polyamides
Melt behavior shifts predictably under elevated shear stress conditions. At low shear rates, polymer chains maintain entangled network configurations, establishing the zero-shear viscosity plateau. As shear rates exceed critical transition thresholds, polymer segments align along the flow field.
High shear forces disentangle polymer chains faster than thermal motion restores random coil configurations. In post-industrial recyclate (PIR) and post-consumer recyclate (PCR), this disentanglement threshold shifts toward lower shear rates when thermal degradation creates lower molecular weight fractions.
Quantifying this transition requires analyzing the viscosity reduction slope across processing shear regimes. Standard injection moulding gates expose polyamides to shear rates between 1,000 and 50,000 reciprocal seconds. Extrusion dies operate at lower regimes, typically between 50 and 500 reciprocal seconds.
Recycled polyamides exhibiting exaggerated shear thinning flow rapidly through gate orifices but retain elevated resistance within thicker part walls. Uncontrolled viscosity drops at high shear rates induce material flash at the cavity parting line.

Carreau Yasuda Rheological Curve Fitting Parameters
Mathematical models quantify the transition between zero-shear viscosity and the power-law regime. The Carreau-Yasuda model describes this non-linear viscosity behavior across five orders of shear rate magnitude:
η(γ̇) = η_0 ^((n – 1) / a)
In this formulation, η_0 represents zero-shear viscosity in Pascal-seconds, λ represents the characteristic relaxation time in seconds, n represents the dimensionless power-law index, and a controls the transition width between Newtonian and power-law regions. Virgin polyamide 66 typically exhibits a power-law index n between 0.65 and 0.75. Recycled grades contaminated with thermal oxidation products or degraded chains display index values dropping to between 0.42 and 0.55, signaling sharp shear thinning kinetics.
Capillary rheometry tests at 275 degrees Celsius demonstrate a 34 percent reduction in apparent viscosity for post-consumer polyamide 66 at 3000 reciprocal seconds compared to virgin grade material.
Applying the Cox-Merz rule provides cross-verification between steady shear capillary data and dynamic oscillatory shear spectra. The Cox-Merz rule states that dynamic viscosity measured as a function of angular frequency equals steady-state shear viscosity measured as a function of shear rate when shear rate equals angular frequency. In reprocessed polyamides containing micro-gel fractions or high-polydispersity tails, the Cox-Merz rule breaks down at lower frequencies.
Dynamic viscosity overestimates steady shear viscosity because physical gel structures withstand small oscillatory strains but break down irreversibly under continuous capillary shear stress. Specifying material without accounting for this breakdown leads to severe tooling pressure miscalculations during mould design.
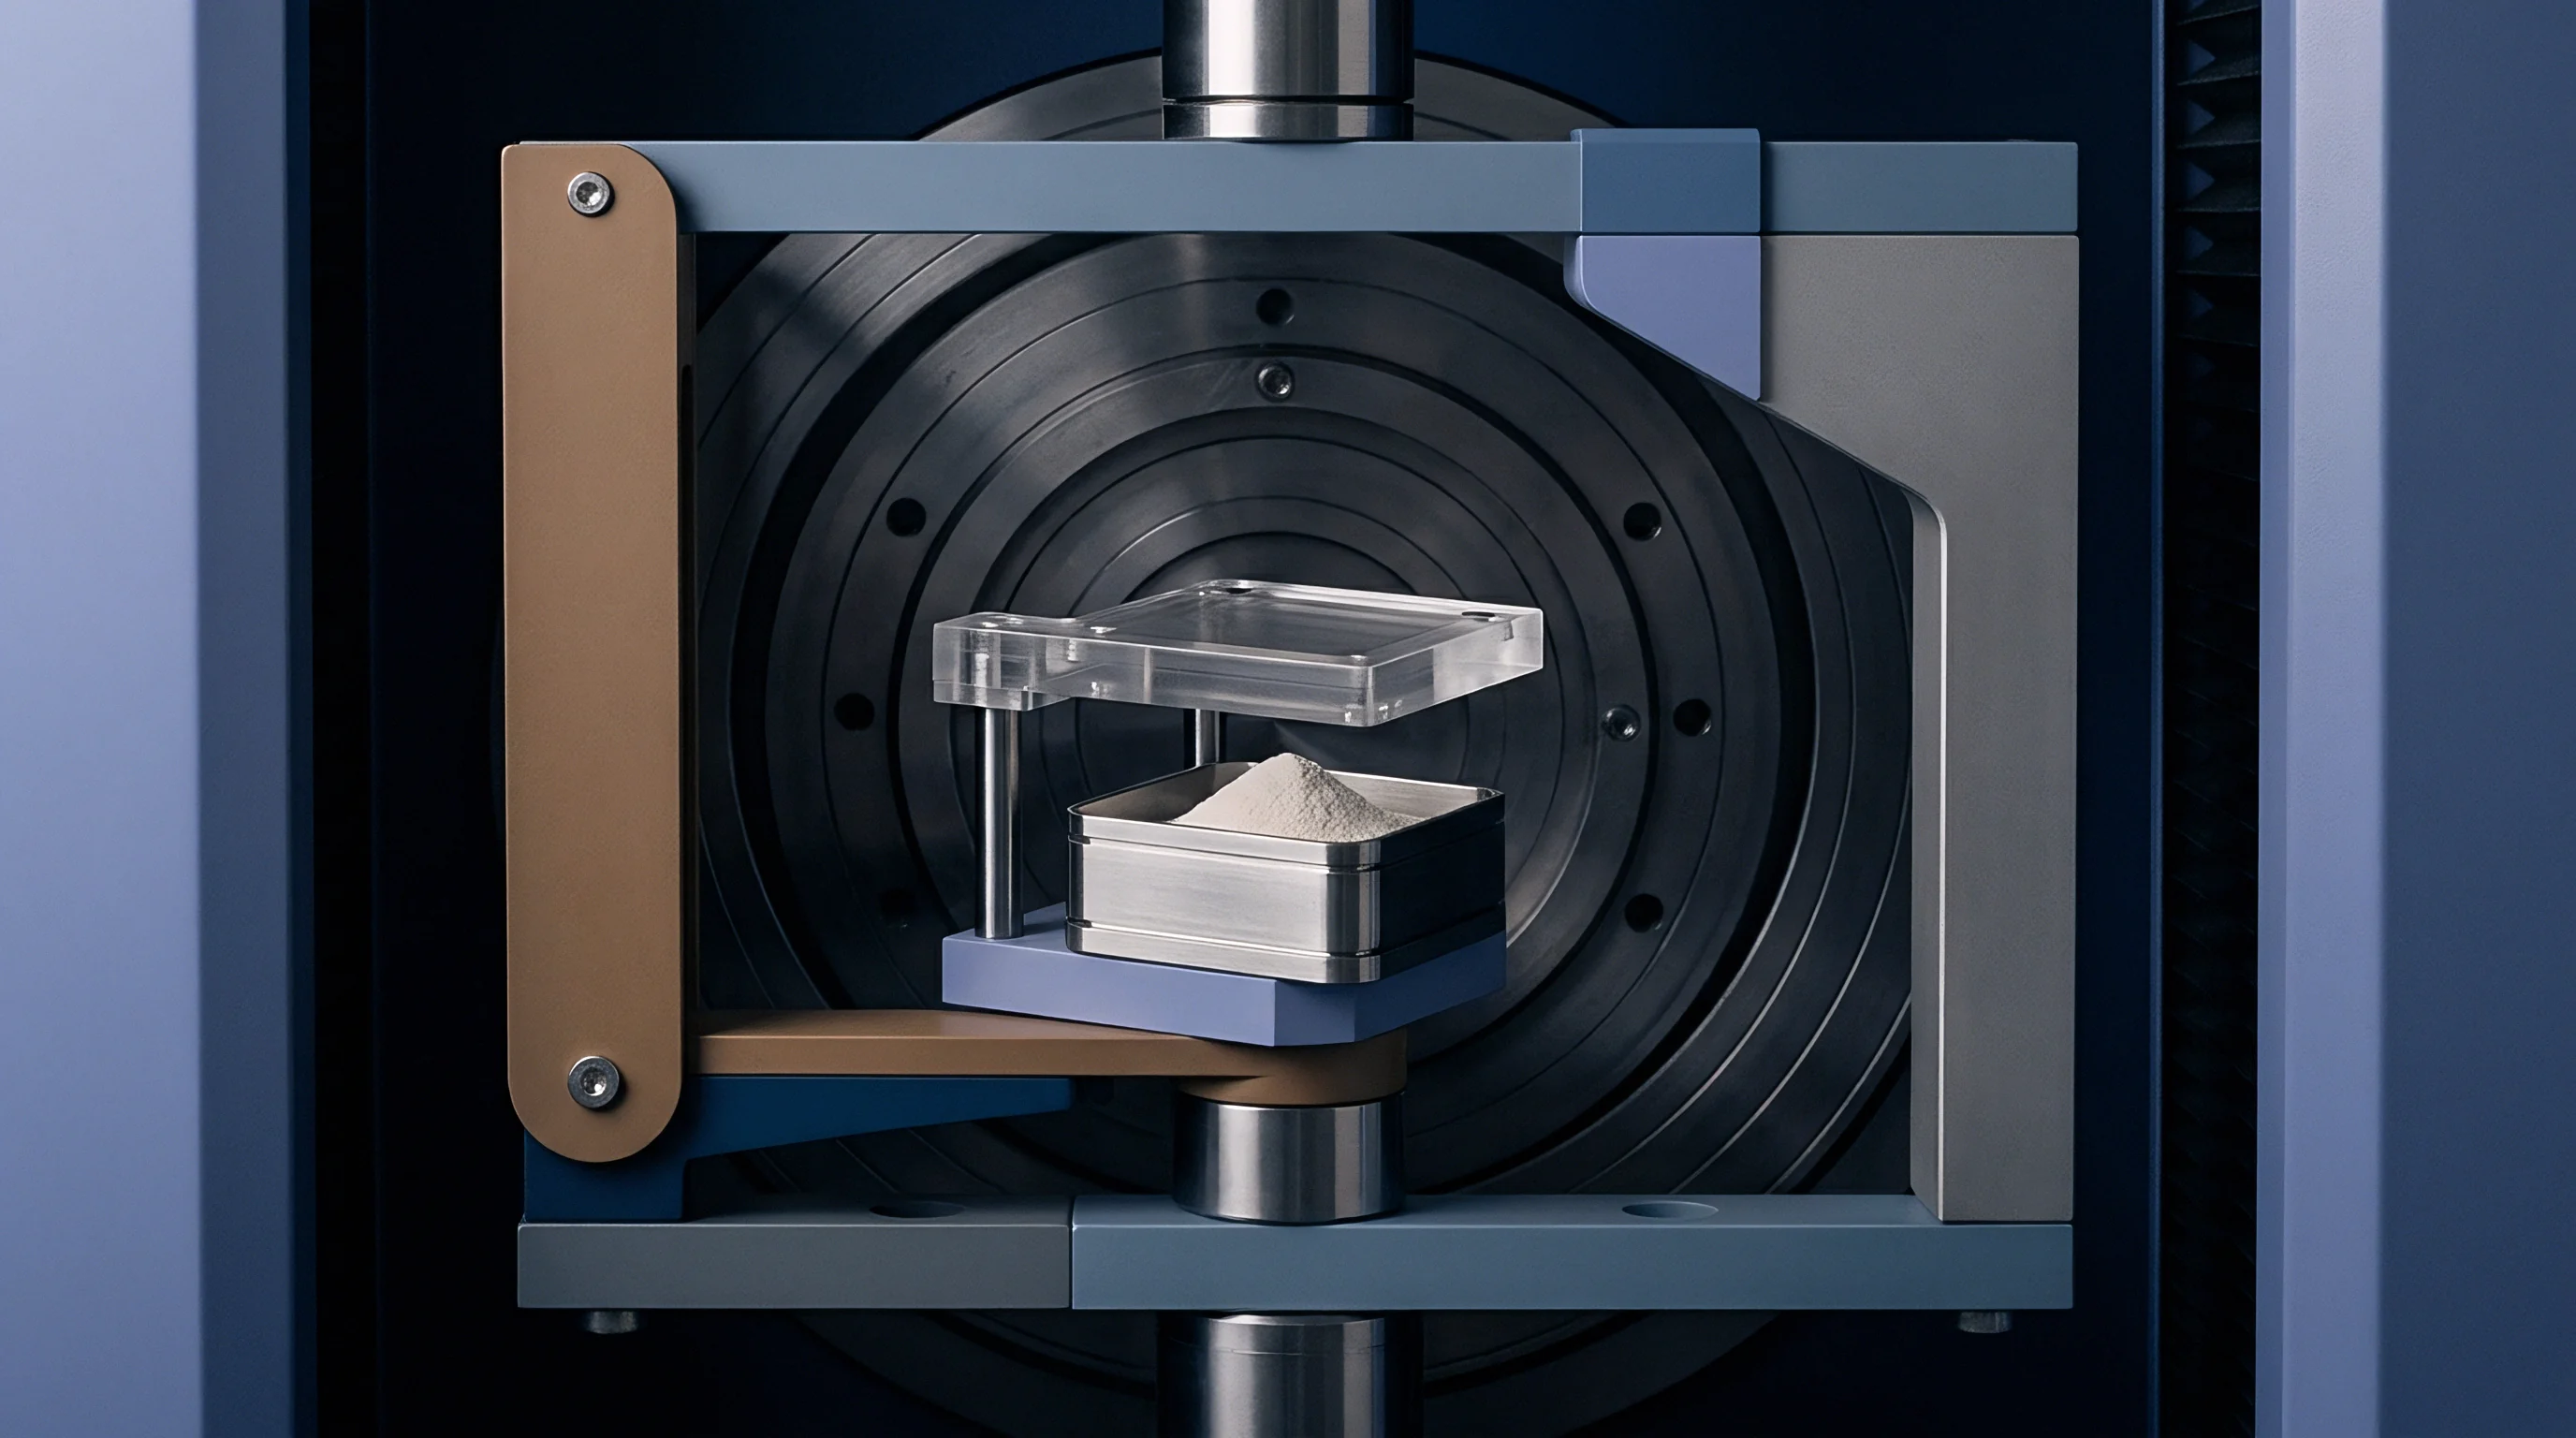

Scission
Thermal and hydrolytic breakdown during compounding alters the average chain length of polyamide 6 and polyamide 66. Each melt reprocessing pass exposes the polymer matrix to residual moisture, dissolved oxygen, and high mechanical energy. Polyamides degrade through distinct molecular mechanisms: thermal-oxidative cleavage lowers average weight-average molecular weight, while thermo-mechanical shear breaks long polymer backbones.
Reduced molecular mass compresses the viscoelastic spectrum, shifting zero-shear viscosity downward while broadening flow non-linearity across processing rates. Chain scission reduces zero shear viscosity.

Molecular Weight Distribution Width and Flow Non Linearity
Thermal oxidation during reextrusion alters polymer chain distribution profiles. While prime resin possesses a narrow polydispersity index (Mw/Mn between 1.8 and 2.2), reprocessed polyamides frequently expand to polydispersity values between 2.8 and 4.2. High molecular weight fractions dominate elastic response and zero-shear viscosity, while low molecular weight components act as internal plasticizers during shear flow.
Molar mass controls polymer relaxation dynamics.
This molecular heterogeneity expands the transition zone between zero-shear behavior and power-law thinning. Polymer melt elasticity creates die swell. Long polymer chains relax slowly after exiting high-shear dies, while short chains relax instantly.
Consequently, recycled polyamides present unpredictable swelling ratios at the die exit, causing dimensional instability in profile extrusion applications.
| Grade Designation | Zero-Shear Viscosity (Pa s) | Power-Law Index n | Relaxation Time (s) | Polydispersity Index Mw/Mn |
|---|---|---|---|---|
| Prime PA66 Standard Flow | 420 | 0.72 | 0.012 | 2.05 |
| PIR PA66 First Reprocess Pass | 310 | 0.64 | 0.008 | 2.45 |
| PCR PA66 Commercial Regrind Blend | 185 | 0.48 | 0.003 | 3.80 |
| PCR PA6 Thermal Degraded Lot | 95 | 0.41 | 0.001 | 4.35 |

Dynamic Mechanical Moduli in Reprocessed Polymers
Oscillatory shear measurements reveal the viscoelastic transition across low frequency ranges. Rotational rheometers operating with parallel-plate geometries generate storage modulus (G’) and loss modulus (G”) curves across angular frequencies from 0.1 to 100 radians per second. The crossover frequency, where storage modulus equals loss modulus, serves as a direct indicator of mean molecular mass and molecular weight distribution.
Reprocessed polyamides exhibit a crossover frequency shift toward higher values due to reduced average chain length.
Tracking the crossover modulus (Gc) quantifies polydispersity changes independent of temperature. As polydispersity broadens through non-uniform recycling streams, Gc decreases. This shift confirms that low-shear viscoelastic measurements provide sensitive detection of degraded resin fractions long before standard single-point melt flow rate testing records a clear anomaly.
Processing engineers relying exclusively on single-point melt flow measurements risk accepting lots with broad polydispersity profiles that fail during thin-wall injection moulding. Polymer rheology requires multi-point spectrum analysis.


Moisture
Water content inside polyamide pellets rapidly induces chain cleavage at processing temperatures exceeding 240 degrees Celsius. Amide bonds form through condensation reactions and reverse through hydrolysis under elevated temperature and moisture conditions. Water drives hydrolytic chain scission.
Extruding or testing polyamide containing more than 0.05 percent water by weight causes instantaneous molecular weight reduction inside the testing barrel. Moisture accelerates hydrolytic chain breakdown.
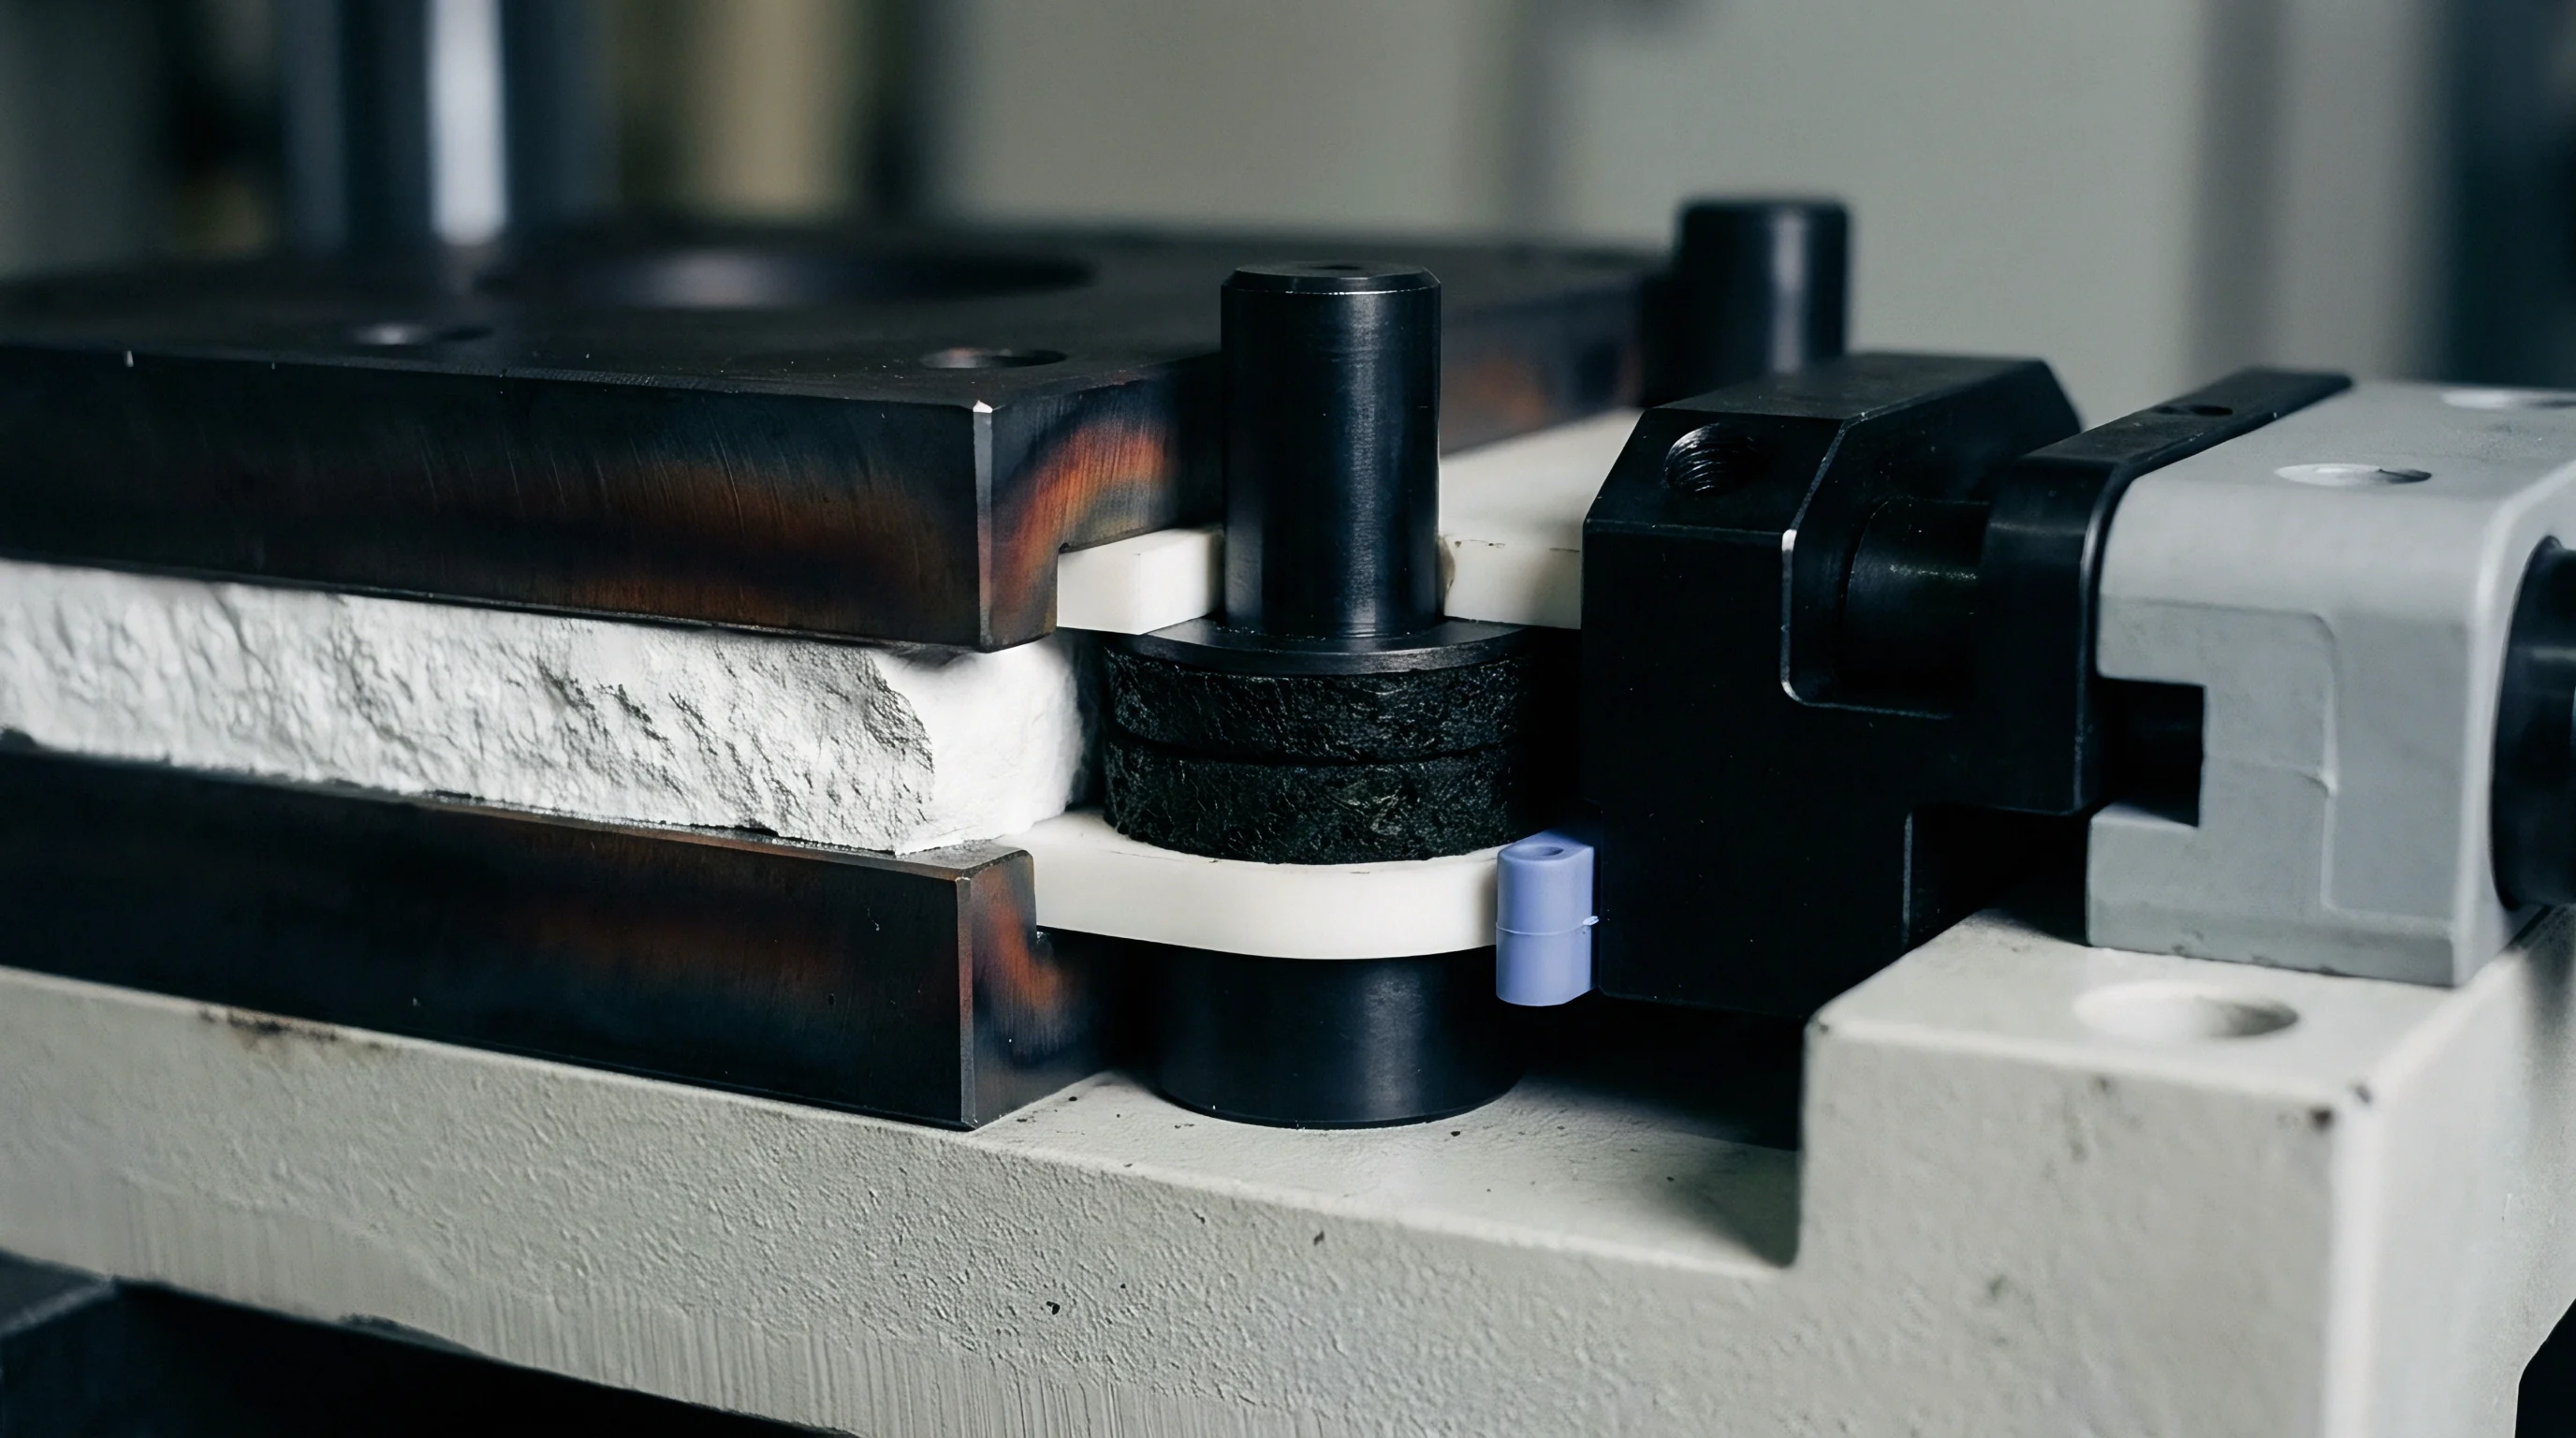
Hydrolytic Chain Scission during Rheological Characterization
Water presence in molten polyamide activates rapid cleavage of amide linkages. A single water molecule cleaves one polymer chain, yielding carboxylic acid and amine end-groups. This reaction occurs in seconds within melt testing equipment.
When capillary rheometry tests run on inadequately dried recycled polyamides, apparent shear thinning figures reflect chemical degradation taking place during the test run rather than actual non-Newtonian flow behavior.
Dry pellets yield repeatable viscosity measurements. Moisture-induced degradation artificially depresses the power-law index n, leading analysts to overestimate the resin’s shear sensitivity. To prevent false reporting, testing labs enforce stringent drying pre-conditioning procedures.

Sample Drying Protocols for Capillary Analysis
Conditioning pellets prior to testing isolates thermal degradation from hydrolytic degradation. Standard convection drying fails for polyamides due to surface oxidation and atmospheric humidity adsorption during sample loading.
- Extract representative 50-gram pellet samples from sealed aluminum-laminated bags immediately upon delivery to prevent humidity adsorption.
- Place test specimens inside a vacuum desiccant dryer operating at 80 degrees Celsius under a vacuum pressure below 10 millibars for 16 hours.
- Transfer dried pellets directly into the rheometer barrel within 45 seconds using a sealed charging funnel to limit air exposure.
- Verify residual water content using Karl Fischer titration according to ISO 15512 Method C prior to initiating thermal testing.
ISO 15512 Method C mandates residual water content below 0.05 percent by weight prior to capillary rheology testing to prevent artificial shear thinning caused by hydrolytic melt degradation.
Suppliers frequently attribute extreme batch-to-batch viscosity drops in recycled polyamides to environmental humidity variations during shipping rather than structural polymer degradation. Sourcing engineers eliminate this argument by pairing verified Karl Fischer water content figures with capillary viscosity curves measured under inert nitrogen atmospheres.


Capillary
Measuring true wall shear stress requires accounting for entrance pressure losses and non-Newtonian velocity profiles in narrow dies. High shear stress induces melt fracture. Standard capillary rheometry according to ISO 11443 or ASTM D3835 utilizes cylindrical dies to measure pressure drops across specified flow rates.
Raw pressure readings overstate shear stress if entrance and exit pressure losses remain uncorrected. Wall slip skews apparent shear rate. Precise shear sensitivity quantification demands rigorous mathematical corrections applied to raw test data.
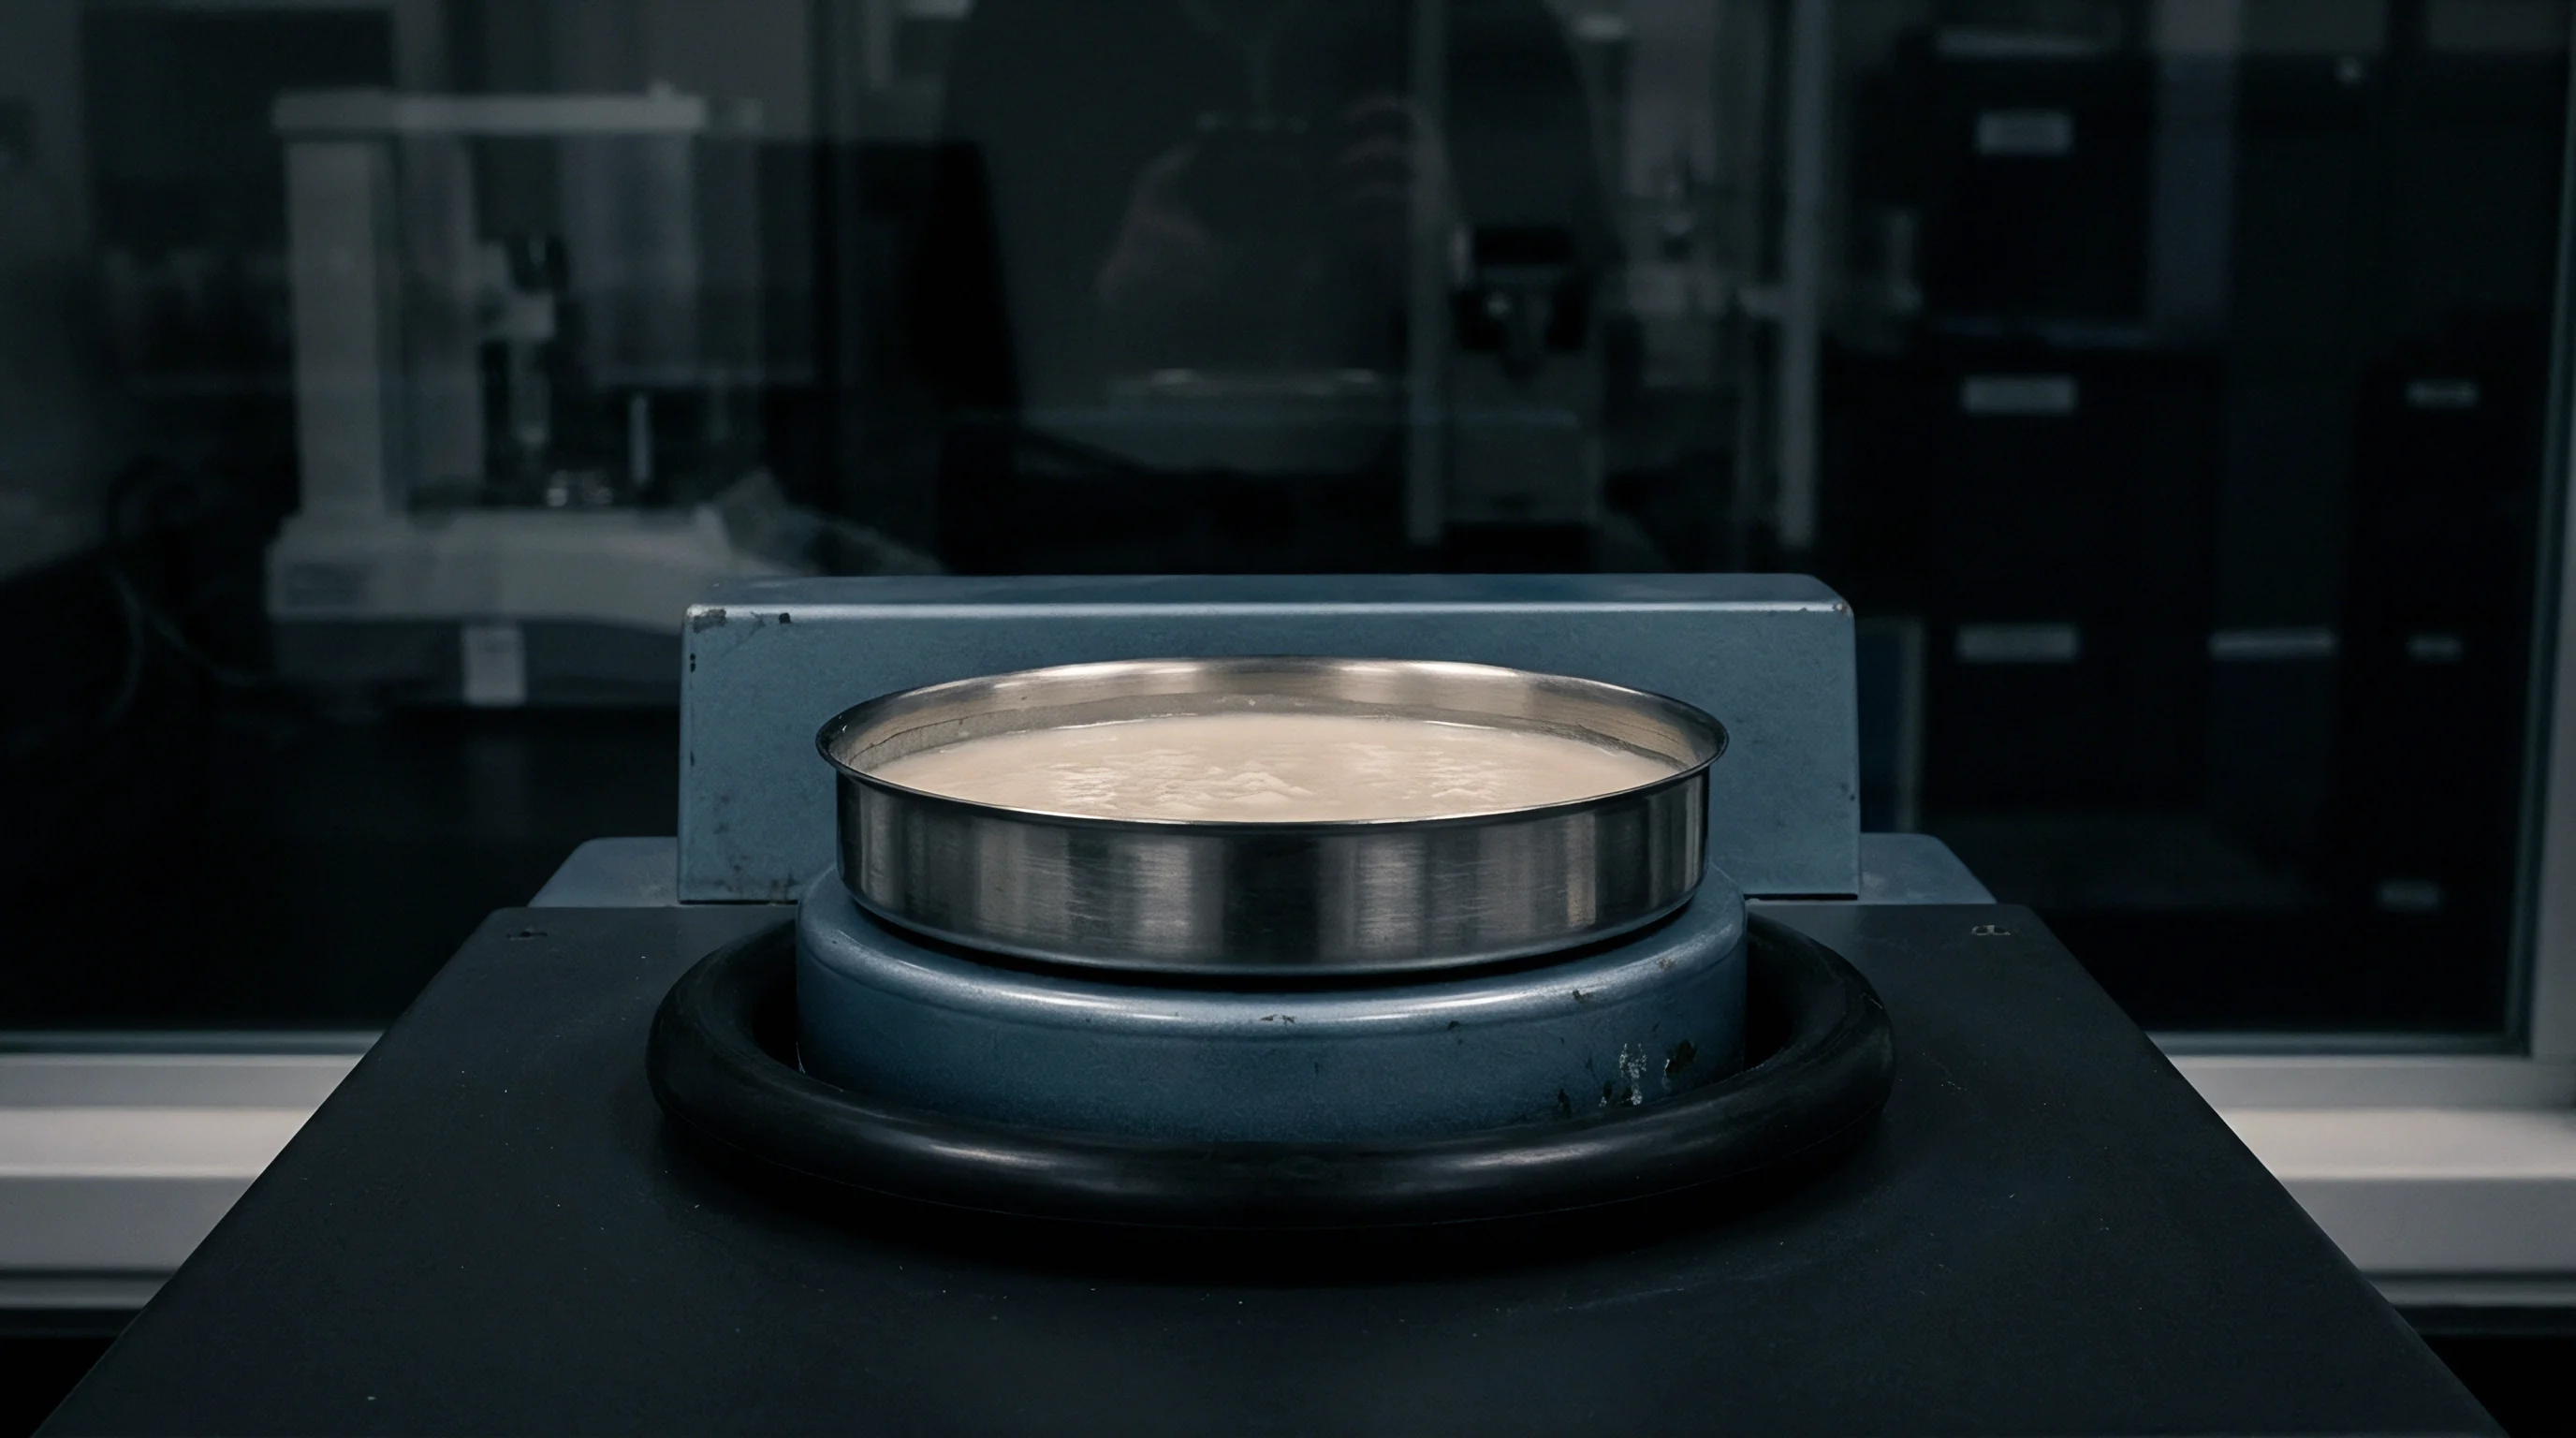
Bagley and Rabinowitsch Corrections for Recycled Resins
Standard capillary rheometer raw output assumes Newtonian flow and negligible entrance pressure loss. The Bagley correction corrects for energy losses occurring as the polymer melt converges from the wide barrel into the narrow die orifice. Executing a Bagley correction requires testing the resin through at least three dies of identical diameter but varying length-to-diameter (L/D) ratios, such as L/D 5, 10, and 20.
Plotting total pressure drop against die L/D ratio yields an intercept value representing the orifice entrance pressure drop (Pc).
Recycled polyamides with high elasticity display elevated entrance pressure drops due to extensional flow resistance at the die entrance. Subtracting Pc from total measured pressure yields the true wall shear stress (τ_w):
τ_w = (P_total – P_c) / (4 (L/D))
Following the Bagley correction, the Rabinowitsch correction adjusts the apparent shear rate (γ̇_a) to reflect true wall shear rate (γ̇_w) for non-Newtonian fluids:
γ̇_w = ((3 n’) + 1) / (4 n’) γ̇_a
Here, n’ represents the local slope of log(τ_w) plotted against log(γ̇_a). Skipping Rabinowitsch corrections introduces errors exceeding 25 percent in calculated shear rates for highly pseudoplastic recycled polyamides.
A broadening molecular weight distribution in recycled polyamide lowers the onset shear rate for non-Newtonian flow while heightening melt sensitivity to tool gate pressure drops.

Which Rheological Indicators Best Predict Processing Instability?
Comparing apparent viscosity ratios at two distinct shear rates provides an immediate baseline for batch consistency. The Shear Thinning Index (STI) expresses the ratio of apparent viscosity at a baseline shear rate (100 s⁻¹) to apparent viscosity at a representative processing shear rate (1,000 s⁻¹ or 3,000 s⁻¹):
STI = η(100 s⁻¹) / η(1000 s⁻¹)
Virgin PA66 exhibits an STI value around 2.1 under standard processing conditions. High-regrade PCR lots frequently exhibit STI values exceeding 3.8. A high STI value warns tool operators that minor adjustments to injection speed will cause dramatic fluctuations in fill pressure and melt front velocity.
- Apparent Viscosity Ratio sets the upper allowable limit for melt flow variation between low and high shear tool channels.
- Power Law Exponent Slope identifies the onset of severe pseudoplastic thinning across thin-wall injection channels.
- Cross Over Frequency Shift detects subtle changes in molar mass distribution before visual molding defects appear.
- Die Swell Ratio Elasticity establishes maximum allowable elastic recovery to avoid gate freezing and part warpage.
A purchase contract clause specifying compliance with ISO 11443 capillary testing at 280 degrees Celsius across shear rates from 100 to 5,000 reciprocal seconds, with Bagley and Rabinowitsch corrections applied, binds suppliers to deliver resin within a defined viscosity window across all operational shear regimes.


Moulding
Injecting polymer melt into thin-walled cavities generates localized shear rates exceeding 5,000 reciprocal seconds. Pressure drops across long flow channels. Melt viscosity drops rapidly as the polymer passes through narrow gates due to intense viscous shear heating and non-Newtonian chain alignment.
Flash occurs when melt viscosity drops. When using recycled polyamide lots with unquantified shear sensitivity variations, the runner system experiences variable hydraulic resistance, disrupting cavity filling dynamics and thermal gate sealing times.

Hot Runner Tool Pressure Drops and Viscosity Variations
Hot runner nozzles maintain constant thermal energy while applying intense mechanical shear to passing melt streams. Tool gates experience peak shear stress. A recycled polyamide lot possessing a low power-law index (n = 0.42) exhibits extreme shear thinning inside small circular gate orifices.
As the material enters the wider main cavity, local shear rates drop abruptly from 10,000 s⁻¹ down to 200 s⁻¹.
This localized shear rate reduction causes an immediate, steep increase in melt viscosity within the expanding flow front. If the injection machine maintains constant volumetric flow, the suddenly increased viscosity elevates cavity wall pressure, causing sink marks, weld line weakness, or incomplete cavity filling. High shear viscosity determines fill pressure.
| Material Formulation | Viscosity at 100 s-1 (Pa s) | Viscosity at 3000 s-1 (Pa s) | Tool Pressure Drop Delta P (bar) | Parting Line Flash Risk |
|---|---|---|---|---|
| Prime PA66 Unfilled | 380 | 110 | 820 | Low Threshold |
| 70/30 Virgin/PIR Blend | 310 | 82 | 640 | Moderate Threshold |
| 100% PCR PA66 Reprocessed Lot A | 220 | 45 | 380 | Severe Flash Exposure |
| 100% PCR PA66 Reprocessed Lot B | 410 | 62 | 490 | Moderate Flash Exposure |

Quantitative Shear Sensitivity Calculation Case Study
Evaluating a 30 percent recycled polyamide 66 compound against a prime control demonstrates the tool cavity filling impact. Assume an injection mould cavity possessing a wall thickness of 1.5 millimeters, a flow length of 180 millimeters, and a target cavity fill time of 0.6 seconds. The nominal shear rate inside the cavity runner system equals 3,200 reciprocal seconds.
The prime control resin displays a viscosity of 105 Pa s at 3,200 s⁻¹, producing a calculated runner pressure drop of 680 bar. The recycled compound exhibits an apparent viscosity of 48 Pa s at 3,200 s⁻¹ due to lower average molecular weight and broad polydispersity. Under identical machine parameters, the calculated runner pressure drop for the recycled lot falls to 310 bar.
The 370 bar pressure surplus accelerates the melt front into the cavity, increasing cavity peak pressure beyond the tool clamp force capability.
- Uncontrolled Tool Flash occurs when high shear thinning reduces melt viscosity below cavity parting line seal thresholds.
- Short Shot Shortfalls result from unexpected viscosity spikes at lower shear rates within thick runner sections.
- Thermal Shear Burning develops when elevated shear rates generate excessive viscous dissipation inside narrow gate orifices.
- Jetting Flow Marks emerge when low zero-shear elasticity prevents cohesive melt front progression into open tool cavities.
How do compounding engineers continuously balance the trade-off between chain-extender additive dosing and high-shear viscosity control in post-consumer polyamides without inducing melt fracture during high-speed injection moulding runs?


Margin
Financial performance in high-volume injection molding depends on maintaining consistent cycle times and low scrap rates. Cycle times drift as viscosity fluctuates. Purchasing reprocessed polyamide pellets offers direct raw material savings between 20 and 40 percent compared to prime resin contract pricing.
Unquantified shear sensitivity variations silently eradicate these gross material savings through yield losses, tool downtime, and cycle time extensions. Uniform rheology stabilizes cycle economics.

Commercial Risk Management in Recycled Resin Sourcing
Procuring recycled polyamide without multi-point capillary rheology profiles transfers processing risk entirely onto the moulding floor. Standard single-point melt flow index (MFI) tests performed according to ISO 1133 (275 °C / 2.16 kg) fail to capture rheological behavior at processing shear rates. A reprocessed resin batch showing an MFI identical to prime material can exhibit a 50 percent lower viscosity at 3,000 reciprocal seconds.
Material arriving on the shop floor under matching MFI certificates frequently forces moulders to adjust injection speed profiles, holding pressure limits, and cooling times on a lot-by-lot basis.
Cycle time drift of just 1.5 seconds on a 12-second automotive connector tool converts a 25 percent resin purchase discount into a net operational loss. Downtime spent purging tools, removing flash, and re-establishing processing windows increases part manufacturing cost beyond the margin threshold defined during project quoting.
Recycled polyamide lots possessing unquantified shear sensitivity variations introduce unrecoverable sorting and tooling downtime costs that eliminate raw material purchase discounts.

Specifying Shear Thinning Windows in Sourcing Contracts
Procurement documents defining only single-point melt flow rate fail to catch severe viscosity variations under high shear rates. Procurement teams protect commercial returns by embedding multi-point viscosity acceptance boundaries into material specifications. Setting an allowable shear thinning index band (for example, STI = 2.0 to 2.4) alongside zero-shear viscosity limits forces compounders to stabilize molecular weight distribution through controlled blending and chain extension technology.
Requiring compounders to provide certified capillary curves (ISO 11443) for every 10-tonne shipping lot shifts compliance testing responsibility back to the feedstock supplier. Incoming quality verification teams audit arriving lots against these certified rheological curves using quick single-point rotational rheometer frequency sweeps, preventing non-conforming material from entering production storage silos.