Dynamic Oscillatory Shear Frequency Sweeps for Polyolefin Characterization
Dynamic frequency sweeps isolate polyolefin molecular weight distribution and branching where melt index fails, fixing processability and reject thresholds.

Plate
A standard melt flow test under ISO 1133 or ASTM D1238 records a single extrusion rate through an orifice under fixed deadweight. A fractional melt high-density polyethylene rated at 0.35 grams per 10 minutes at 190 degrees Celsius under a 2.16-kilogram load frequently shows severe melt fracture during high-speed blown film extrusion, while another resin lot carrying that exact nominal number processes without surface distortion. Small-amplitude oscillatory shear measurements resolve that discrepancy by isolating the elastic storage modulus and viscous loss modulus across a defined angular frequency spectrum.
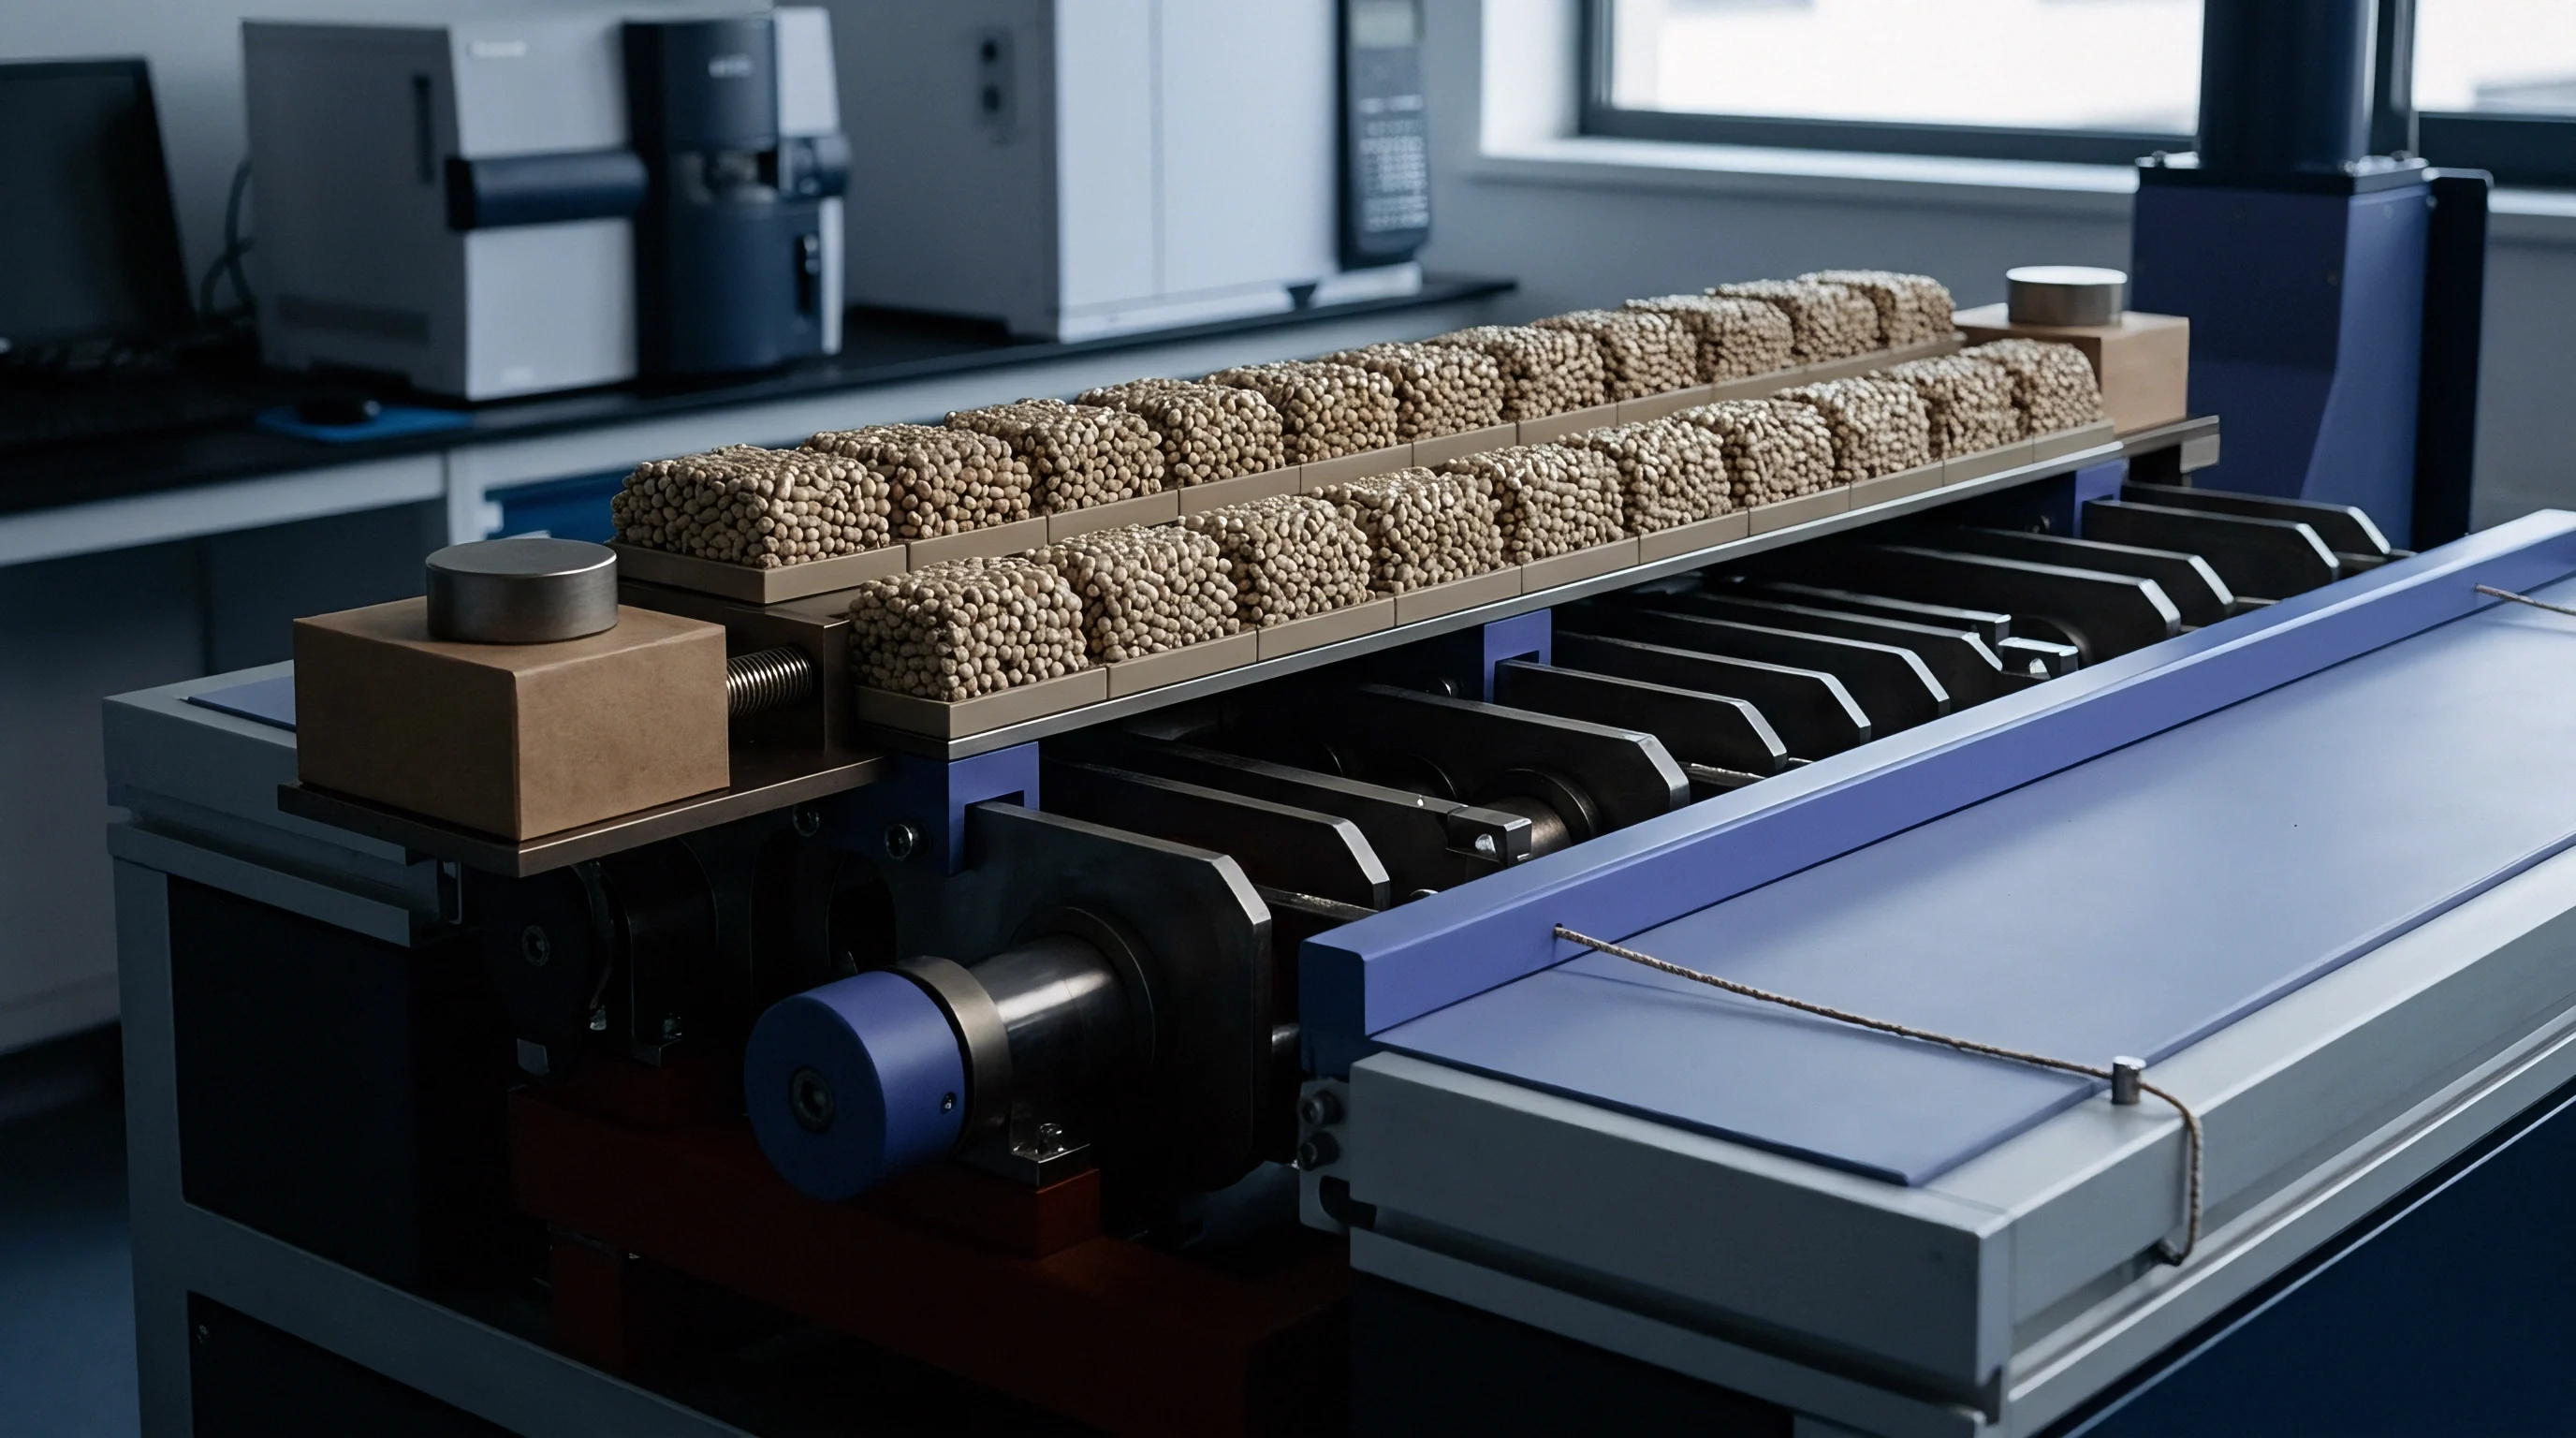
Dynamic oscillatory testing operates on a rotational rheometer utilizing parallel-plate or cone-plate geometry under controlled temperature and inert atmosphere, governed by ASTM D4440 and ISO 6721-10. Specimen preparation dictates data fidelity. Direct compression molding of polyolefin pellets into void-free discs of 25-millimeter diameter avoids the frozen orientation typical of injection-molded plaques.
Setting the gap between 1.0 and 1.5 millimeters prevents meniscus distortion while avoiding edge overflow. Thermal equilibrium requires eight to twelve minutes under a continuous nitrogen blanket; trapped air or uneven contact invalidates the torque response at low angular velocities.

Strain Sweeps and Linear Limits
Frequency sweep experiments produce meaningful viscoelastic parameters solely within the linear viscoelastic region of the polyolefin melt. An initial strain sweep at fixed frequency identifies the critical strain limit where the dynamic moduli become independent of deformation amplitude. Unfilled linear low-density polyethylene maintains linear response up to 10 or 15 percent strain at 190 degrees Celsius.
Highly filled polyolefin compounds or ultra-high molecular weight fractions depart from linearity at strain amplitudes below 1 percent.
A strain amplitude of 5 percent at 190 degrees Celsius maintains linear viscoelasticity across standard polyolefin melts while generating sufficient torque above machine noise floors.
Applying strain amplitudes above the critical threshold ruptures the equilibrium entanglement network, introducing non-linear harmonics that register artificially depressed storage modulus values. The rheometer transducer records distorted torque waveforms that defeat the mathematical conversion to fundamental viscoelastic functions. Operating at 0.05 to 500 radians per second demands automated strain adjustment across decades to maintain raw torque within the calibrated transducer range without breaching the linear boundary.


Crossover
Frequency sweeps track the storage modulus representing elastic energy storage and the loss modulus representing viscous energy dissipation across three or four decades of deformation rate. At low frequencies approaching terminal flow, linear polyolefin chains disentangle completely within the experimental oscillation period, producing the classical fluid slopes where the loss modulus scales with frequency to the first power and the storage modulus scales with frequency squared. Broad molecular weight distributions disrupt these theoretical limiting slopes by retaining high-molecular-weight fractions with relaxation times spanning hundreds of seconds.

Why Do Identical Melt Index Resins Diverge?
The crossover point marks the specific angular frequency where dynamic storage modulus equals dynamic loss modulus, yielding a loss factor tangent of unity. This coordinates pair reflects the dominant macromolecular architecture of the polymer batch. Melt flow index measures resistance to deformation in an uncontrolled shear zone roughly corresponding to an angular frequency between 1 and 10 radians per second.
The crossover point often sits far outside this arbitrary window, revealing structural differences that single-point factory tests miss entirely.
| Polyolefin Grade | Nominal MFR (g/10 min) | Crossover Modulus (Pa) | Crossover Frequency (rad/s) | Polydispersity Index (Mw/Mn) |
|---|---|---|---|---|
| Metallocene LLDPE (Hexene) | 1.0 (190 C, 2.16 kg) | 58,200 | 18.4 | 2.2 |
| Ziegler-Natta LLDPE (Butene) | 1.0 (190 C, 2.16 kg) | 36,400 | 6.2 | 4.1 |
| Autoclave LDPE (Branched) | 2.0 (190 C, 2.16 kg) | 18,100 | 1.9 | 8.5 |
| Bimodal Pipe HDPE | 0.25 (190 C, 5.0 kg) | 24,300 | 0.45 | 14.2 |
| Random Copolymer PP | 12.0 (230 C, 2.16 kg) | 28,900 | 42.0 | 4.8 |
The crossover modulus shifts downward as the molecular weight distribution broadens. Narrow metallocene resins pack their relaxation spectrum into a compact time interval, forcing the crossover modulus to elevated values near 60,000 Pascals. Bimodal pipe compounds dilute elastic concentration across a prolonged relaxation tail, dropping the crossover modulus below 25,000 Pascals.
The crossover frequency moves inversely with weight-average molecular weight; longer chains require longer relaxation times, shifting the transition toward low frequencies.

Terminal Flow Deviations
Terminal zone behavior identifies resin lots contaminated with gel particles or ultra-high molecular weight tails. When an unbranched homopolymer melt enters terminal flow, the storage modulus curve drops sharply. A slope significantly lower than 2.0 indicates incomplete relaxation within the experimental cycle time.
This persistent elasticity at low shear rates causes high swell at the die exit during profile extrusion and blow molding.
- Terminal slope depression signals retained entanglements originating from ultra-high molecular fractions or crosslinked gel domains that resist thermal relaxation.
- Premature modulus plateauing indicates physical network formation, inorganic pigment agglomeration, or extensive long-chain branching architectures.
- Crossover frequency suppression reveals higher weight-average chain lengths that demand increased motor torque during compounding and raise melt temperatures.
- Loss tangent inflation reflects elevated viscous dissipation at low deformation speeds, promoting excessive draw resonance during blown film stabilization.
A lower crossover modulus corresponds to wider processing latitude in extrusion tooling.

Architecture
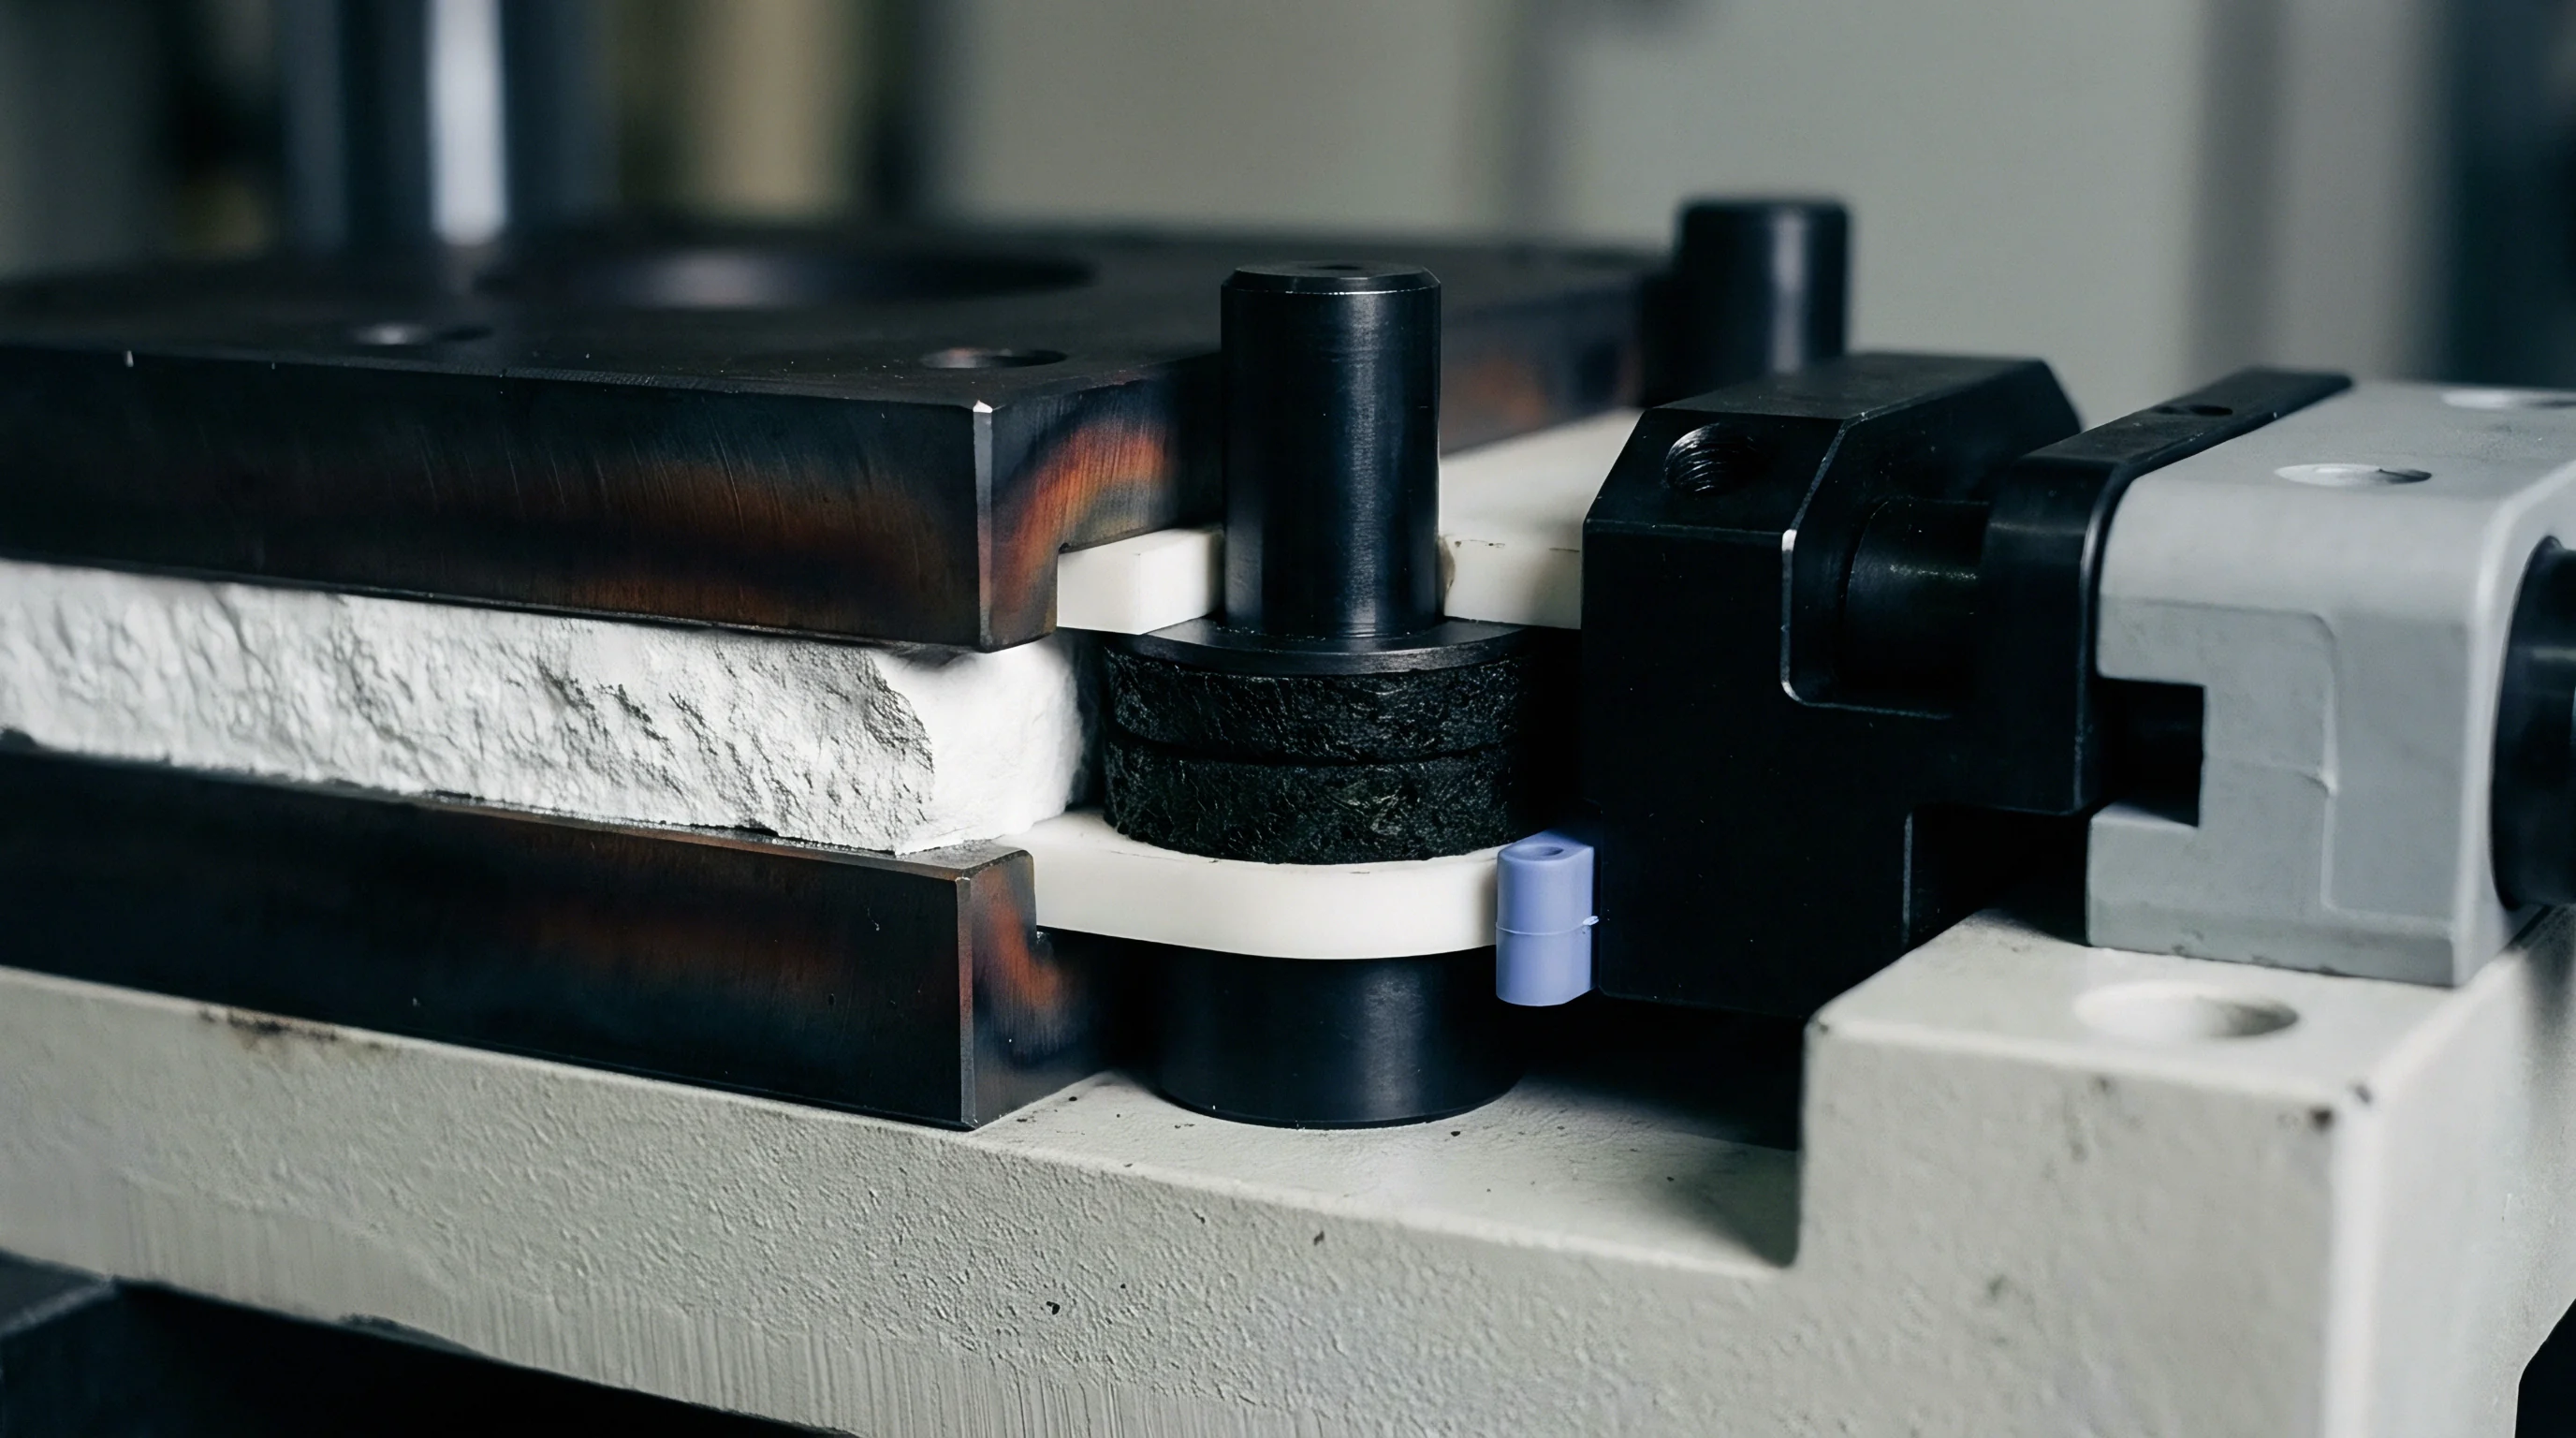
Distinguishing long-chain branching from broad linear polydispersity represents a critical qualification task in film and blow molding grades. Dynamic oscillatory sweeps provide direct input for rheological plots that isolate chain architecture from simple average molecular weight effects. Low-density polyethylene produced in high-pressure autoclaves contains dense treelike branching, whereas linear low-density grades synthesized via metallocene catalysis exhibit linear backbones with short-chain comonomer branches.
Dynamic shear data visualizes these topological contrasts through complex viscosity and phase angle interrelationships.

How Do Linear Viscoelastic Plots Expose Branching?
The van Gurp-Palmen representation plots phase angle directly against complex modulus absolute values. Unbranched linear polyolefins show a continuous decrease in phase angle toward zero as complex modulus rises toward the glassy plateau, reflecting simple relaxation dynamics. Polymers with long-chain branches produce an inflection or local minimum in the phase curve at intermediate modulus values between 1,000 and 100,000 Pascals.
This shoulder stems from the slow relaxation of chain segments trapped between branch points, which cannot relax by simple reptation.
A van Gurp-Palmen plot inflection between 10,000 and 50,000 Pascals identifies long-chain branching independent of molecular weight.
The Cole-Cole plot maps imaginary viscosity against real dynamic viscosity. Linear polyolefins with standard log-normal distributions trace smooth semicircular arcs. Long-chain branched materials display flattened elliptical trajectories or bimodal arcs with distinct high-viscosity tails.
These graphical profiles expose branch frequency differences that remain completely invisible to gel permeation chromatography when branch densities fall below one branch per ten thousand carbon atoms.
| Analysis Method | Plot Coordinates | Diagnostic Signature | Target Structural Feature |
|---|---|---|---|
| Van Gurp-Palmen | Phase Angle vs Complex Modulus | Mid-frequency plateau or dip | Long-chain branch density |
| Cole-Cole Model | Loss Viscosity vs Real Viscosity | Right-side tail elongation | High-relaxation-time components |
| Cox-Merz Rule | Dynamic Viscosity vs Steady Shear | Failure of equivalence at high rates | Structural disruption under shear |
| Carreau-Yasuda Fit | Viscosity vs Frequency | Extended transition zone width | Polydispersity index broadening |
The Cox-Merz empirical rule states that the magnitude of complex viscosity equals steady shear viscosity at identical numerical values of angular frequency and shear rate. Unfilled linear polyethylenes obey this relationship across several decades of deformation rate. Resins containing significant long-chain branching or phase-separated block copolymer domains depart from the Cox-Merz rule at frequencies above 10 radians per second.
The steady shear viscosity drops below dynamic viscosity due to shear-induced alignment and rapid disentanglement of branched structures under continuous deformation.
Quantifying zero-shear viscosity requires fitting low-frequency complex viscosity data to the Carreau-Yasuda model:
Complex viscosity magnitude equals zero-shear viscosity multiplied by the quantity one plus the relaxation time multiplied by angular frequency raised to the power a, with the entire bracket raised to the power n minus one divided by a.
Linear chains obey a power law relationship where zero-shear viscosity scales with weight-average molecular weight to the power 3.4. Resins possessing long-chain branches deviate from this power law, exhibiting zero-shear viscosities several multiples higher than their linear equivalents of identical weight-average molecular weight. Sourcing engineers use this dynamic viscosity divergence to detect unauthorized grade substitutions where broad linear resins are blended to mimic branched extrusion grades.
The extent to which trace levels of hyper-branched structures evade detection in high-throughput dynamic tests remains disputed across testing laboratories.


Degradation
Polyolefins undergo structural alterations when exposed to elevated temperatures during extended oscillatory sweeps. Polypropylene degrades via beta-scission of tertiary carbons along the backbone, reducing molecular weight and dropping dynamic viscosity values over time. Polyethylene undergoes competitive radical recombination, resulting in crosslinking and branch formation that drives storage modulus and low-frequency viscosity upward.
Distinguishing intrinsic material elasticity from test-induced degradation demands rigorous time-sweep verification before running complete frequency sweeps.

Stability Verification Protocols
Isochronal dynamic time sweeps run at 190 or 230 degrees Celsius for 1,800 seconds establish the thermal stability window of the incoming resin lot. The test monitors storage modulus and complex viscosity at a fixed angular frequency of 10 radians per second under nitrogen purge.
- Specimen disk loading occurs rapidly into the preheated rheometer test chamber to minimize atmospheric oxygen contact.
- Gap calibration and trimming proceeds within ninety seconds to prevent excessive thermal exposure of unconfined sample edges.
- Chamber sealing and purging maintains pure nitrogen flow around the fixtures to suppress oxidative radical generation.
- Dynamic monitoring tracks complex viscosity drift, rejecting specimens showing greater than 5 percent variation over the duration of the planned frequency test.
Resins stripped of secondary phosphite antioxidants during compounding show immediate degradation within the first 600 seconds of thermal exposure. The storage modulus shifts downward in polypropylene or upward in polyethylene, skewing the terminal slope calculated during subsequent frequency sweeps. Incoming inspection testing on recycled polyolefins routinely flags antioxidant package depletion through this instability signature.
A complex viscosity drift exceeding 5 percent during an isochronal time sweep invalidates the subsequent frequency sweep data.
The impact of regrind blending appears prominently across low-frequency dynamic data. Post-industrial trim reground multiple times exhibits broadened relaxation distributions alongside depressed crossover moduli. Thermal history accumulates in the resin, generating oxidative crosslinks that elevate elasticity at low strain rates while reducing high-frequency shear-thinning capacity.
Pellet blends containing unannounced post-consumer content present erratic modulus shifts between successive test discs cut from the same incoming box.
Sellers often attribute low-frequency modulus inflation to natural batch variation rather than thermal oxidation during reprocessing.


Settlement
Commercial polyolefin procurement contracts written against single-point melt flow rate specifications expose converting plants to severe process downtime. Blown film lines processing bimodal high-density polyethylene operate at shear rates exceeding 1,000 reciprocal seconds inside extrusion dies, while bubble stability depends entirely on melt strength governed by low-shear elasticity below 0.1 radians per second. Incorporating dynamic oscillatory shear thresholds into purchase agreements bridges the operational gap between laboratory resin testing and factory productivity.
Contractual Rheology Windows
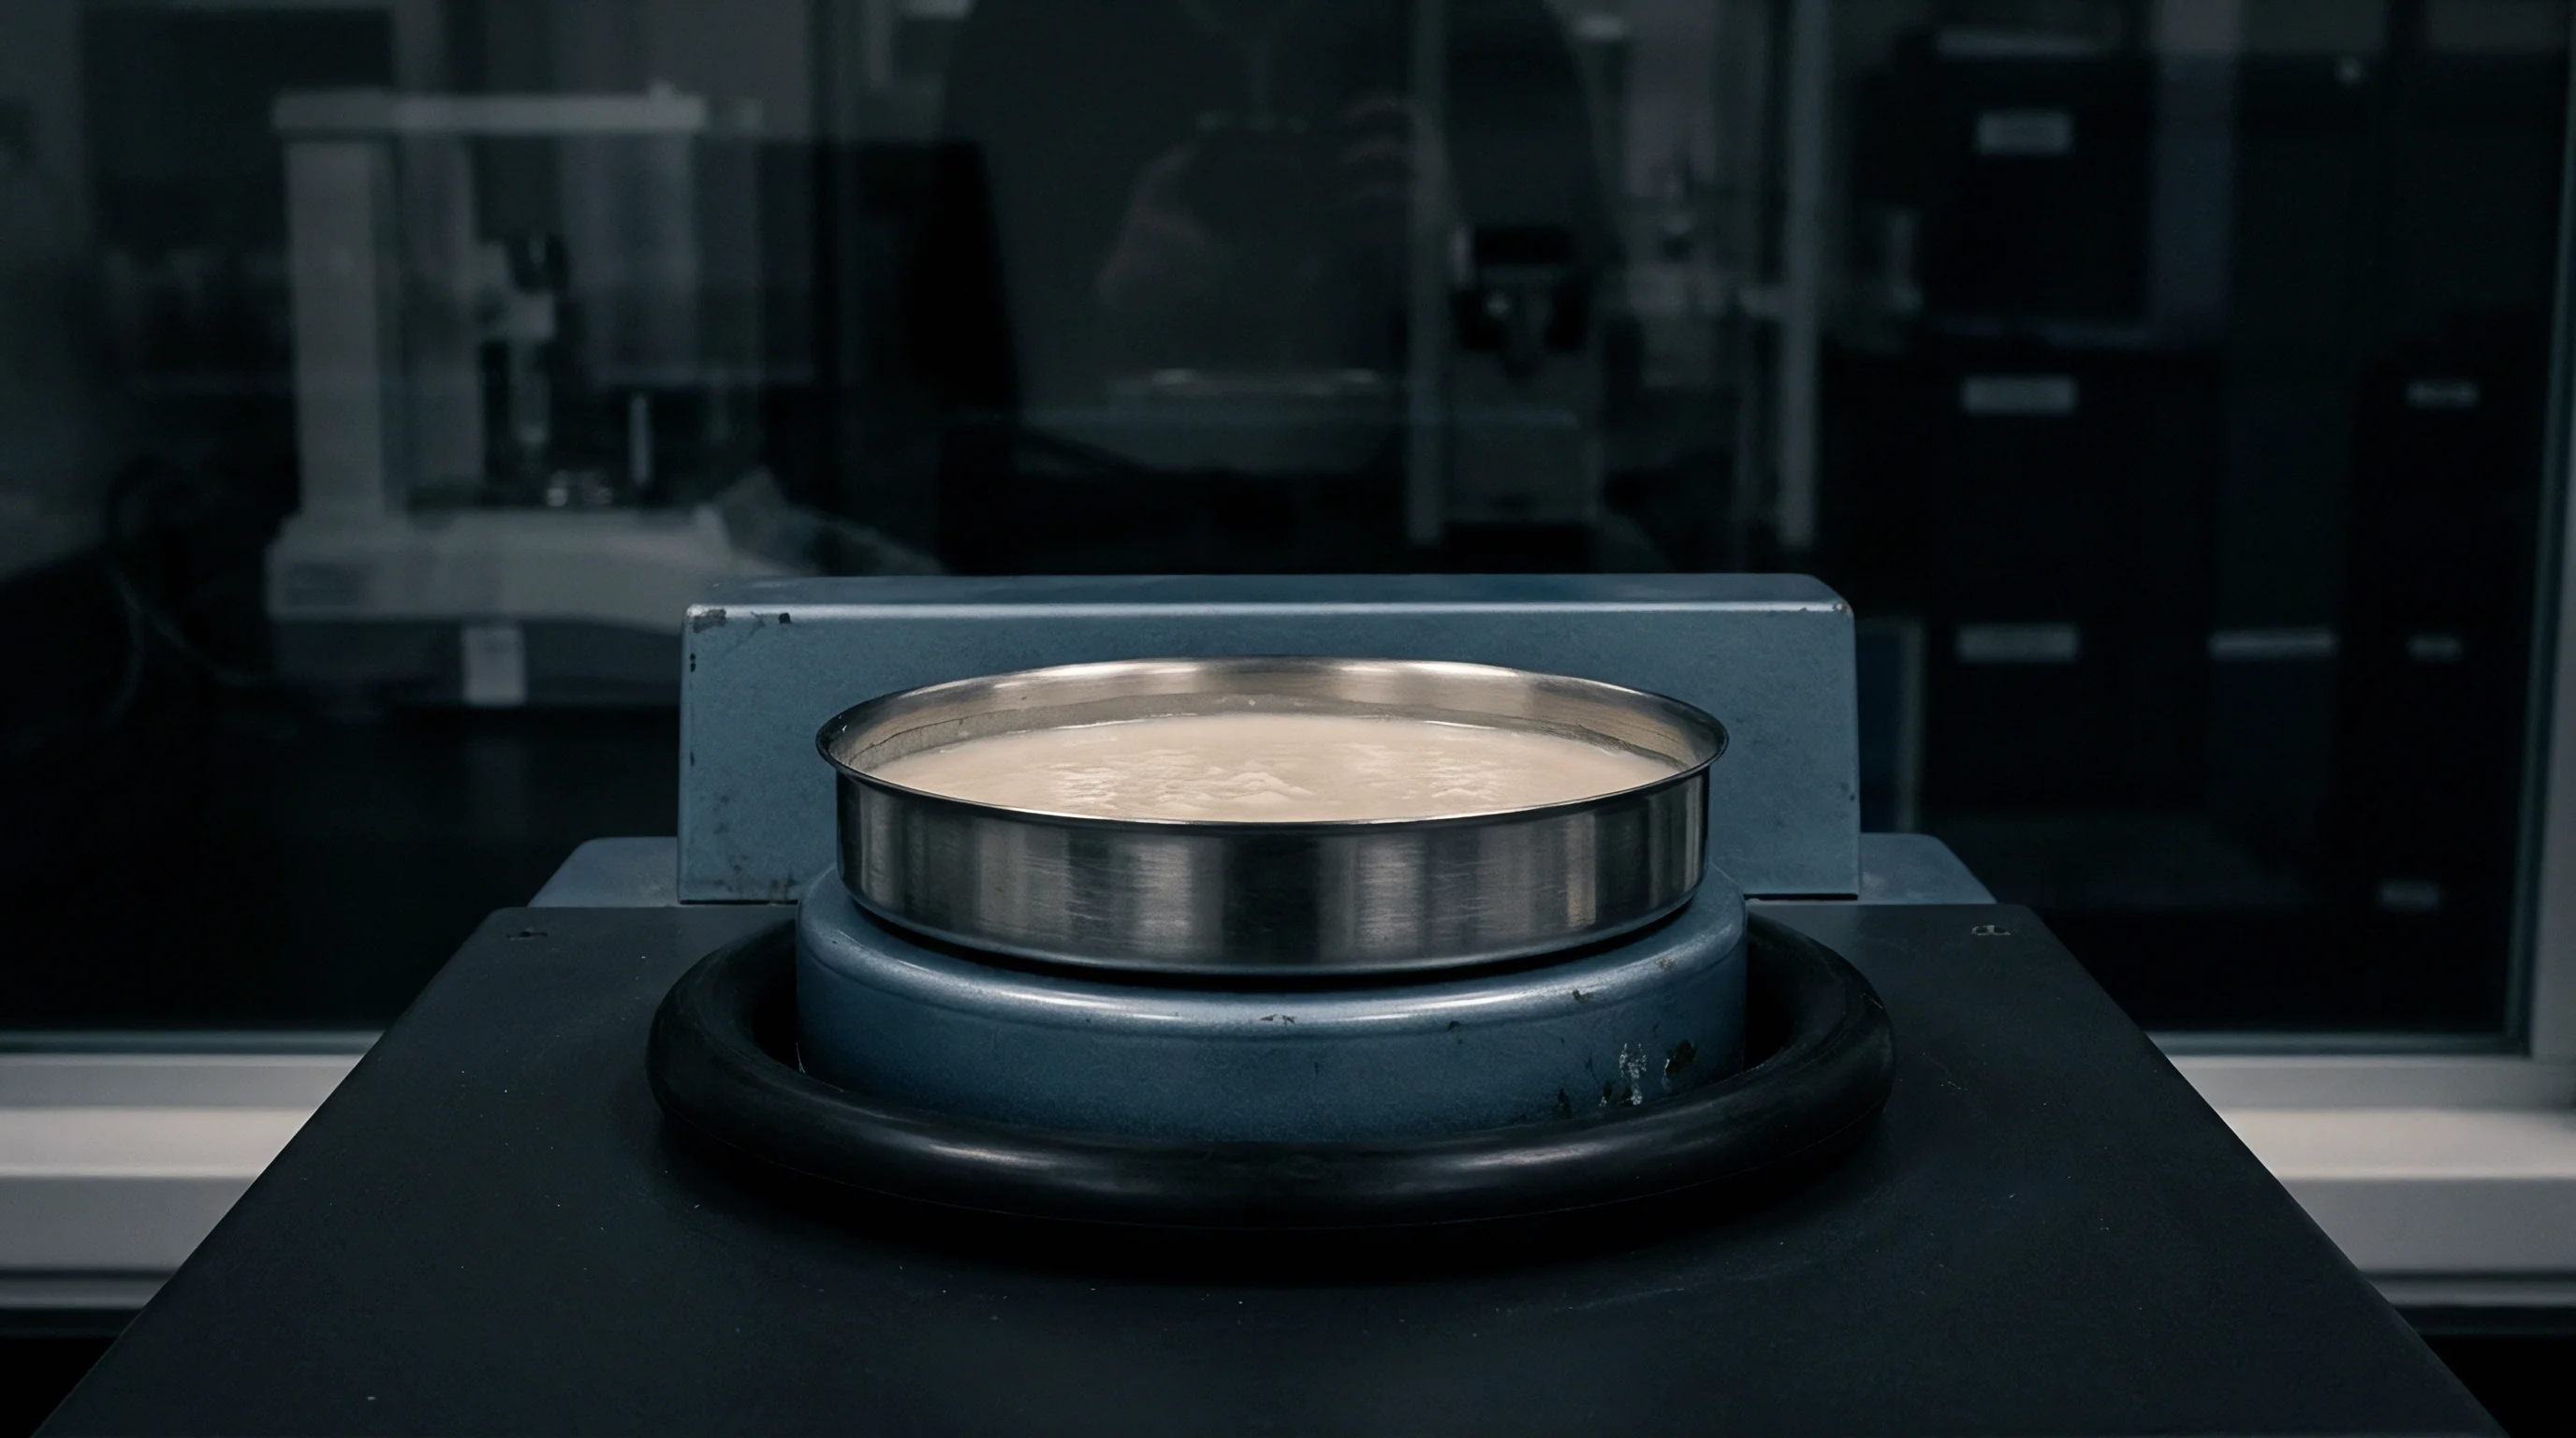
Incoming material specifications define acceptable windows for dynamic crossover coordinates and complex viscosity ratios. A robust receiving protocol fixes three parameters: the crossover modulus range, the crossover frequency boundaries, and the shear-thinning ratio calculated as the complex viscosity at 0.1 radians per second divided by the complex viscosity at 100 radians per second. Lots falling outside these parameters trigger immediate commercial rejection before pellets enter storage silos.
| Test Parameter | Standard Method | Target Range | Action Limit |
|---|---|---|---|
| Complex Viscosity (0.1 rad/s) | ISO 6721-10 | 85,000 to 110,000 Pa s | Reject if below 80,000 Pa s |
| Complex Viscosity (100 rad/s) | ISO 6721-10 | 1,400 to 1,750 Pa s | Hold if above 1,850 Pa s |
| Shear-Thinning Ratio (0.1/100) | ASTM D4440 | 55 to 70 | Reject if below 50 |
| Crossover Modulus | ISO 6721-10 | 22,000 to 26,000 Pa | Reject if above 28,000 Pa |
| Isochronal Viscosity Drift | ISO 6721-10 | Plus or minus 3.5 percent | Reject if drift exceeds 5 percent |
A blown film plant processing fifty tonnes of bimodal high-density polyethylene daily faces catastrophic operational expenses when processing broad-distribution off-spec lots. If a railcar carries resin with an identical nominal melt flow index of 0.05 grams per 10 minutes at 190 degrees Celsius under 2.16 kilograms, but an elevated crossover modulus of 32,000 Pascals, the narrower molecular distribution reduces shear thinning. Head pressure rises by 25 bar at identical screw RPM.
Extruder motor load increases toward thermal limits, forcing line operators to slow output by 12 percent to prevent bubble instability and gauge variation. Across a 100-tonne shipment, that speed reduction adds 16 production hours, translating directly into wasted energy, elevated labor overhead, and missed delivery schedules.
The standard supply agreement specifies that dynamic storage modulus and complex viscosity across the frequency range of 0.1 to 100 radians per second must remain within 8 percent of the qualified master reference curve, shifting all return freight costs and line downtime charges to the resin manufacturer upon verified divergence.