Determining Bimodal Polyethylene High Mass Tail Content via Dynamic Rheology
Dynamic rheology quantifies bimodal polyethylene high mass tail content by tracking zero shear viscosity and low frequency storage modulus at 190 C.

Architecture
Dual-reactor polymerization generates distinct molecular weight distributions by running separate reaction zones in series. The resulting high-density polyethylene blends a low molecular weight matrix with an ultra-high molecular weight tail at the molecular scale. Processing relies on that low-mass fraction for melt fluidity, while chains exceeding one million grams per mole provide the toughness, environmental stress crack resistance, and long-term hydrostatic strength demanded in pressure pipe applications.

Melt Dynamics in Dual Reactor Syntheses
Cascaded slurry loops run under different hydrogen concentrations to generate chains spanning four orders of magnitude in length. In the first reactor, elevated hydrogen transfer rates with Ziegler-Natta or metallocene catalysts build short, highly crystalline chains. Once the slurry enters the second reactor, depleted hydrogen and comonomer feed drive the growth of broad, high-mass chains that entangle through the matrix.
Even minor hydrogen fluctuations in the secondary loop shift the proportion and average molecular weight of this tail. Dropping that high-mass fraction impairs slow crack growth resistance, yet standard low-shear melt index tests barely register the change.

Chromatography Limits at Elevated Molecular Weights
Passing polymer solutions through porous packing beds at high temperatures subjects long macromolecular chains to severe shear. At one hundred sixty degrees Celsius in trichlorobenzene, gel permeation chromatography causes thermal degradation and chain scission once molecular weights pass two million grams per mole. Band broadening across the columns also obscures low-concentration high-mass tails, making quantitative integration unreliable below a two percent mass fraction.
Dynamic oscillatory shear rheology detects these extended relaxation networks directly from the melt’s bulk elastic response under low-deformation oscillatory strain, where high mass tails pull phase angles downward. Because long polymer chains take substantial time to disentangle, they dominate the terminal relaxation regime at ultra-low angular frequencies.
In bimodal polyethylene melts, a five percent change in high-mass tail content alters zero-shear viscosity by more than forty percent while melt flow index remains unchanged.
Analytical chemistry laboratories still debate whether solution fractionation paired with infrared detection can match the turnaround and sensitivity of low-frequency dynamic shear testing for tail quantification.


Platen
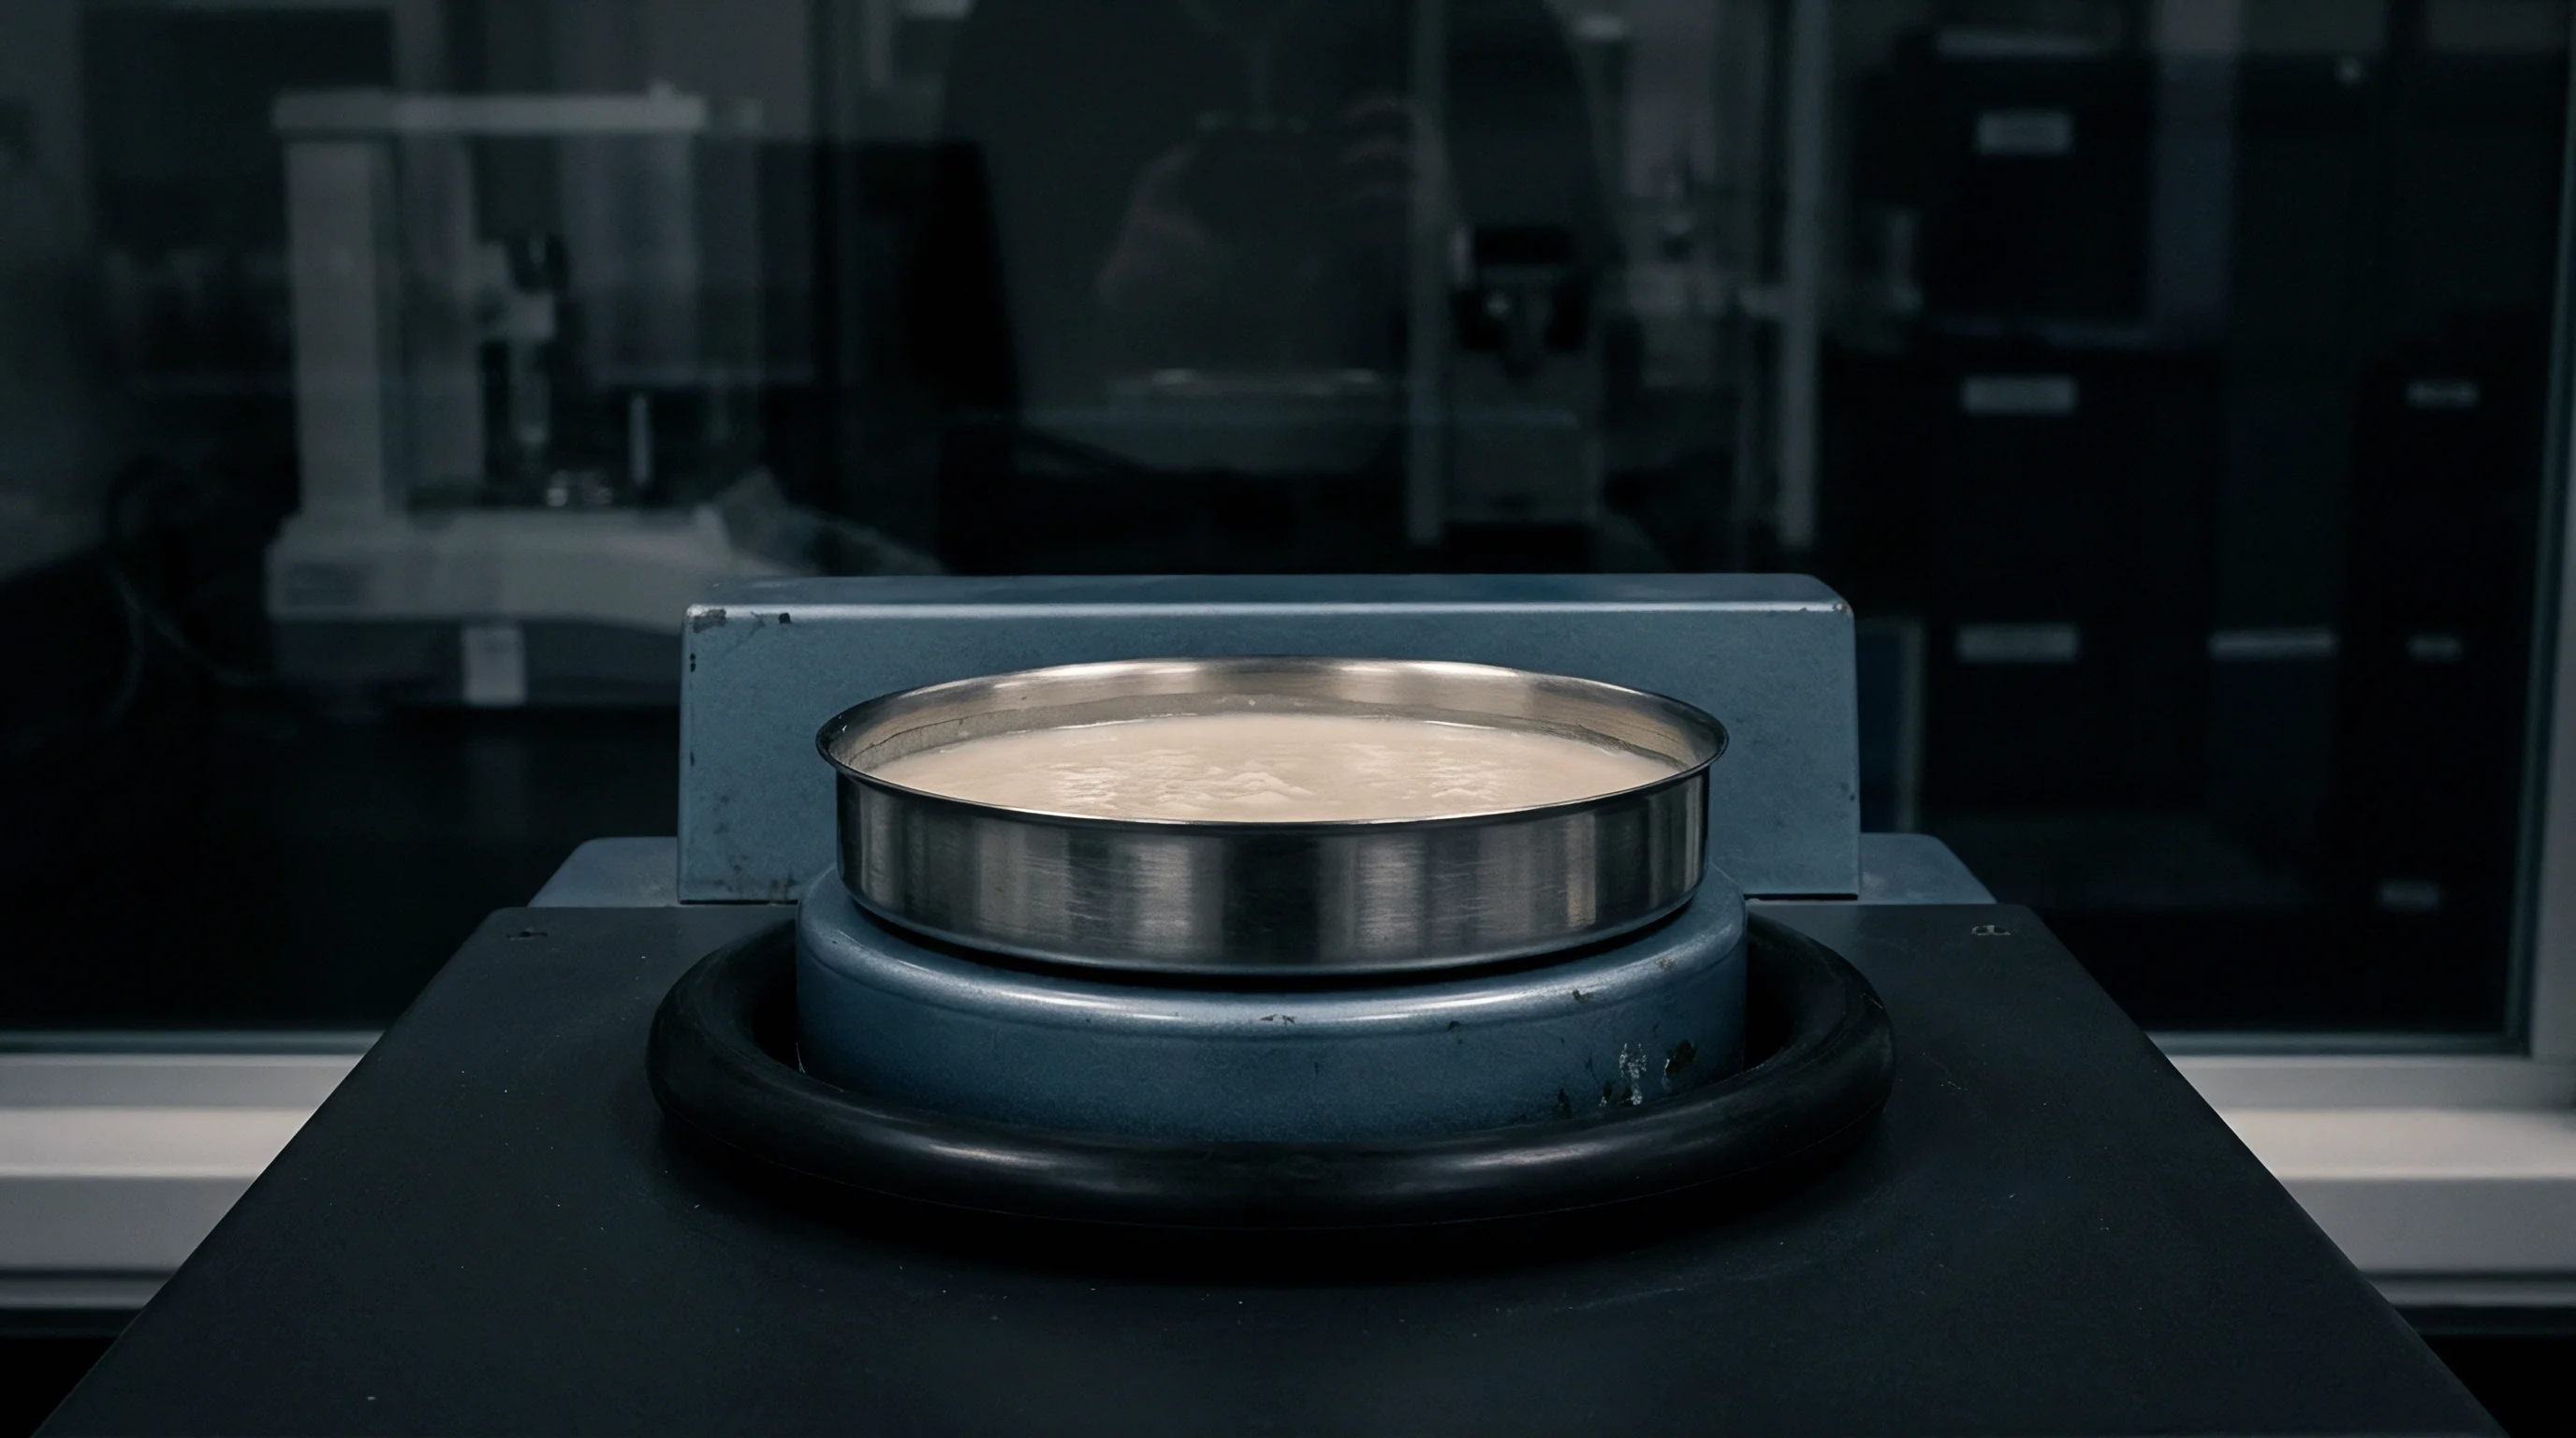
Parallel disk setups generate uniform shear across molten polymer discs held inside isothermal test chambers. Probing long relaxation times requires tight temperature stability and exact geometry alignment; otherwise, instrument artifacts creep into the dynamic oscillatory shear data.

Parallel Plate Test Parameters
Sample disks pressed to a twenty-five millimeter diameter mount into rotational rheometers for dynamic testing with a plate gap set to exactly one millimeter. That narrow gap maintains a homogeneous shear field and limits edge-trim distortion. Testing at one hundred ninety degrees Celsius aligns with standard reference conditions in ISO 1133 and ASTM D1238, allowing direct comparison with historical material databases.
| Parameter | Standard Setting | Operational Limit | Target Rheological Output |
|---|---|---|---|
| Geometry Type | 25 mm Parallel Plate | 50 mm for ultra-low torque | Phase Angle, Complex Viscosity |
| Gap Height | 1.00 mm | 1.05 mm max after thermal expand | Uniform Shear Strain Field |
| Strain Amplitude | 1% to 5% | Must remain inside LVR | Linear Viscoelastic Moduli |
| Frequency Sweep Range | 0.01 to 500 rad/s | 0.001 rad/s for UHMW tails | Zero-Shear Viscosity, Crossover Point |
| Purge Environment | Ultra-High Purity Nitrogen | Oxygen under 5 ppm | Prevention of Thermal Scission |
Thermal Degradation Controls during Sweeps
Molten high-density polyethylene begins scissioning or crosslinking when exposed to trace oxygen above one hundred eighty degrees Celsius. Maintaining an active nitrogen blanket at six liters per minute keeps atmospheric oxygen out of the test chamber throughout the run.
Thermal stability is verified through a thirty-minute time sweep at zero point zero one radians per second. If complex viscosity drifts by more than three percent during the test, sample degradation has occurred and the subsequent frequency sweep data cannot be used.
Linear Viscoelastic Strain Determination
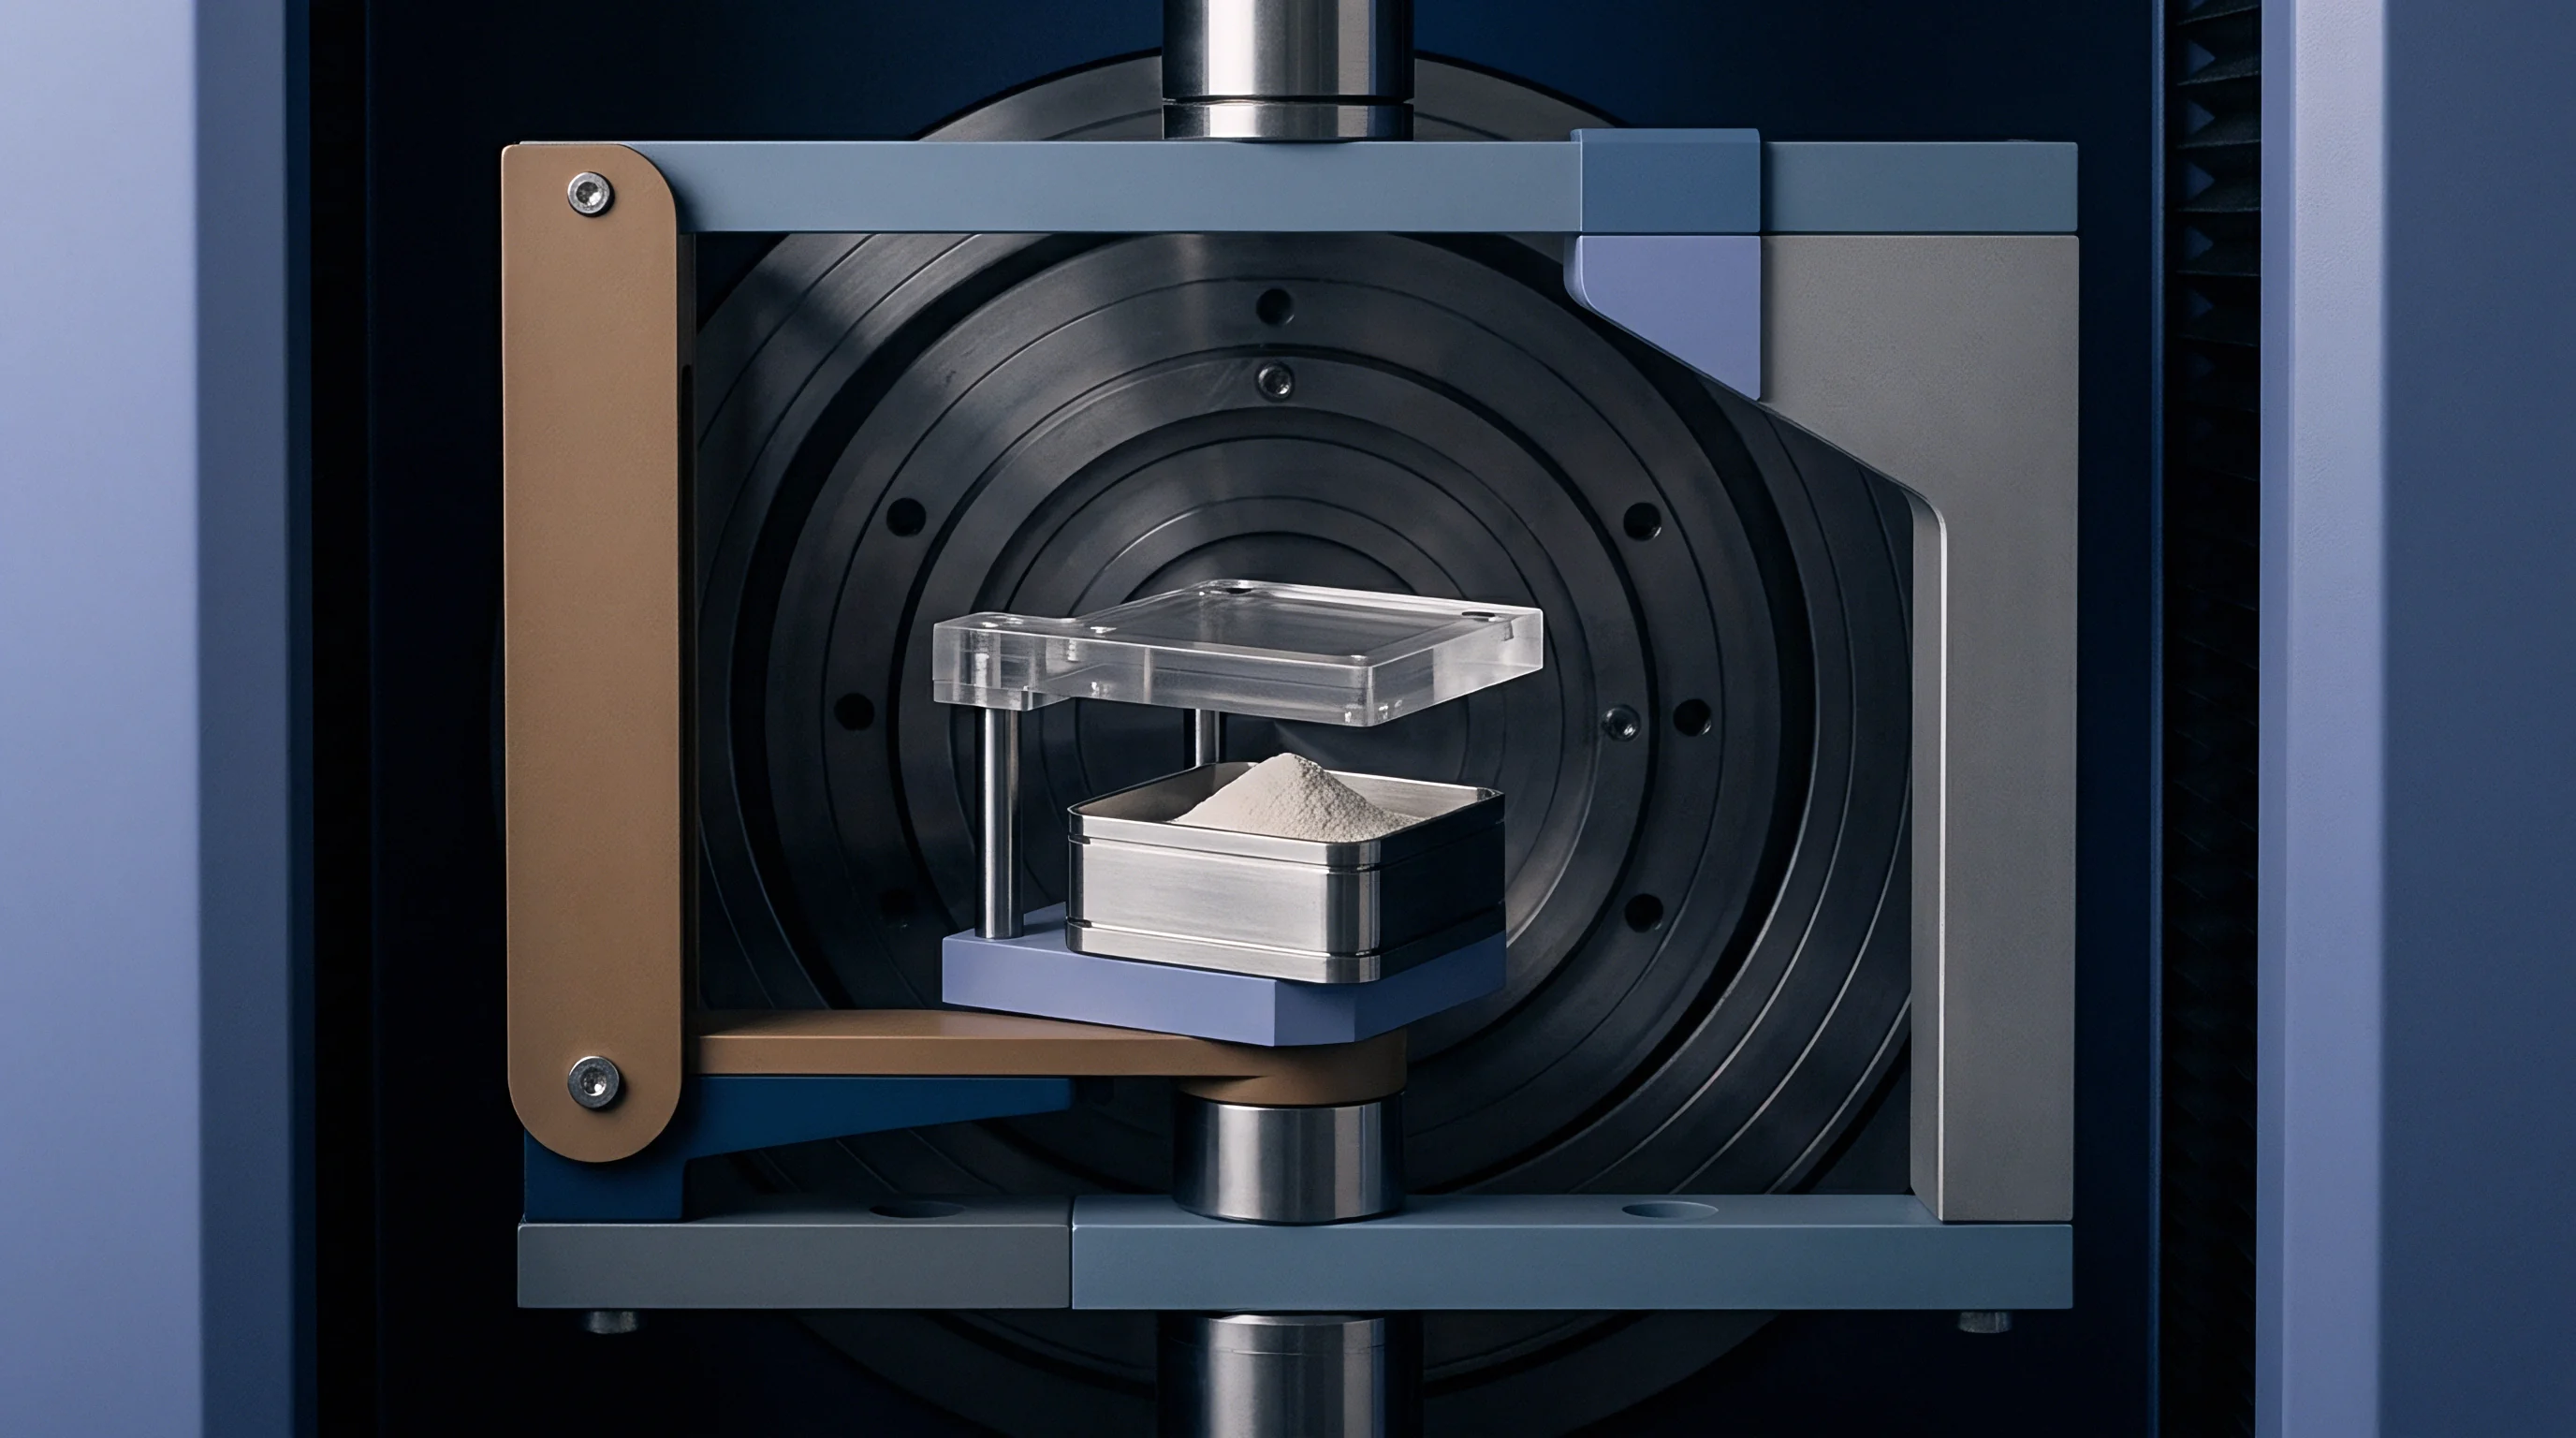
Oscillatory amplitude sweeps establish the torque window where storage and loss moduli stay independent of applied deformation. Dense entanglements force high-mass chains into non-linear behavior at much lower strain amplitudes than the matrix resin. Setting strain amplitude between one percent and three percent keeps the sample within the linear viscoelastic region across the full frequency sweep while preserving adequate signal-to-noise at the lowest frequencies.
- Edge fracture instability occurs when primary normal stress differences rupture the sample meniscus at frequencies above one hundred radians per second.
- Thermal oxidative degradation develops when nitrogen purge flow drops below five liters per minute, triggering rapid chain scission and a falling loss modulus.
- Transducer overload torque occurs during low-temperature sweeps when sample stiffness exceeds the torque limit of the air-bearing motor.
- Interfacial wall slip compromises shear rate calculations whenever polished plate surfaces lose traction against high-viscosity melts.
A steady torque response across low-frequency oscillatory sweeps confirms that the sample has remained thermally stable throughout the run.


Swell
Elastic recovery at the die exit reflects energy stored within the longest polymer chains. Dynamic rheology translates this bulk elasticity into structural parameters by transforming frequency-dependent modulus curves.

Cole Cole and Van Gurp Palmen Transformations
Plotting the imaginary component against the real component of dynamic viscosity in Cole-Cole coordinates highlights slow relaxation modes without empirical curve-fitting. Where unimodal resins trace a clean, single semicircular arc, bimodal grades with ultra-high molecular weight tails turn upward or develop secondary arcs at elevated real viscosities, marking out extended relaxation processes.
Van Gurp-Palmen plots display phase angle against the magnitude of the complex modulus. A steep decline in phase angle at low modulus values correlates directly with higher high-mass tail volume, and the minimum phase angle reached in that low-modulus region provides an empirical measure of tail concentration.
| Tail Concentration (%) | Crossover Modulus (Pa) | Crossover Frequency (rad/s) | Zero-Shear Viscosity (Pa s) | Min Phase Angle (deg) |
|---|---|---|---|---|
| 0.0 (Unimodal Baseline) | 28,500 | 45.2 | 82,000 | 58.4 |
| 0.5 (Standard Pipe) | 19,200 | 18.6 | 210,000 | 46.1 |
| 1.2 (High ESCR Grade) | 12,400 | 6.1 | 580,000 | 38.2 |
| 2.5 (UHMW Tail Blend) | 7,100 | 1.2 | 1,850,000 | 29.5 |

Crossover Modulus Shifts and Relaxation Spectra
Where storage and loss curves intersect provides a direct indicator of polydispersity breadth. The crossover modulus ~ where storage modulus equals loss modulus ~ drops lower as polydispersity broadens. At the same time, crossover frequency moves toward lower values as high-mass tail content rises, reflecting the extra time required for long chains to disentangle.
Discrete relaxation spectrum calculations convert frequency sweep data into distribution functions of relaxation intensity against time constants, where zero-shear viscosity scales directly with chain mass. High-mass tails introduce a distinct relaxation peak at time constants beyond one hundred seconds, clearly separated from the primary matrix relaxation peak below one second.
Van Gurp-Palmen inflection points below a phase angle of forty degrees confirm the presence of ultra-high molecular weight fractions exceeding one million grams per mole.
Misinterpreting these rheological shifts leads directly to incorrect extruder temperature profiles, motor overload, and scrap during pipe extrusion runs.


Lot
Standard certificates of analysis for incoming bulk resin report only melt flow rate and density. Receiving plants handling bimodal high-density polyethylene need rapid testing that isolates variations in the high-mass tail before railcars discharge into storage silos.

Is Low Frequency Storage Modulus Sufficient for Incoming Lot Release?
Measuring elastic response at zero point zero one radians per second captures shifts in crossover frequency and tail fraction that high-load melt index tests miss. A single-point storage modulus check takes fifteen minutes, making it practical for screening incoming railcars. A drop in storage modulus beyond ten percent of nominal specification at zero point zero one radians per second indicates high-mass tail depletion and points to degraded environmental stress crack resistance.
When initial screening flags off-spec resin, running a full frequency sweep from zero point zero one to five hundred radians per second provides the data required for a complete molecular weight distribution reconstruction.
Capturing lot variance across deep railcar compartments requires a standardized sampling routine before resin is cleared for unloading.
- Draw ten primary core samples across upper, middle, and lower discharge ports of each railcar compartment with a stainless vacuum sampling tube.
- Blend equal portions of each sub-sample and vacuum-dry the composite lot at eighty degrees Celsius for four hours to strip surface moisture.
- Compression mold test disks to twenty-five millimeter diameter and one millimeter thickness at one hundred ninety degrees Celsius under ten megapascals for five minutes.
- Load the molded disk between rheometer platens preheated to one hundred ninety degrees Celsius, trimming squeeze-out flush with the tool edge.
- Run a single-point test at zero point zero one radians per second under nitrogen purge and record the storage modulus.
Standard ISO 1133 melt flow testing fails to differentiate between unimodal broadenings and true bimodal high-mass tail extensions.

Sampling Matrices for Silo and Container Delivery
Thief sampling across individual railcar compartments prevents off-spec resin from contaminating central silos. Pellet segregation or moisture picked up during pneumatic transfer creates voids during compression molding, corrupting low-frequency torque readings; repeatable modulus values require void-free test disks.
Low-frequency elasticity shifts are often dismissed as normal catalyst batch variation within published melt index limits, even when they stem from significant changes in high-mass tail content.


Defect
Downstream processing quickly destabilizes when high-mass tail concentrations drift outside target limits. Pipe extrusion, blow molding, and film lines all rely on tight elasticity tolerances to hold dimensional stability through cooling.

Extrusion Instabilities and Melt Fracture
Extruded profiles develop surface roughness when wall shear stress crosses threshold levels dictated by molecular weight tailing. Long chains elevate die entrance pressure drops, triggering melt fracture at lower production rates. When uncrosslinked ultra-high molecular weight agglomerates pass through single-screw extruders without homogenizing, they leave clear optical defects and weak spots in thin films.
| Processing Operation | Rheological Root Cause | Physical Failure Mode | Commercial Consequence |
|---|---|---|---|
| Pressure Pipe Extrusion | Deficient High-Mass Tail | Wall Sagging, Failed SCGR Test | Burst Pipe Field Claims |
| Large Blow Molding | Excessive High-Mass Tail | Parison Swell Overload, Melt Fracture | Tool Jamming, High Scrap Rate |
| Blown Film | Unmelted UHMW Agglomerates | Gel Inclusions, Bubble Instability | Film Punctures, Optical Failure |
| Geomembrane Extrusion | Broad Polydispersity Tail | Die Lip Buildup, Line Drag Marks | Unscheduled Die Clean Downtime |

Parison Sagging and Wall Thickness Distribution
Large blow-molded parts suffer from localized thinning when gravity stretches molten preforms hanging inside hot tool cavities. Maintaining an adequate high-mass tail elevates zero-shear viscosity, resisting gravitational sag over long parison drop times as viscosity curves plateau at ultra-low frequencies.
Once high-mass tail concentration drops below critical limits, zero-shear viscosity collapses, allowing the upper parison walls to overstretch before the mold clamps shut.
- Extrudate surface sharkskin indicates localized shear stress spikes at the die exit, resolved by increasing melt temperature or adding minor levels of processing aid.
- Internal melt fracture points to severe elastic failure upstream of the die land, requiring lower line speed or a reduction in high-mass tail concentration.
- Excessive parison drawdown reflects insufficient zero-shear viscosity, necessitating a switch to resin with higher ultra-high-molecular-weight content.
- Unmelted gel inclusions stem from uncrosslinked high-mass agglomerates, requiring tighter screen pack meshes or reworked screw mixing elements.
Writing explicit minimum storage modulus limits into section four of resin purchase specifications gives receiving plants clear contractual grounds to reject off-spec railcars before unloading.


Freight
Purchase agreements for bimodal polyethylene reflect the synthesis overhead of running dual-catalyst systems. Premium pipe and blow molding grades command substantial premiums over unimodal commodities because reactor output drops when polymerizing high-mass tails.

Commercial Sourcing and Grade Premium Structure
Resin buyers pay a premium for bimodal grades because multi-reactor processes sacrifice volume throughput, with spot pricing tied closely to order quantity. Procurement decisions must weigh total landed cost per finished part against raw resin price per metric tonne; off-spec material lacking sufficient tail fraction drives up scrap from wall variation and quickly wipes out initial pellet discounts.
| Resin Parameter Metric | Prime Bimodal Grade | Sub-Standard Tail Lot | Commercial Impact |
|---|---|---|---|
| Pellet Invoice Price ($/tonne) | $1,650 | $1,480 | $170 initial pellet savings |
| Extrusion Line Speed (m/min) | 2.4 | 1.8 | 25% throughput loss |
| Extrusion Scrap Rate (%) | 1.5% | 8.2% | 6.7% material waste increase |
| Slow Crack Growth Pass Rate | 100% | 62% | High field failure risk |
| Effective Part Cost ($/m) | $12.40 | $14.85 | $2.45 net loss per meter |

Specification Limits on Polydispersity Metrics
Purchase orders for critical applications define target windows for dynamic elastic properties rather than relying on generic trade names. Specifications based solely on melt flow rate let suppliers deliver inferior broad-unimodal grades; setting explicit bounds on low-frequency storage modulus preserves finished part performance.
Procurement contracts specifying storage modulus tolerances of plus or minus seven percent eliminate downstream pipe burst warranty claims.
Optimizing landed manufacturing cost requires tracking rheological properties against resin price indexes to balance raw material expense against factory yield.