Toolroom Blueing and Optical Profilometry for Injection Mold Wear Verification
Optical profilometry replaces qualitative blueing paste with three-dimensional volume loss metrics, enabling precise mold wear tracking and flash prevention.

Contact
Parting line seals depend on direct contact between hardened tool steel surfaces, as clamping force drives the cavity faces together under hydraulic or electric pressure. Toolroom blueing remains the traditional way to check this contact across complex mould shapes. A thin layer of non-drying pigment is brushed across the shut-off lands; when the halves close under load, displaced ink shows where the surfaces actually touch.
High-tonnage injection presses flex mould plates during clamping, especially across multi-cavity layouts. Blueing paste applied on the bench gives a static view of the shut-off before dynamic injection loads hit the frame. Toolmakers and press operators use layout blue or non-drying Prussian blue to catch tiny gaps, misaligned core pins, or uneven crushing that could let melt bleed into vents and create flash.
Shut-Off Mating and Transfer Chemistry
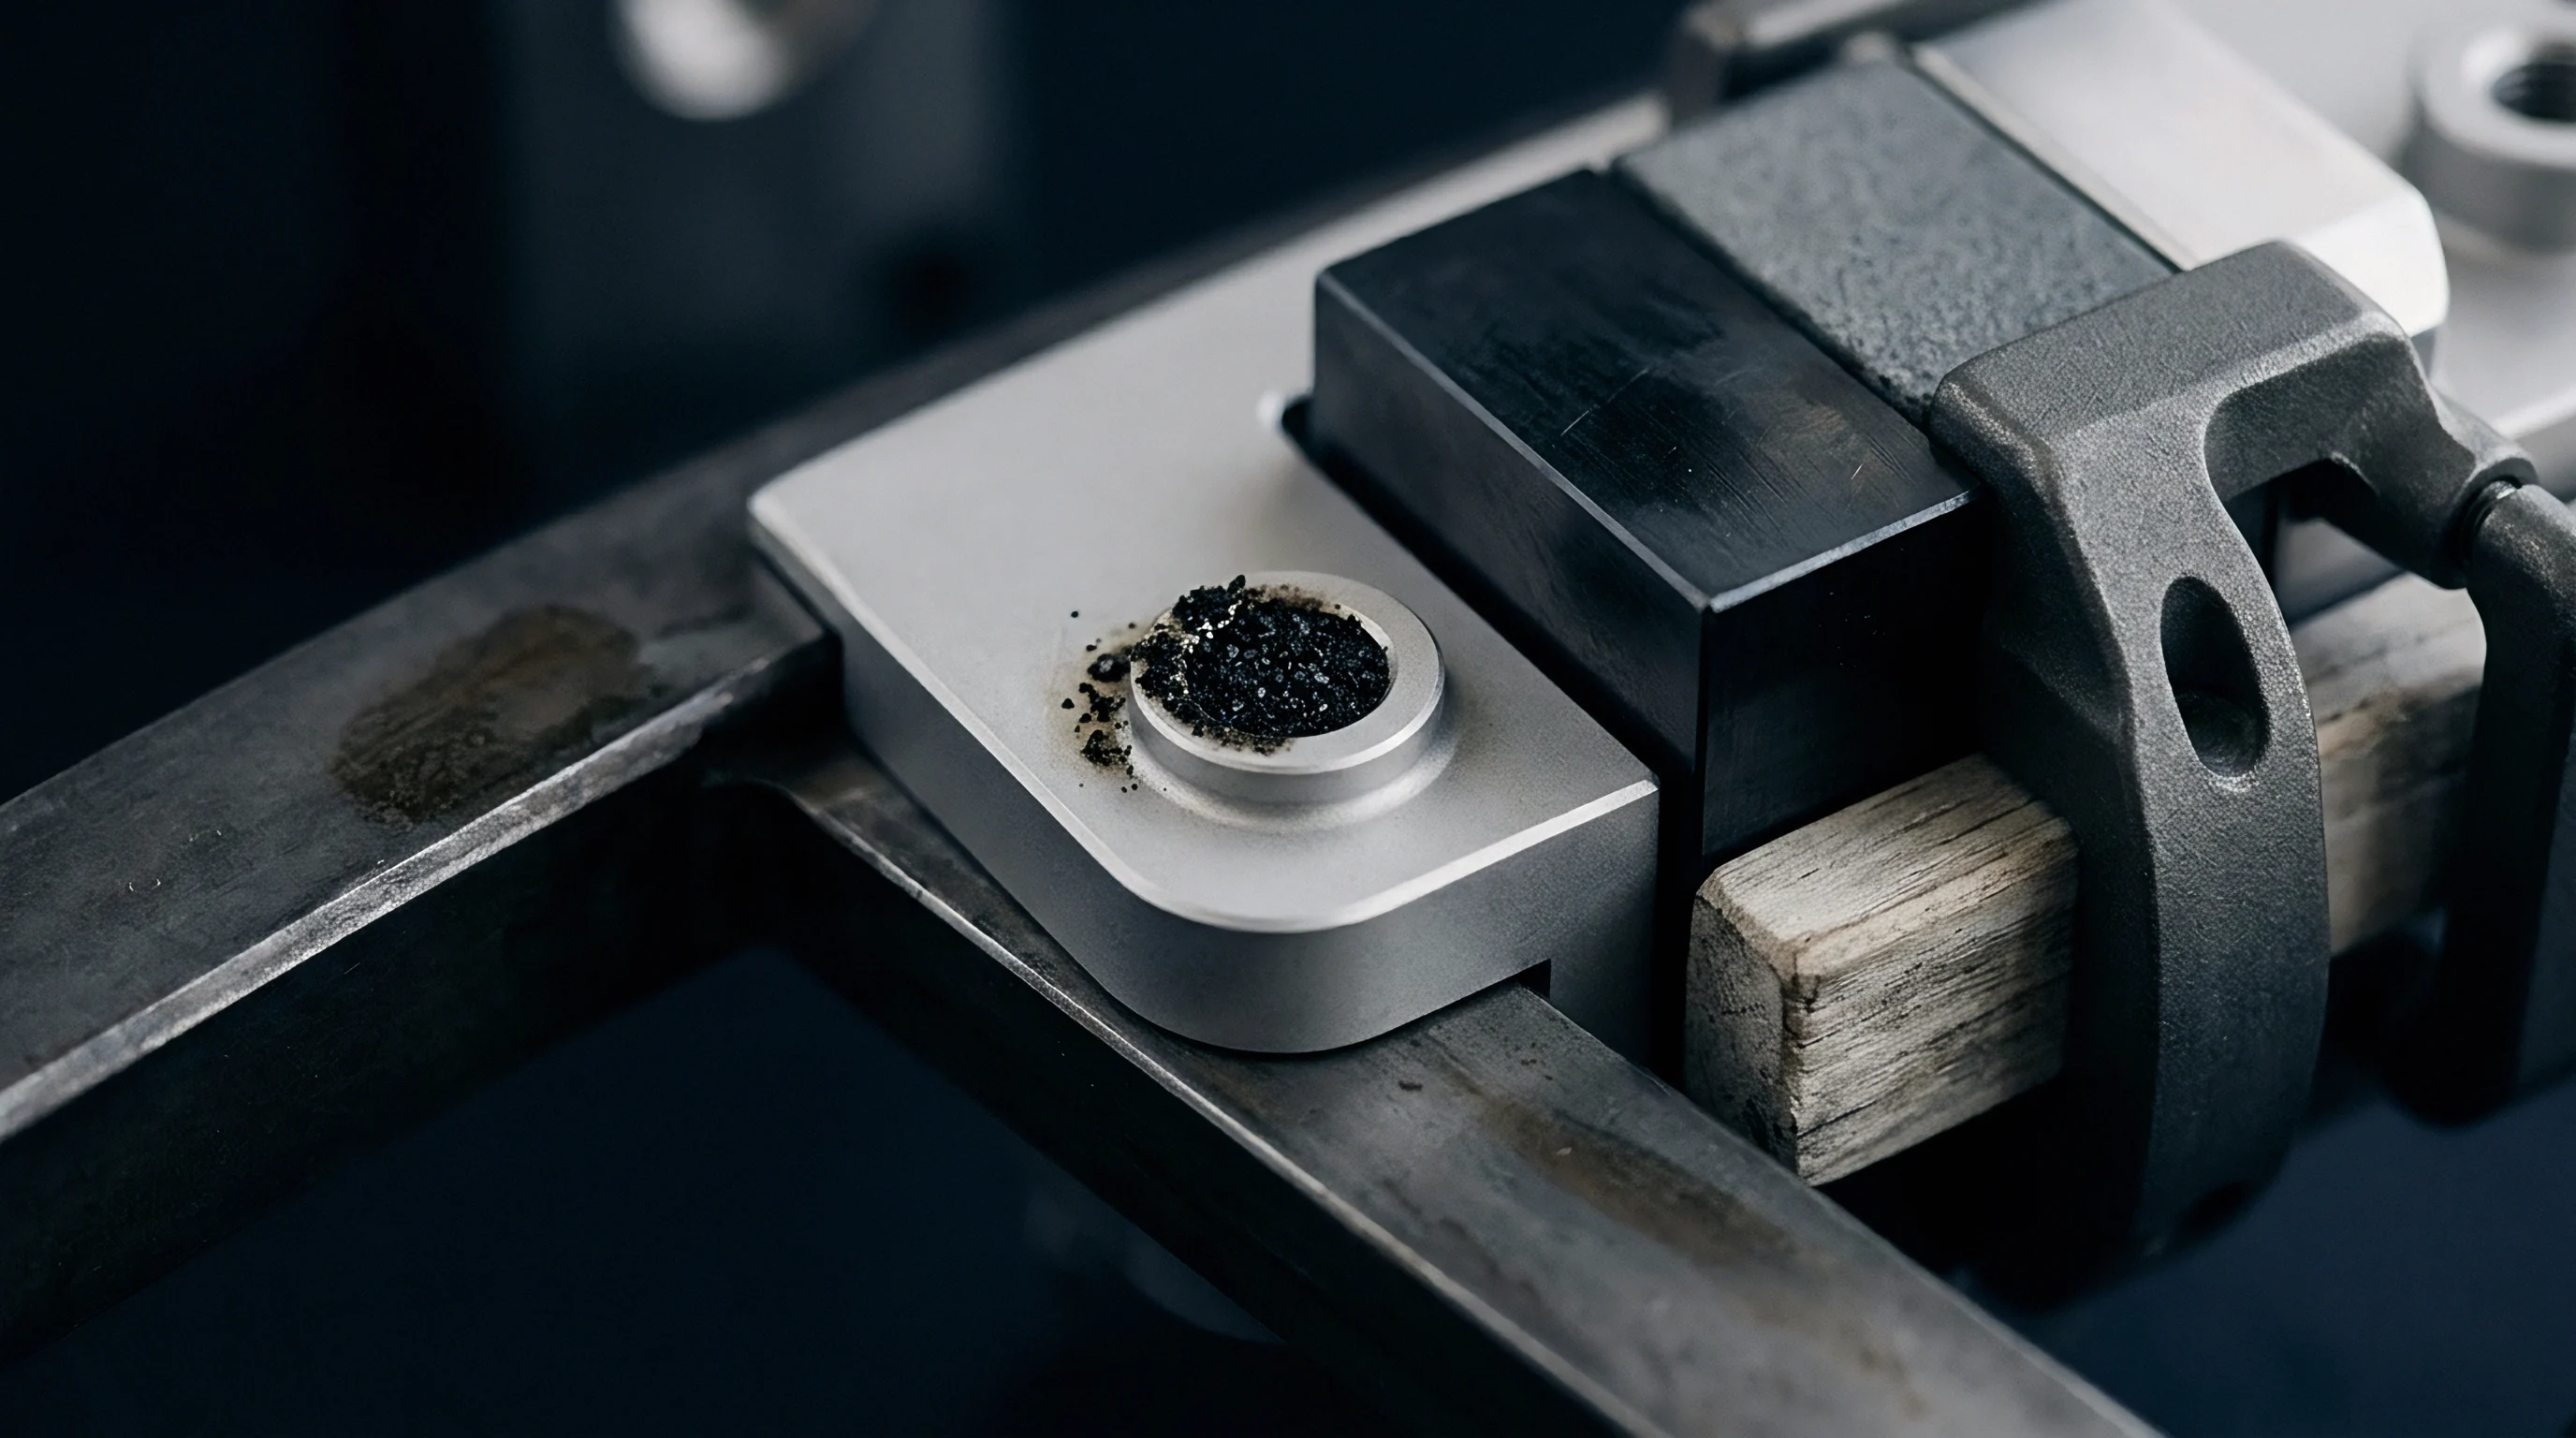
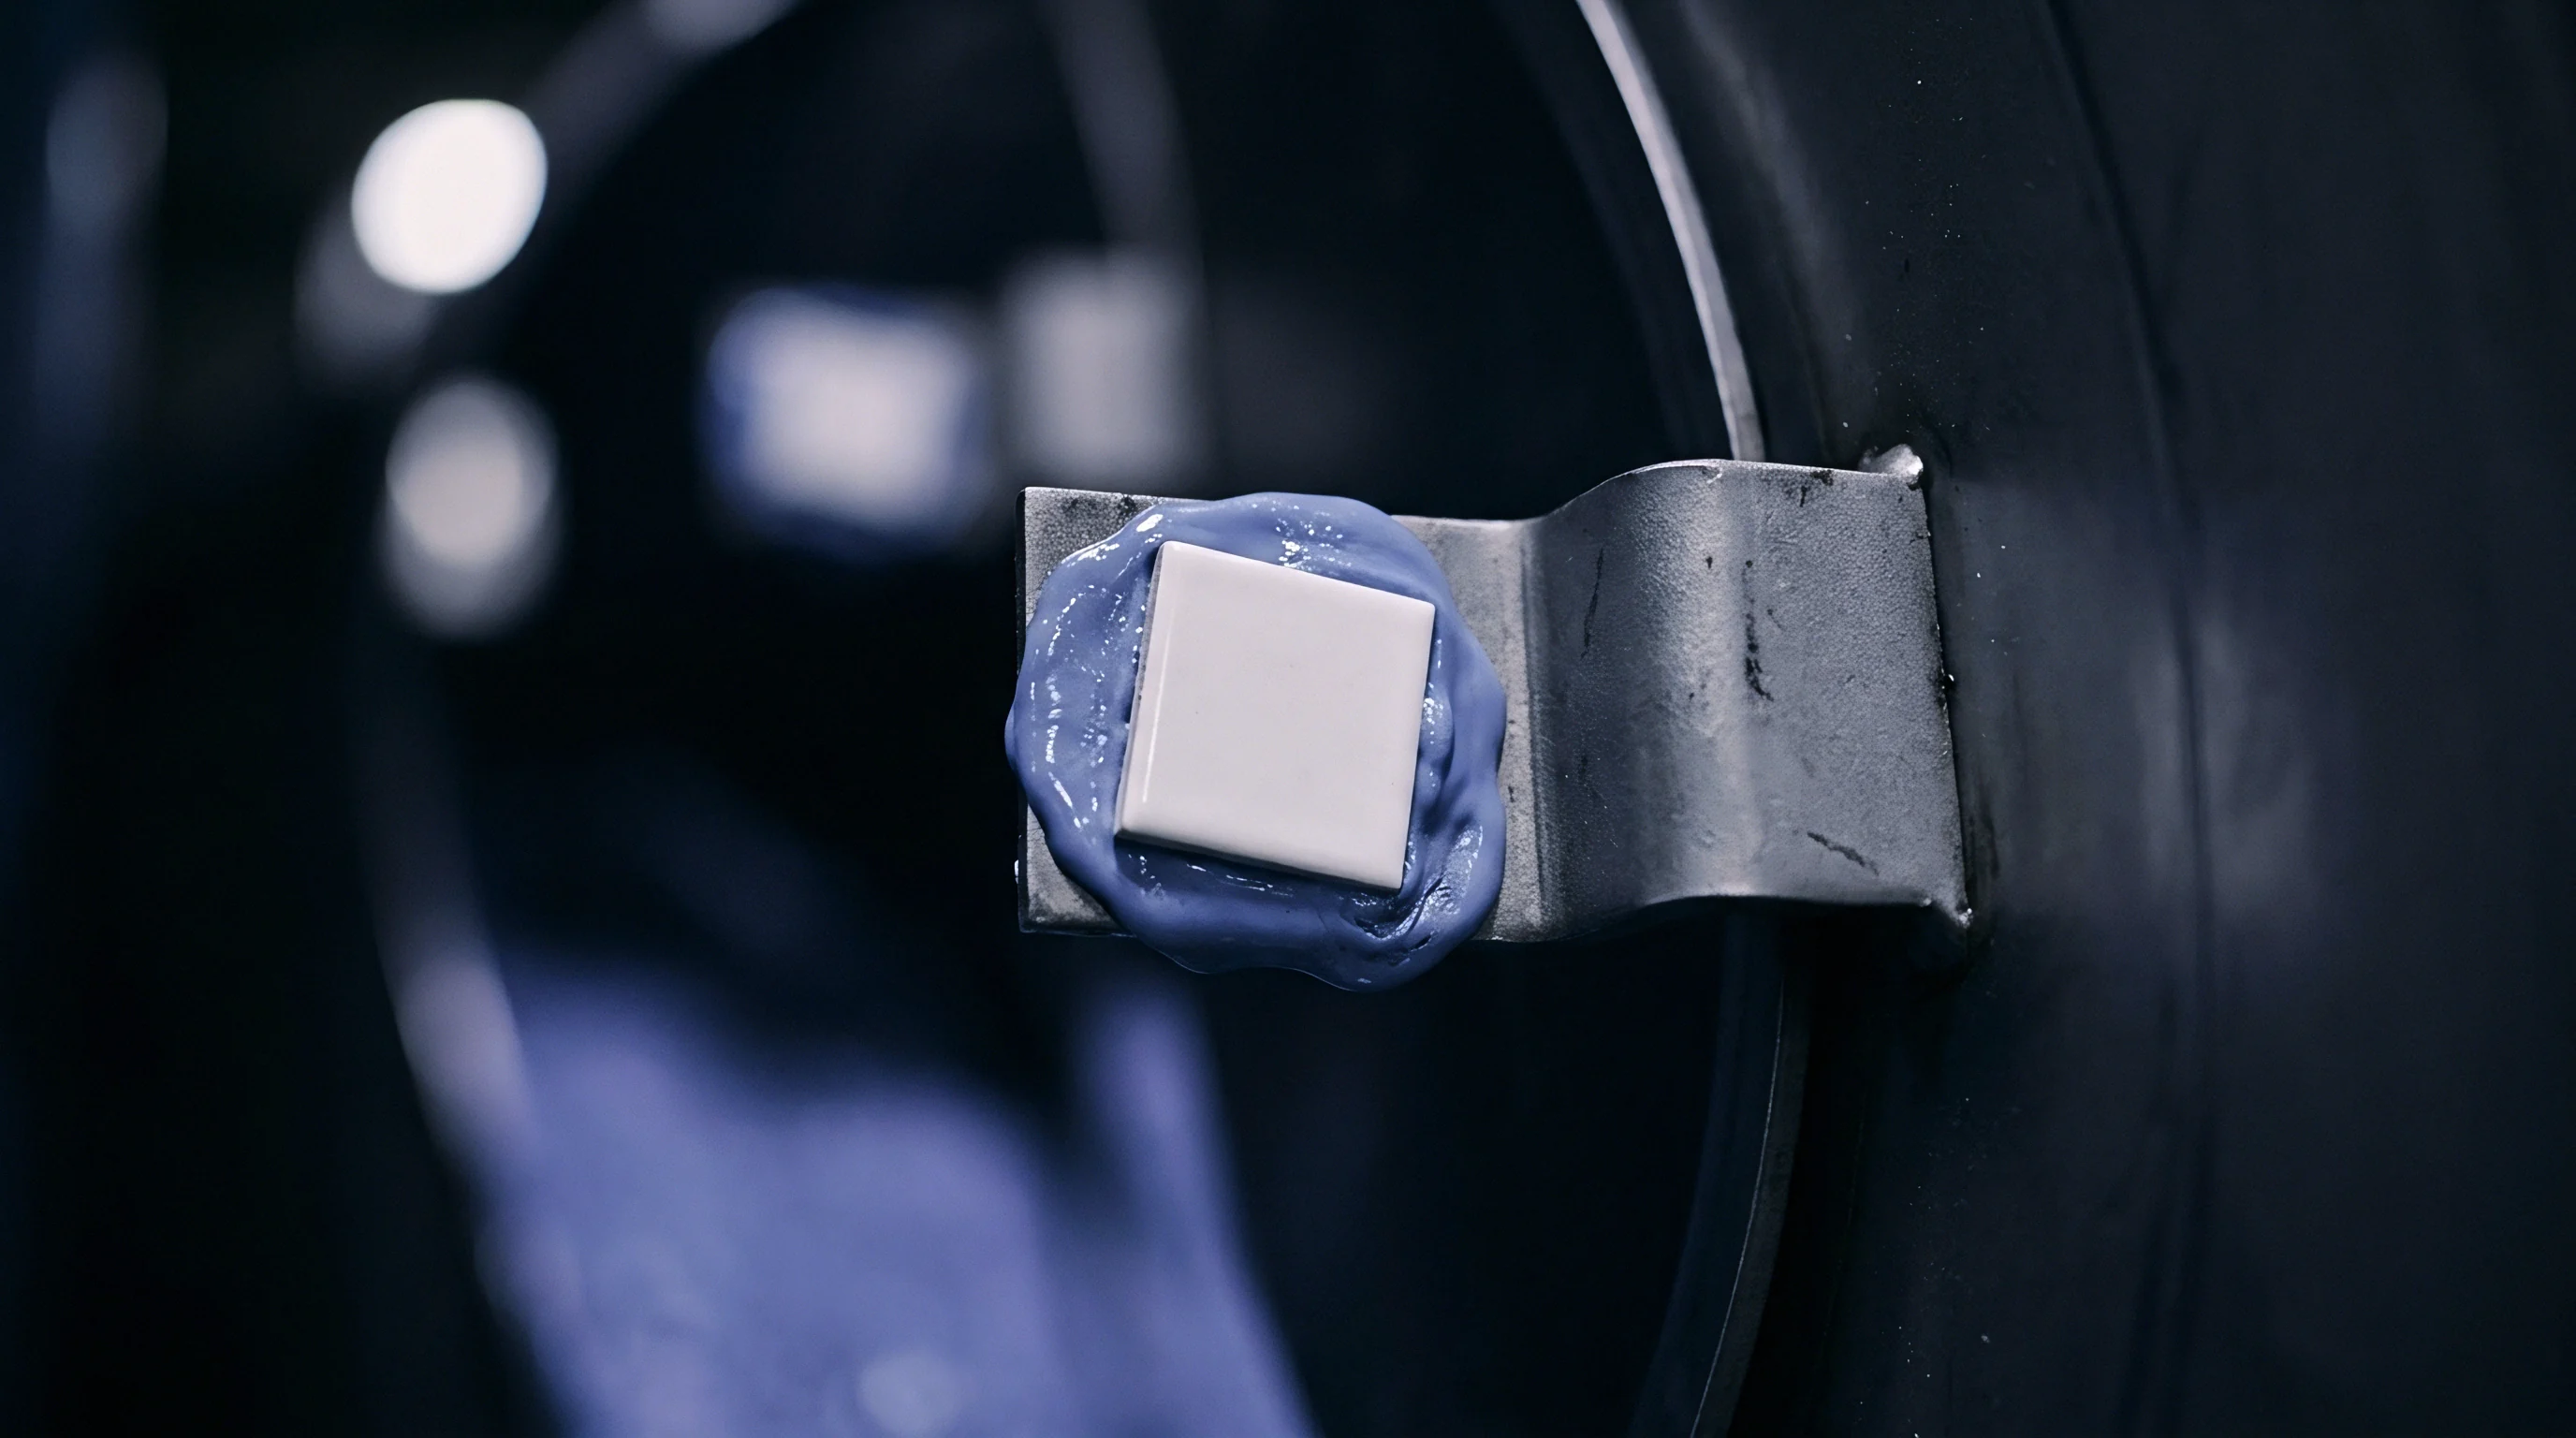
Pigment suspensions used on bench blocks rely on oil-soluble ferric ferrocyanide mixed into heavy mineral oils or alkyd resins. How this wet layer behaves under compressive shear determines how accurately the transfer mark mirrors true contact. Standard layout blue dries into a thin enamel film for scribing lines, while non-drying engineering blue stays viscous, transferring from a coated face to an uncoated land when squeezed.
Controlling coat thickness is critical for an accurate check. Anything thicker than five micrometers gives false positives by bridging real gaps between the tool faces. Toolmakers work the paste down with fine felt rollers or leather pads until it forms a uniform, semi-transparent film over the land.
When the mould halves close under light clamp pressure, high spots squeeze the pigment sideways into adjacent reliefs, exposing bare steel where pressure peaks.
Manual transfer has clear limits on complex three-dimensional surfaces. Pressure differences across steep draft angles smear the pigment, hiding small clearance defects behind trailing marks. On shut-offs angled above seventy degrees to the draw axis, shear action during closing wipes pigment down the wall before the steel ever seats.
This makes shut-off verification tricky on complex automotive or medical tools with steep interlocking features.

Transfer Thickness Limits in High-Tonnage Clamping
Steel deforms under full clamp tonnage, shifting the clearance pattern measured on the bench. A five-hundred-tonne press flexes a large mould base, bowing platens inward by tens of micrometers toward the center. To account for this flex, toolmakers do secondary blueing checks right inside the press using low-tonnage kiss-offs before setting final production clamps.
- Clean both parting line halves using fast-evaporating solvent degreaser and lint-free microfiber towels to remove ambient oil and polymer residue.
- Apply non-drying engineering blue to the cavity shut-off lands using a hard felt roller, establishing a uniform pigment thickness between two and four micrometers.
- Lower the moving tool half under manual jog control until core and cavity touch without applying hydraulic clamp force.
- Apply ten percent of nominal press clamping tonnage to record initial touch spots without crushing fragile core pin edges.
- Open the press smoothly, inspect pigment transfer patterns across all shut-off perimeters, and document areas showing zero transfer or excessive pigment accumulation.
Relying only on pigment transfer misses sub-micron surface changes caused by resin wear over long runs. Prussian blue spots high points reliably, but it cannot measure material loss along vent gates or runner drops. Under pressure, the pigment gives a simple binary result: contact or no contact.
It offers no depth measurement, leaving toolmakers to estimate how much steel to take off based on experience rather than hard figures.
When wear causes intermittent flash on precision connectors, toolmakers often re-blue the faces to track down seal loss. Changes in shop temperature alter pigment viscosity, so a morning check can look different from an afternoon test. The wet paste also creeps into ejector pin holes and slide retainers, forcing a solvent cleanout before running production resin.
These hassles are why modern toolrooms turn to optical profilometry to monitor wear across long production runs.
In disputes over rejected pre-production tooling, eighty percent pigment transfer across the parting land is sometimes cited as meeting standard bench criteria for a complete seal, despite localized smearing along deep core ribs.

Fringe
Optical profilometry trades blueing paste for non-contact light interferometry and chromatic confocal measurement. This approach captures dense 3D point clouds across cavity faces, reaching sub-nanometer height accuracy without disturbing delicate oxide films or soft coatings.
Replacing dye with light changes the workflow. Precision optical profilometers project structured light, lasers, or white-light interference fringes onto the steel, analyzing reflected wave fronts to map vertical variations. Because it avoids surface contact, toolmakers can profile soft nickel-plated inserts, polished mirrors, and delicate textures without risking scratches from feeler gauges or probes.

Non-Contact Surface Profilometry Operating Windows
White-light interferometry splits a light beam along two paths: one to an internal reference mirror, the other to the cavity steel. When the light recombines, matching path lengths produce interference fringes within the source’s coherence length. Scanning the objective vertically generates localized fringe patterns across the surface, turning phase profiles into absolute height maps.
Focus variation profilometry shifts the focal plane along the Z-axis while taking high-resolution images through wide-aperture objectives. Contrast algorithms determine local surface height from the focal position that yields peak sharpness at each pixel. This technique copes with steep side walls up to eighty-seven degrees on textured tools, fitting deep pockets where interferometry drops signal from specular reflection.
Chromatic confocal profilometry uses lenses designed with high chromatic aberration. White light passing through the optics focuses individual wavelengths at different distances along the Z-axis. Reflected light passes back through a pinhole that isolates the focused wavelength, letting a spectrometer map color directly to distance.
This point-scanning method gives reliable Z-height data on everything from mirror-polished SPI A1 surfaces to dark, chemically etched textures.
A three-dimensional coherence scanning optical profilometer measuring P20 tool steel achieves a vertical resolution below two nanometers when isolated from ambient press vibration.
Interferometric Depth Precision across Polished Steel Cavities
Interferometric scans detect sub-micron wear along shut-off lands where abrasive melt rounds off tight corner radii. Fine lateral resolution lets metrology systems pick up fine scratches, corrosion pitting, and micro-cracks before they show up on moulded parts. Overlaying these 3D point clouds onto original CAD geometry generates color-coded deviation maps that clearly spot wear.
Optical scanning runs into trouble inside deep slots or on steep draft angles. Mirror-polished steel can reflect light past the lens’s numerical aperture limit, causing missing pixels in the 3D dataset. Operators deal with specular reflection by using polarizers, light-scattering sprays, or multi-axis tilt stages that keep the target perpendicular to the lens.
| Measurement Metric | Non-Drying Prussian Blue | Chromatic Confocal Profilometry | Coherence Scanning Interferometry |
|---|---|---|---|
| Vertical Measurement Resolution | 3.0 to 5.0 micrometers | 10 to 50 nanometers | 0.1 to 2.0 nanometers |
| Lateral Spatial Resolution | 100.0 micrometers | 1.0 to 3.0 micrometers | 0.3 to 1.0 micrometers |
| Measurement Cycle Time | 15 to 30 minutes | 2 to 5 minutes | 1 to 3 minutes per scan area |
| Surface Finish Compatibility | Machined or ground lands | SPI A1 polish to coarse texture | SPI A1 to SPI A3 mirror finishes |
| Surface Physical Contact | Direct compressive contact | Non-contact optical scan | Non-contact optical scan |
| Output Data Structure | Visual qualitative pattern | 3D point cloud and ISO parameters | 3D surface topography map |
Pairing optical profilometry with an automated stage allows full inspection across multi-cavity plates. The system scans cavity inserts in sequence, stitching overlapping fields into a single surface map for the whole parting line block. This provides the hard data needed to track steel wear over hundreds of thousands of press cycles.
How does shop vibration from nearby seventy-tonne stamping presses affect fringe stability during high-magnification scans on portable floor stations?

Scar
Resins filled with glass fibers, mineral beads, or metal flakes turn fast melt streams into abrasive cutting fluids. Shooting through tight gates at speeds over fifty meters per second, these additives scour cavity walls, stripping oxide films and scratching micro-grooves into hardened steel. Wear leaves visible scars on tool steel.
Polymer processing wears steel through four main mechanisms: abrasion, corrosion, adhesive galling, and cavitation erosion. Identifying which mechanism is damaging a core pin or runner insert tells toolmakers whether to add a hard PVD coating, change steel grade, or adjust press settings.

Which Cavity Locations Experience Accelerated Polymer Washout?
Gate entrances take the brunt of the kinetic energy during filling. High volumetric flow and severe shear cause localized washout, rounding sharp gate edges into funnels. Glass-reinforced polyamides like PA66-GF30 create intense abrasion across land transitions, opening up gates and wearing cores until parts sink, gate vestigo growth occurs, and cavity fill balances drift.
Wear rates depend heavily on filler hardness, orientation, and loading in the resin matrix. Angular glass fibers sit at six to seven on the Mohs scale ~ far harder than standard P20 tool steel at thirty Rockwell C. In thin sections where fibers align with the wall, wear shows up as fine parallel scratches. Where melt hits a bend near a gate drop, tumbling fibers hammer the steel, creating micro-pits and local deformation.
- Abrasive Resin Washout occurs along gate lands and core transitions where high-velocity glass-filled melt strips steel layers, increasing gate depth and disrupting multi-cavity flow balance.
- Corrosive Chemical Pitting develops when degraded fluoropolymers or flame-retardant resins release acidic vapors, attacking grain boundaries within tool steel and forming microscopic surface voids.
- Adhesive Metal Galling generates deep material transfers across unlubricated slide faces, ejector pins, and core shut-offs under high lateral friction and thermal load.
- Thermal Fatigue Micro-Cracking forms network crazing across cavity faces exposed to extreme cyclical temperature swings during steam-assisted or induction-heated rapid heat-cycle moulding operations.
- Cavitation Erosion Scours surface pockets near final fill venting zones where trapped air compresses under hyperbaric shock, creating micro-implosions that pit tool steel faces.
For thirty percent glass-filled polyamide 66 running in AISI H13 steel hardened to 52 HRC, baseline cavity wear averages 0.45 micrometers per ten thousand cycles under standard melt temperatures. That figure comes from single-point gate drop tests across a three-shift run using standard ISO test plaques. Raising mold wall temperature by twenty degrees Celsius or bumping glass content to fifty percent triples that wear rate, showing how sensitive tool life is to process shifts.
DIN 16742 Group 140 tolerance limits require cavity volume re-qualification once shut-off wear exceeds 12 micrometers across the parting land.

Galling Mechanics on Unlubricated Slide Retainers
Mechanical slides, lifters, and collapsing cores take heavy metal-to-metal punishment during actuation. High lateral injection pressure forces slide faces hard against guide tracks during filling. When the tool opens, these components stroke under heavy loads before lubricants can stabilize friction, cold-welding tiny high spots together.
Galling starts when microscopic asperities on opposing steel faces shear and transfer metal back and forth. Unlubricated slides made from matching steel grades run high friction, heating up until the surfaces seize. Toolmakers prevent this by pairing dissimilar metals ~ like running hardened H13 slides against aluminum-bronze wear plates ~ or coating tracks with low-friction CrN.
In medical and cleanroom moulding where grease is banned to prevent part contamination, slides must run on coatings or self-lubricating dry films. Uncoated S7 slides running dry at high speed start galling within twenty thousand cycles, leading to jammed mechanisms, snapped core pins, and sudden press downtime.

Corrosive Pitting and Fluoropolymer Degassing
Processing halogenated polymers, flame-retardant resins, or fluoropolymers such as PVDF and PTFE releases acidic gases under heat and shear. Hydrogen chloride and hydrogen fluoride condense on cool cavity faces during mold opening, attacking iron and chromium in the tool steel. While plastic pressure flexes the cores, this corrosive condensate eats into grain boundaries, pitting steel around cold water lines and unvented corners.
Corrosion attacks steel differently than mechanical abrasion. Acids dissolve the iron matrix first, leaving hard alloy carbide grains sticking out from the cavity wall. Passing melt then snaps off these unsupported carbide particles, speeding up wear.
Stainless tool steels with at least thirteen percent chromium, like AISI 420 or Stavax, resist acidic condensate and cut pitting dramatically in high-humidity moulding environments.
An unvented fluoropolymer electrical housing tool suffered severe gas burning and pitting on core ribs, driving sixty-five thousand dollars in repair costs for a complete EDM re-sink and laser cladding after just fifteen thousand shots.
Metrics
Quantifying wear takes mathematical parameters that describe complex 3D surface changes. 2D profile roughness like Ra and Rz picks up single-line height changes, but misses overall volumetric loss, pit distribution, and directional scratching across large cavity faces.
ISO 25178 defines areal surface texture parameters, giving a standard framework for 3D tool wear measurement. Areal metrology maps topography across an entire area, splitting parameters into height, spatial, hybrid, functional, and volumetric metrics that track physical wear directly.

Areal Surface Topology under ISO 25178 Standards
Height parameters show the statistical spread of Z-coordinates around a mean plane. Sa gives the arithmetical mean height over the scanned area, Sq calculates root mean square height, and Sz measures the distance between the highest peak and deepest valley. While Sa works for quick baseline checks on polished cavities, it misses isolated pits or individual scratches.
Functional volumetric parameters from the Material Ratio Curve give much better diagnostic insight. Vmp measures peak material volume that wears off during initial run-in. Vmc quantifies core material volume ~ the main structural mass of the steel ~ while Vvc tracks core void volume, which reflects oil pockets or erosion pits.
Tracking changes in Vvc over time helps maintenance teams predict when parting line shut-offs will start flashing.
| ISO 25178 Parameter | Parameter Name | Wear Mode Sensitivity | Diagnostic Indicator |
|---|---|---|---|
| Sa | Arithmetical Mean Height | General Cavity Abrasion | Broad increase indicates loss of polish finish |
| Sz | Maximum Surface Height | Galling and Deep Scratches | Spikes indicate localized material pickup or scoring |
| Sp | Maximum Peak Height | Adhesive Weld Material Pickup | Elevation indicates metal transfer on slide faces |
| Sv | Maximum Pit Depth | Corrosive Pitting & Erosion | Negative spikes track acidic pitting depth |
| Vmp | Peak Material Volume | Polishing Run-in Break-in | Rapid initial decay during first 5,000 cycles |
| Vvc | Core Void Volume | Parting Line Seal Degradation | Volume loss predicts flash formation points |
Spatial parameters such as Sal (auto-correlation length) and Str (texture aspect ratio) measure surface directionality. Freshly ground tool steel has a clear directional lay, keeping Str values close to zero. As multidirectional melt erosion takes over, the surface turns isotropic and Str moves toward one.
Optical profilometers use this shift to distinguish factory machining marks from wear caused by high-velocity melt.
When core pin deflection generates asymmetrical optical height maps, the parting line seals fail long before cavity wall wear affects part ejection.
Volume Depletion Arithmetic across Gate Regions
Calculating total volume loss requires aligning a worn 3D point cloud against the original CAD model or an unworn sign-off scan. Metrology software runs best-fit alignment algorithms against non-wearing datums ~ like dowel holes or outer frame edges ~ to isolate changes happening inside the cavity drop.
Algorithms subtract the worn height grid from the baseline scan, integrating Z-axis differences across the evaluation area. This gives total eroded steel volume in cubic millimeters, along with maximum depth profiles along critical flow lines.
There is little published data establishing the exact volume loss needed to cause visible sink or wall variation in unfilled polypropylene medical parts; literature lacks empirical models connecting specific Vvc erosion values to local sink across different polymer shrinkage ranges. In practice, buyers protect quality by setting hard maintenance limits at ten micrometers Z-depth loss, triggering tool service regardless of theoretical part tolerances.
Tracking volumetric wear across routine maintenance intervals creates a clear tool-life curve. Plotting wear depth against shot count shows three distinct phases: an initial rapid run-in, a steady linear wear period, and an accelerating terminal phase where part quality drops fast. Engineers schedule refurbishments during the steady phase, avoiding sudden downtime and severe parting line damage.


Remedy
Repairing worn tool steel takes precise deposition methods that restore dimensions without overheating adjacent metal or distorting the mold. Once optical profilometry maps the depth and spread of material loss, toolmakers choose the right process to rebuild shut-offs, gates, and runners.
Toolrooms rely on micro-laser cladding, physical vapor deposition coatings, micro-welding, and precision hand benching. Deciding between local repair and full insert replacement depends on steel grade, coating compatibility, remaining tool amortisation life, and heat-affected zone limits.

Laser Cladding versus Insert Replacement Economics
Micro-laser powder cladding uses focused heat to deposit alloy onto worn lands. A fiber laser melts a shallow surface layer while feeding fine metal powder into the pool. Because overall heat input is low, the heat-affected zone stays under two hundred micrometers deep, avoiding distortion, annealing, or cracking in the base steel.
Laser cladding rebuilds gate dimensions with alloys matched to the parent metal, like AISI H13 or CPM 9V. After deposition, the added material is CNC milled or EDM’d back to size and hand-polished to match original surface finish.
| Refurbishment Process | Deposit Thickness Range | Heat-Affected Zone Depth | Process Temperature | Hardness Range (HV) |
|---|---|---|---|---|
| Micro-Laser Cladding | 0.1 to 2.0 millimeters | 50 to 200 micrometers | 1,400 to 1,600 °C (local) | 550 to 750 HV |
| TIG Micro-Welding | 0.5 to 3.0 millimeters | 500 to 1,500 micrometers | 1,500 to 1,700 °C (local) | 450 to 650 HV |
| PVD TiAlN Coating | 1.0 to 5.0 micrometers | 0 micrometers (no melt) | 200 to 500 °C | 2,800 to 3,200 HV |
| Hard Chrome Plating | 5.0 to 25.0 micrometers | 0 micrometers (electrochem) | 50 to 70 °C | 800 to 1,000 HV |
| Modular Insert Replacement | N/A (full steel block) | 0 micrometers | Ambient | 50 to 56 HRC (base) |
When parting line wear covers large areas or multi-cavity blocks, localized welding becomes impractical. Machining out the worn area and fitting a modular insert is often cleaner and more reliable. Inserts also let toolmakers put tougher materials ~ like powder-metallurgy steels or high-conductivity copper-beryllium ~ right where wear is worst.
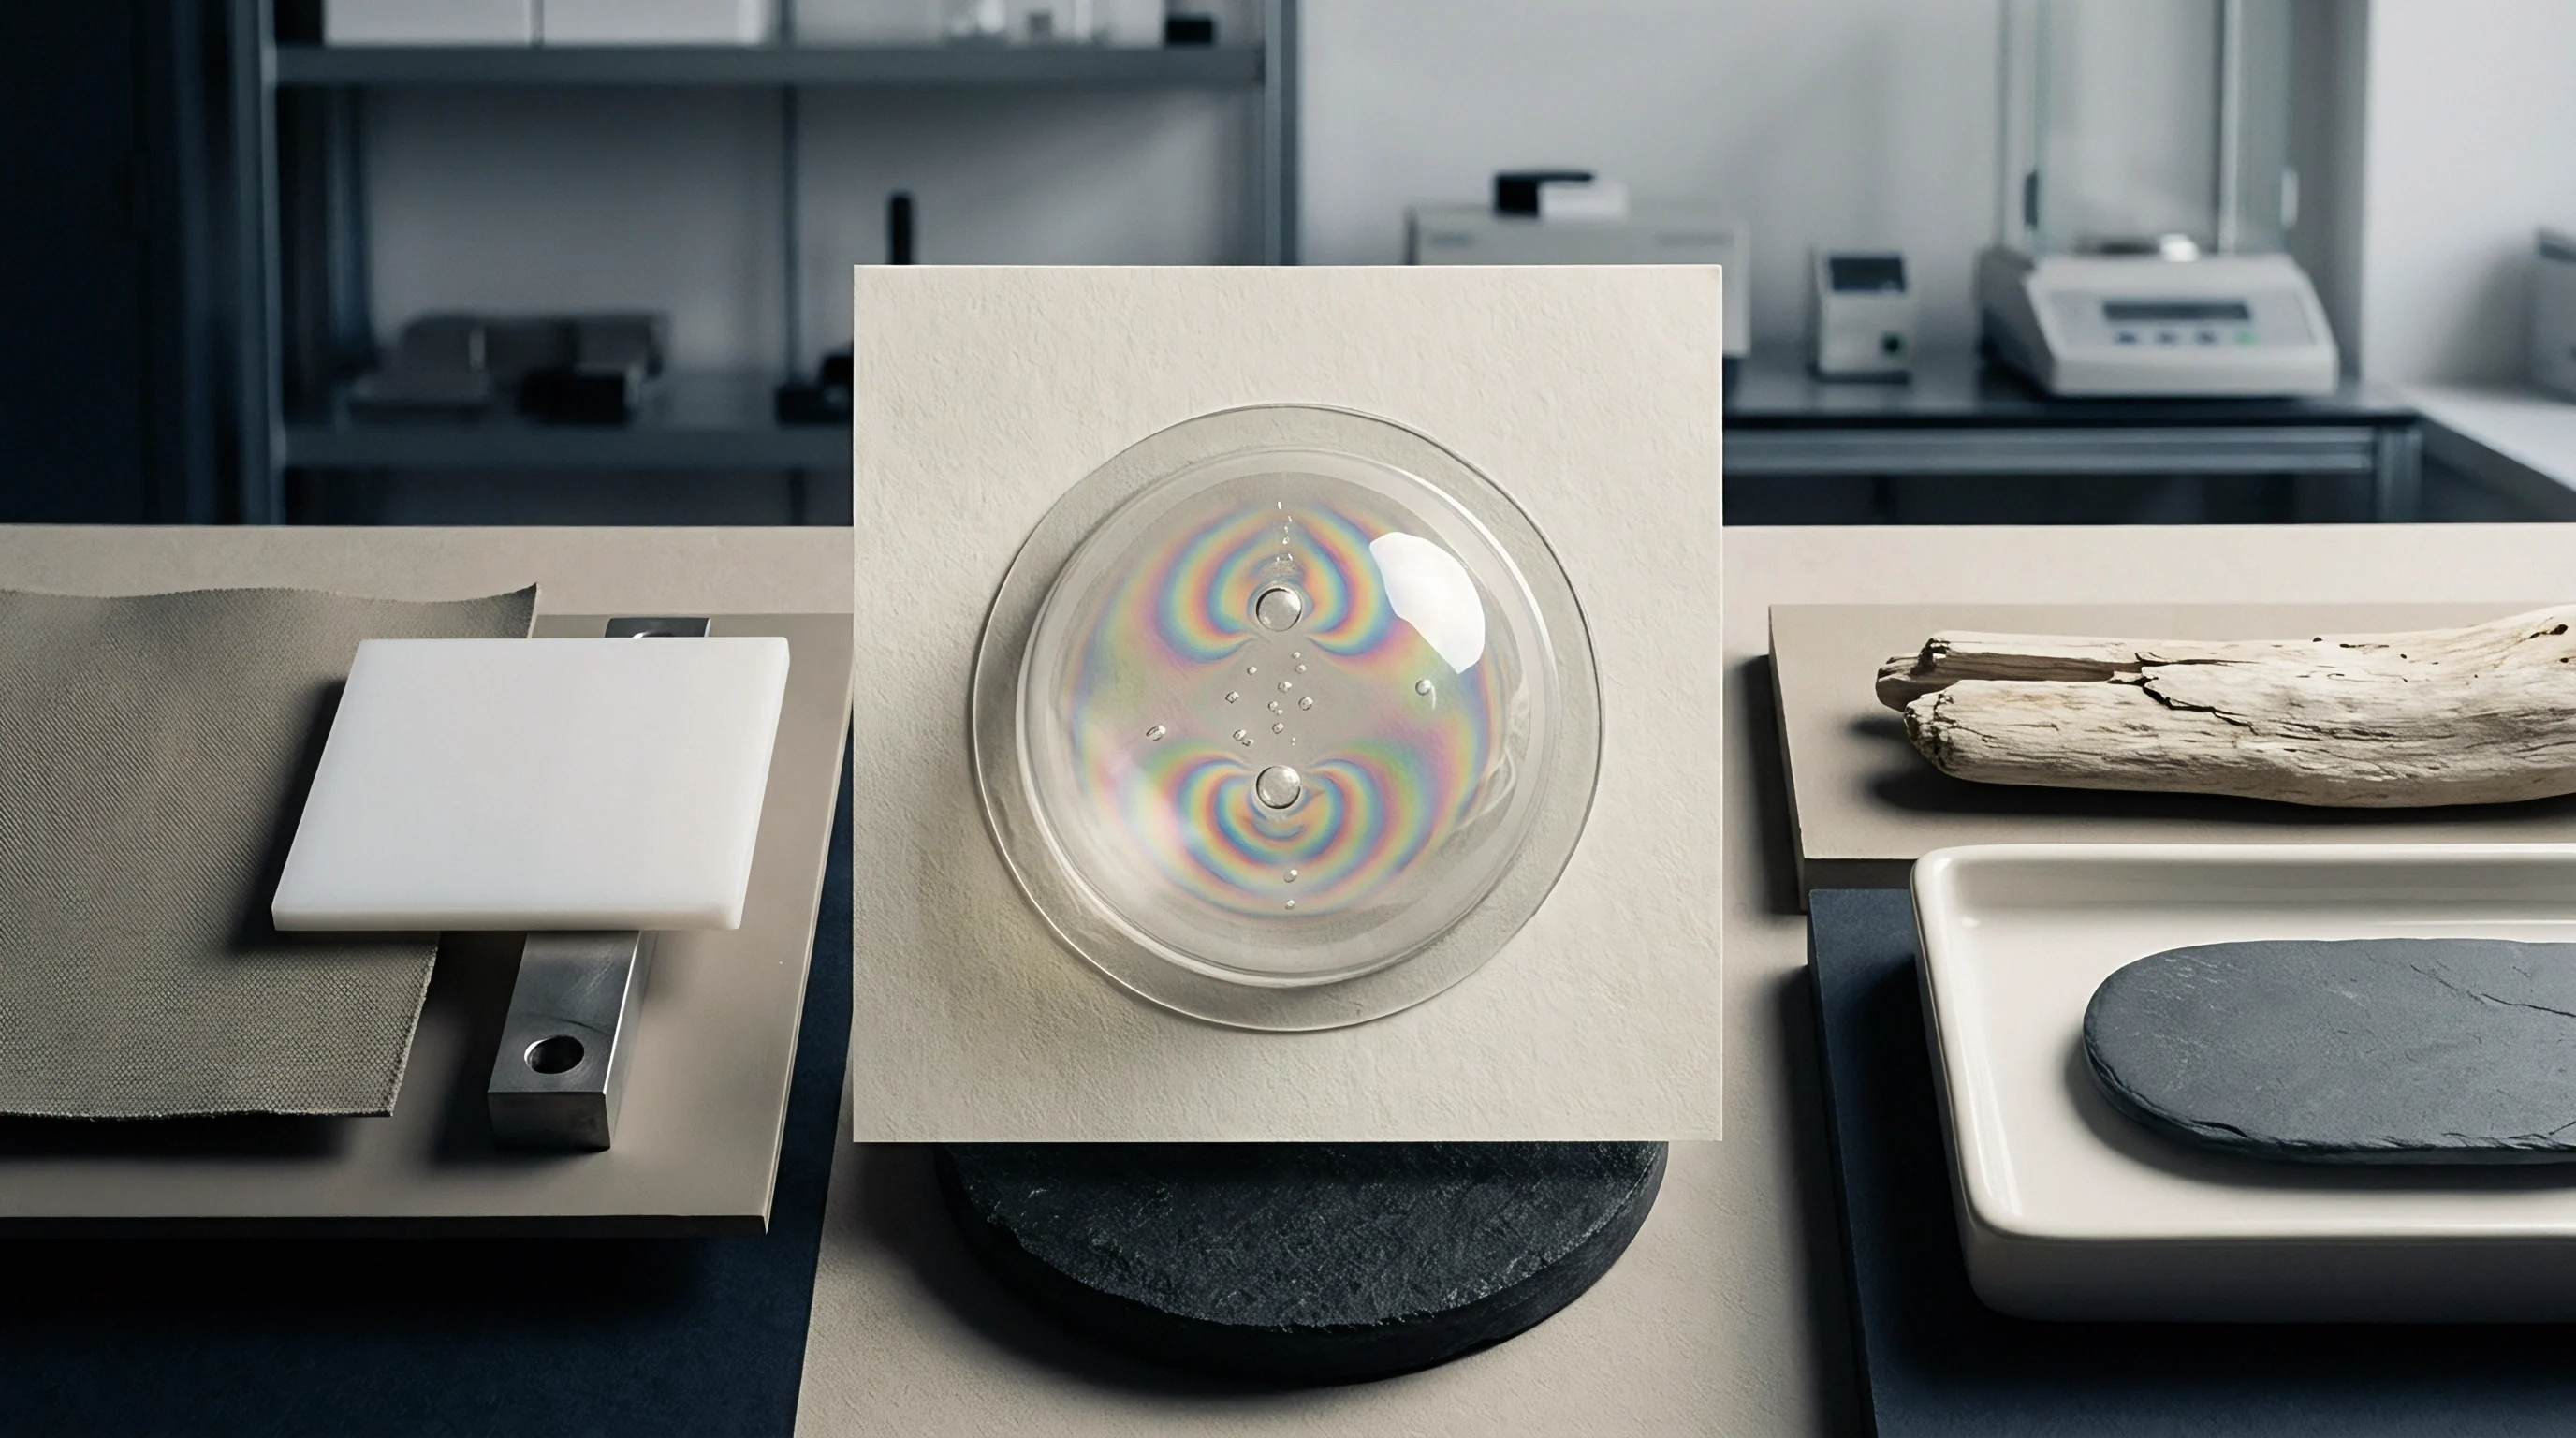
Physical Vapor Deposition Barriers for Abrasive Resin Systems
Physical vapor deposition puts thin ceramic or metallic nitride films on cavity faces, forming a hard barrier against abrasive resin and corrosive gas. Inside a vacuum chamber, PVD systems arc-evaporate titanium, chromium, or aluminum in a nitrogen atmosphere to deposit thin ceramic films on the tool.
- Titanium Aluminum Nitride (TiAlN) Coatings reach micro-hardness levels over three thousand Vickers, protecting gates from high-velocity glass fibers.
- Chromium Nitride (CrN) Layering offers strong adhesion and corrosion resistance, sealing steel grain boundaries against acidic fluoropolymer gases.
- Diamond-Like Carbon (DLC) Films bring friction coefficients below 0.1, preventing galling on unlubricated cleanroom slides and ejector sleeves.
- Titanium Nitride (TiN) Plating gives general scratch protection and visual wear tracking, turning from gold to silver as the film wears down.
Micro-welding a shut-off edge without stress-relieving the surrounding H13 steel causes secondary micro-cracking during the next five thousand clamp cycles.
Coating adhesion depends entirely on surface cleanliness and substrate micro-roughness before vacuum processing. Toolmakers polish cavity steel to optical finishes beforehand, because microscopic flaws telegraph right through thin ceramic coatings. When coatings eventually wear through along gate edges, they can be stripped chemically and re-applied without losing underlying steel dimensions.
Always verify substrate hardness before picking thin PVD ceramic coatings, because soft tool steels flex under injection pressure, cracking hard surface coatings like ice over water.
Dossier
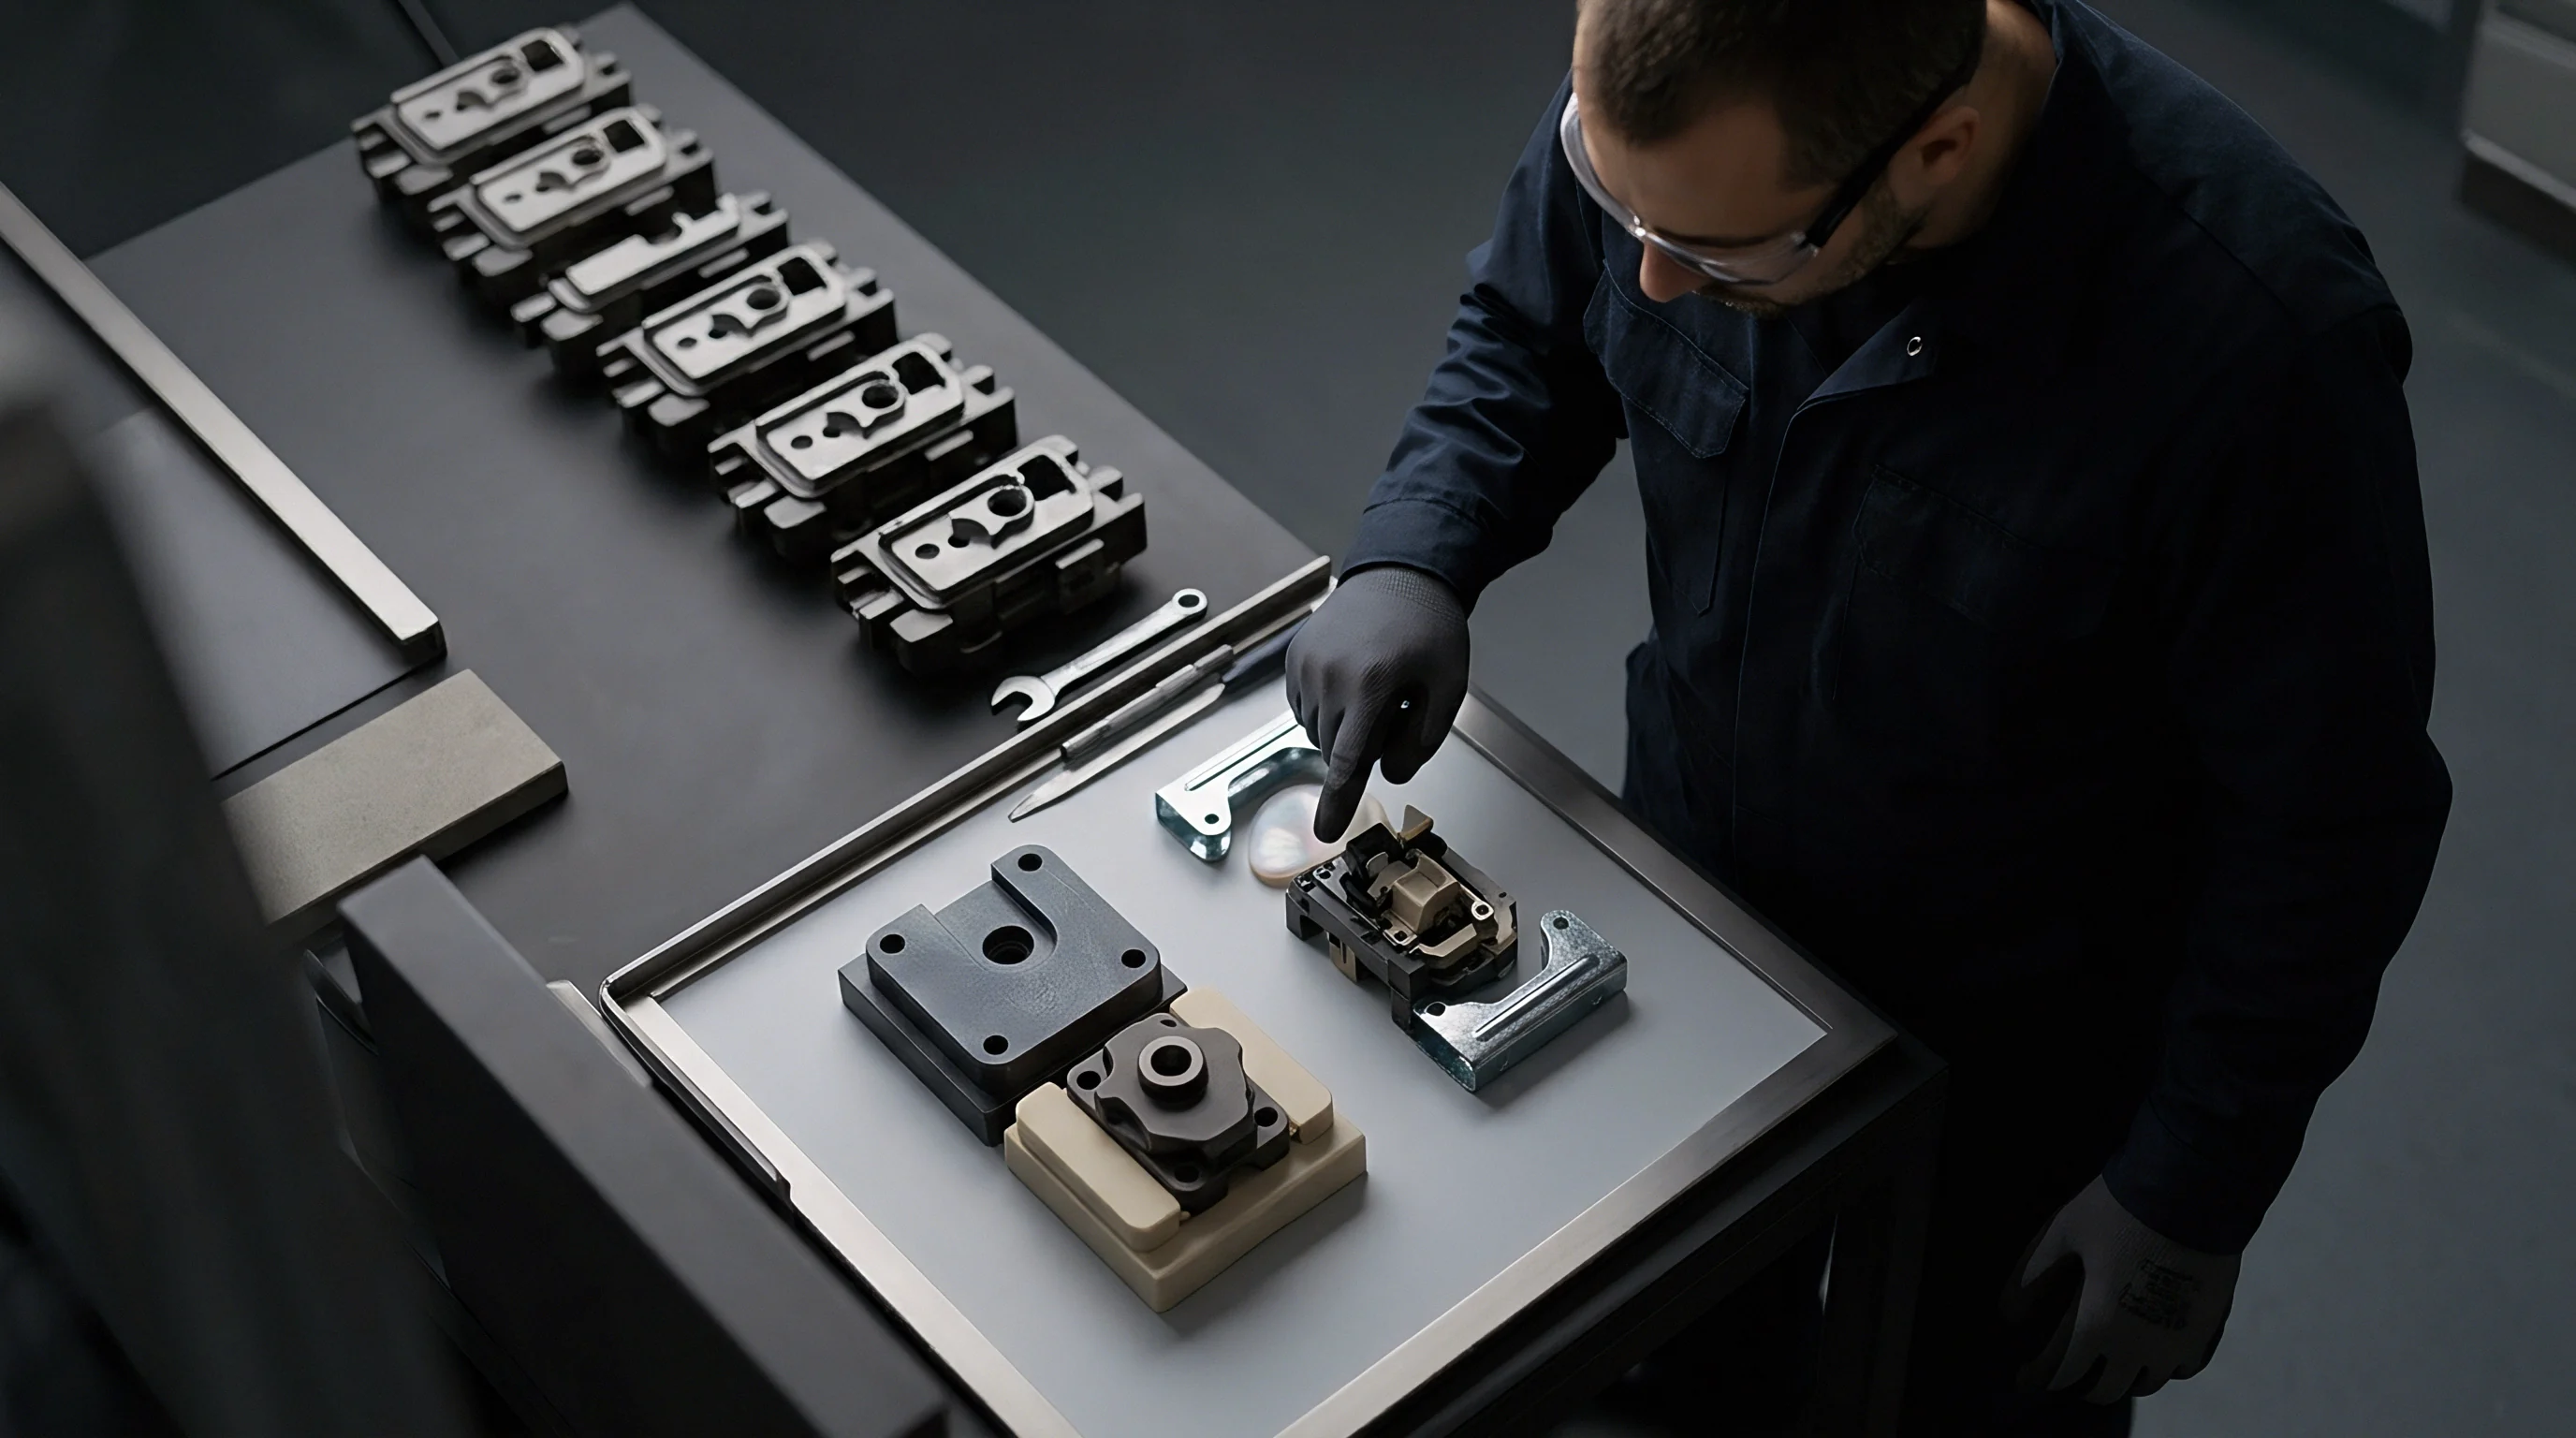
Traceable tool wear verification takes solid documentation that connects quality labs with production floors. Baseline optical scans taken during tool signoff serve as the benchmark for resolving wear disputes, setting maintenance intervals, and managing asset transfers throughout the tool’s life.
Tool supply agreements often break down over vague definitions of acceptable wear. Writing ISO 25178 surface parameters and baseline scans directly into procurement contracts protects both brand owners and molders from early tooling disputes.
Baseline Scanning Protocols in Tool Supply Agreements
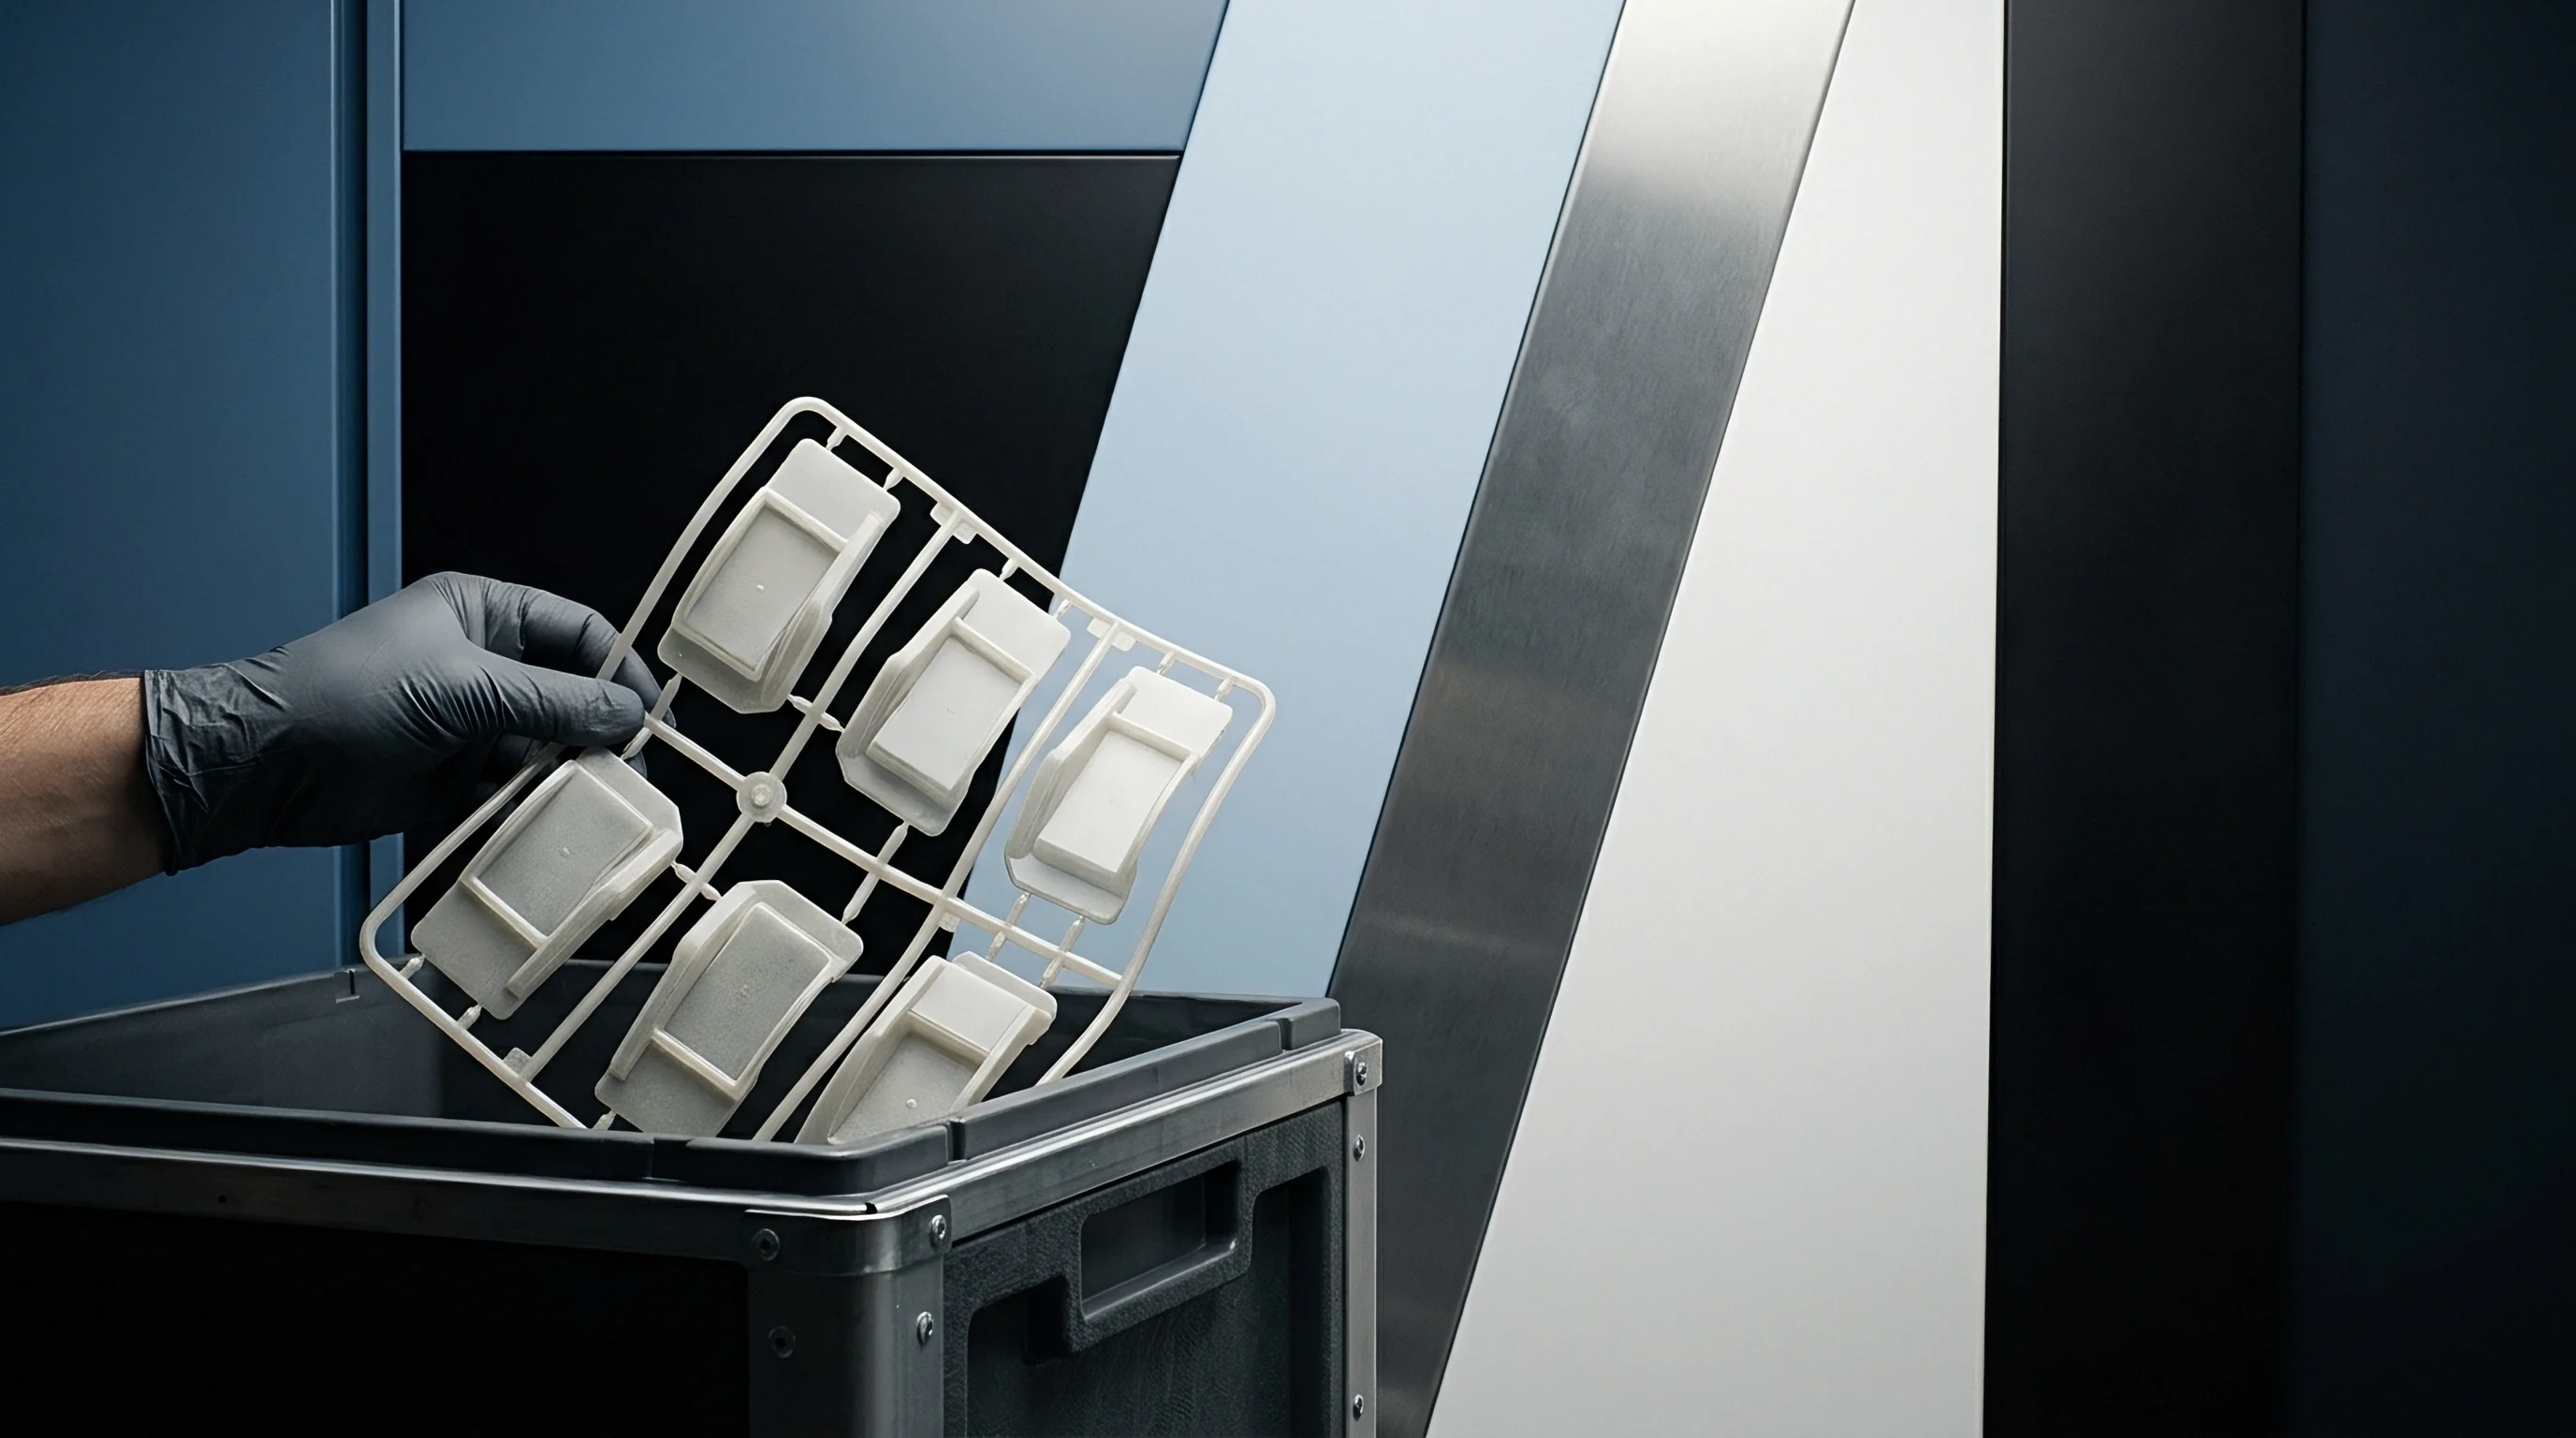
Commissioning new tooling should always include a complete digital scan before T1 sampling. The toolmaker captures high-resolution profilometry scans across all shut-offs, gates, vents, and optical surfaces, saving raw 3D point cloud files as a permanent baseline.
This dossier establishes the tool’s true initial geometry, clearing up any later debate over whether defects came from machining errors or resin wear during production. The brand owner keeps these digital files in the master procurement record alongside final CAD models and steel origin certificates.
Contracts ought to define wear limits using hard volumetric or Z-depth figures rather than visual judgments. Setting a maximum gate washout depth at twenty micrometers or parting land loss at 0.05 cubic millimeters creates clear maintenance triggers funded by whichever party is responsible.
Lifecycle Wear Audit and Asset Transfer Signoff
When moving tools between contract molders, an optical wear audit prevents arguments over existing steel damage. The outgoing molder runs a standardized scan across all cavities, comparing current dimensions to the baseline dossier to quantify wear accumulated during their run.
Keeping maintenance records in a centralized digital dossier makes stress-relief heat treatments, slide lubrication, and PVD recoating fully traceable. If profilometry spots unusual wear, engineers check press logs to see if melt pressure, clamp tonnage, or resin moisture drifted outside approved windows.
Standard transfer contracts should require a full optical scan comparison against original T1 baselines, specifying that any unrecorded shut-off wear over fifteen micrometers obligates the outgoing supplier to restore cavity lands at their own expense before release.