Optical Profilometry Metrology Protocols for Indirect Tool Cavity Topography Verification
Calibrated silicone replicas combined with optical profilometry yield sub-micron tool cavity topography metrics without destructive sectioning.

Replica
Indirect micro-geometry capture uses high-fidelity polymers poured into unexposed steel cavities to extract three-dimensional topography without sectioning the tool. Deep ribs, internal thread flanks, micro-lens arrays, and narrow electrical discharge machining pockets block direct optical line-of-sight access. Injecting a liquid elastomer into the cavity produces an inverted physical impression: the cured medium captures micro-peaks as valley impressions and surface pits as raised projections.
Measurement integrity depends on how accurately the impression medium wets the steel, cross-links without voids, releases cleanly, and holds dimensional stability under the profilometer objective.
Polymer Cross-Linking and Volumetric Contraction
Elastomeric impression compounds contract during curing, shifting the spatial position of surface micro-peaks. Two-component polyvinylsiloxane polymers and polyether impression resins cross-link via addition-cure reactions, releasing no volatile byproducts during polymerisation. This chemical pathway yields lower volumetric shrinkage than condensation-cure formulas.
Linear shrinkage ranges from 0.02 percent to 0.15 percent depending on filler loading and cross-link density. Curing at standard laboratory temperature prevents thermal expansion mismatch between the steel tool and the elastomeric matrix.
Silicone impression compounds containing active platinum catalysts exhibit linear cure shrinkage under 0.05 percent when cured at 20 degrees Celsius.
Thermal gradients directly affect impression fidelity. Steel tools carry a thermal expansion coefficient near 11.5 micro-strain per degree Celsius, whereas polyvinylsiloxane elastomers exceed 200 micro-strain per degree Celsius. Curing an impression inside a heated cavity causes pronounced thermal contraction during cooling to ambient measurement conditions.
The resulting shrinkage distorts pitch distances across multi-cavity micro-structures. Room-temperature vulcanising impression media eliminate this thermal mismatch.

Wetting Physics in Narrow Steel Cavities
Low viscosity enables synthetic siloxanes to penetrate sharp internal corners and fine electrical discharge machining structures before gelation occurs. Surface tension between liquid silicone and tool steel governs capillary action inside micro-pockets; high surface tension traps air at the root of fine cavity features. Vacuum-assisted dispensing removes trapped gas before the polymer cures, and degassing the impression fluid at 50 millibars prior to cavity injection eliminates internal micro-bubbles that rupture during optical scanning.
| Medium Type | Linear Cure Shrinkage (%) | Elastic Recovery (%) | Nominal Viscosity (Pa·s) | Optical Reflectivity at 532 nm (%) |
|---|---|---|---|---|
| Ultra-Low Viscosity PVS | 0.04 | 99.85 | 1.2 | 18.5 |
| Medium-Viscosity Polyether | 0.12 | 98.90 | 14.5 | 12.0 |
| Fast-Cure Acrylic Compound | 0.25 | 95.20 | 0.8 | 42.0 |
| High-Filler Synthetic Silicone | 0.02 | 99.92 | 45.0 | 22.5 |
| Data measured at 20 degrees Celsius following 24-hour cure under ambient laboratory pressure. | ||||
Demoulding subjects the cured polymer to high tensile and shear strains. High elastic recovery allows the medium to stretch past cavity undercuts and snap back without permanent set. Polyvinylsiloxane formulas maintain elastic recovery values above 99.8 percent; insufficient elastic recovery leaves residual deformation that renders sub-micron topography measurements invalid.
- Air Void Entrapment Microscopic bubbles lodge in narrow sub-micron pockets during manual dispensing. The voids collapse under pressure, forming false surface pits in the scanned point cloud.
- Permanent Set Distortion Extraction forces exceed the yield limit of soft elastomers during demoulding. Permanent deformation skews the depth profile of narrow cavity ribs.
- Plasticizer Exudation Unreacted low-molecular-weight oil migrates to the impression surface within hours of curing. The liquid film masks true topography and scatters incident light during profiling.
- Thermal Contraction Skew Removing the impression from a warm tool induces differential shrinkage across thick sections. Dimensional distances across features warp during thermal equilibration.
Claims that elastomeric impressions reproduce steel surface detail down to twenty nanometers without dimensional correction ignore polymer cure shrinkage, thermal expansion mismatch, and viscoelastic relaxation across extended measurement times.

Beam
Optical profiling sensors evaluate soft impression polymers using non-contact light waves. Interferometric and chromatic sensors apply no physical stylus pressure, preventing plastic deformation of the elastomeric matrix. Focus variation, coherence scanning interferometry, and chromatic confocal microscopy capture surface coordinate clouds directly from the impression surface, with each optical technology governed by its own limits in numerical aperture, specular reflectance, and optical phase absorption.
Coherence Scanning and Confocal Signal Generation
White light interferometers split single illumination paths into sample and reference beams to construct axial fringe patterns. Coherence scanning interferometry processes the modulation envelope of these fringes to identify vertical surface heights, rapidly sampling field areas with sub-nanometer vertical resolution across smooth surfaces. Chromatic confocal microscopy focuses spectrally split light along the optical axis using hyper-chromatic lenses, filtering reflected wavelengths through a pinhole to map peak intensity light to precise vertical coordinates.
Coherence scanning interferometry using a 50x objective with a 0.55 numerical aperture yields a vertical noise floor below 0.1 nanometers on flat calibration mirrors.
Focus variation optics pair low depth of field with precise axial translation. The system calculates local contrast across variation windows to identify the focal plane, measuring steep surface slopes reaching 80 degrees on matte, diffusely scattering impression polymers. Specular, highly polished impressions reduce contrast, causing localized data dropouts in focus variation point clouds.
| Technology | Vertical Resolution (nm) | Lateral Resolution (μm) | Maximum Surface Slope (deg) | Field Scanning Speed (mm²/min) |
|---|---|---|---|---|
| Coherence Scanning Interferometry | 0.08 | 0.35 | 25 | 4.2 |
| Chromatic Confocal Microscopy | 1.50 | 1.10 | 45 | 1.8 |
| Focus Variation Metrology | 10.00 | 0.85 | 82 | 18.5 |

Light Scattering on Translucent Impression Polymer
Subsurface optical dispersion inside soft siloxanes shifts the detected height plane, introducing artificial noise into micro-topography scans. Unfilled silicones display marked optical translucency at visible wavelengths; light penetrates tens of micrometers into the polymer matrix before scattering back, causing the optical sensor to place the focal plane below the true physical boundary. Adding titanium dioxide or carbon black pigment to the liquid resin increases optical opacity, restricting photon absorption to a boundary layer under fifty nanometers thick.
Low reflectivity reduces signal-to-noise ratios during high-speed optical rastering. Polished tool steel reflects over sixty percent of incident visible light, whereas natural silicone reflects less than five percent. Increasing sensor LED output or camera exposure time compensates for low return signals, but higher exposure settings reduce acquisition speed and heighten sensitivity to ambient bench vibrations.
Operators must balance sensor gain against background floor noise during signal acquisition.
How does the optical phase change occurring on pigmented silicone impression media alter step-height calculations when comparing indirect scans against direct stylus baseline measurements?


Texture
Three-dimensional areal parameters defined under international standards translate physical surface height variations into quantitative statistical metrics. ISO 25178 defines surface parameters across primary, roughness, and waviness scales. Evaluating tool cavity impressions requires mathematically mapping captured impression data back to the original steel coordinates: high micro-peaks on an impression correspond directly to deep tool cavity pits, while impression valleys represent high steel peaks.

Areal Surface Parameter Inversion
Spatial coordinates captured from an impression represent exact geometric negations of original mold cavity features. Calculating height distribution metrics directly from un-inverted impression point clouds generates incorrect functional interpretations. Skewness describes surface height asymmetry across the evaluation area: negative skewness indicates a surface dominated by deep valleys, typical of lubricated sliding surfaces, whereas positive skewness indicates a surface dominated by sharp peaks.
Scanning an impression directly without coordinate inversion flips the arithmetic sign of skewness.
Applying ISO 25178-3 spatial filtering with an S-filter cutoff of 0.8 micrometers suppresses optical high-frequency sensor noise without distorting structural tool roughness peaks.
Spatial cutoff filtering separates long-wavelength form errors from short-wavelength surface roughness. An S-filter removes high-frequency optical noise produced by light scattering, while an L-filter removes long-wavelength waviness and geometric tilt across the field of view. Selecting the nesting index determines which surface frequencies enter statistical parameter calculations, with standard cutoff values depending on the expected surface roughness grade of the tool cavity.

Can Optical Profilometry Resolve Deep Cavity Sidewalls?
Steep geometric angles inside narrow tool pockets push non-contact optical sensors to their physical acceptance limits. Light emitted by the profiler objective hits steep sidewalls and reflects away from the optical path, dropping the returning light intensity below the sensor detection limit and generating missing data points known as dropouts. Objective selection dictates the maximum detectable slope angle according to numerical aperture formula limits.
- Position the cured impression specimen onto the automated tilt-stage beneath the optical profiler lens.
- Level the primary evaluation plane using a three-point software algorithm to eliminate mounting tilt.
- Adjust sensor light intensity and camera gain until peak reflection counts reach 80 percent of detector saturation.
- Execute a three-dimensional raster scan over the designated evaluation field using a 20 percent overlap between adjacent image tiles.
- Apply an spatial S-filter with a 0.8 micrometer cutoff to suppress high-frequency sensor noise from the raw dataset.
- Invert the axial Z-axis coordinates within the analytical software to restore true steel cavity orientation.
- Extract ISO 25178 areal parameters including Sa, Sz, Ssk, and Sal from the filtered dataset.
Spatial auto-correlation length measures the distance over which surface heights display statistical independence. Short auto-correlation values indicate high spatial frequency textures, such as fine spark-eroded tool surfaces, whereas long auto-correlation values reflect directional lay patterns created by mechanical milling operations. Accurately resolving spatial lay requires precise lateral pixel sampling across the profiling sensor array.
A simple rule governs parameter inversion: always negate the axial coordinate dataset before calculating spatial skewness, peak extreme heights, or material ratio curves on indirect impressions.

Bench
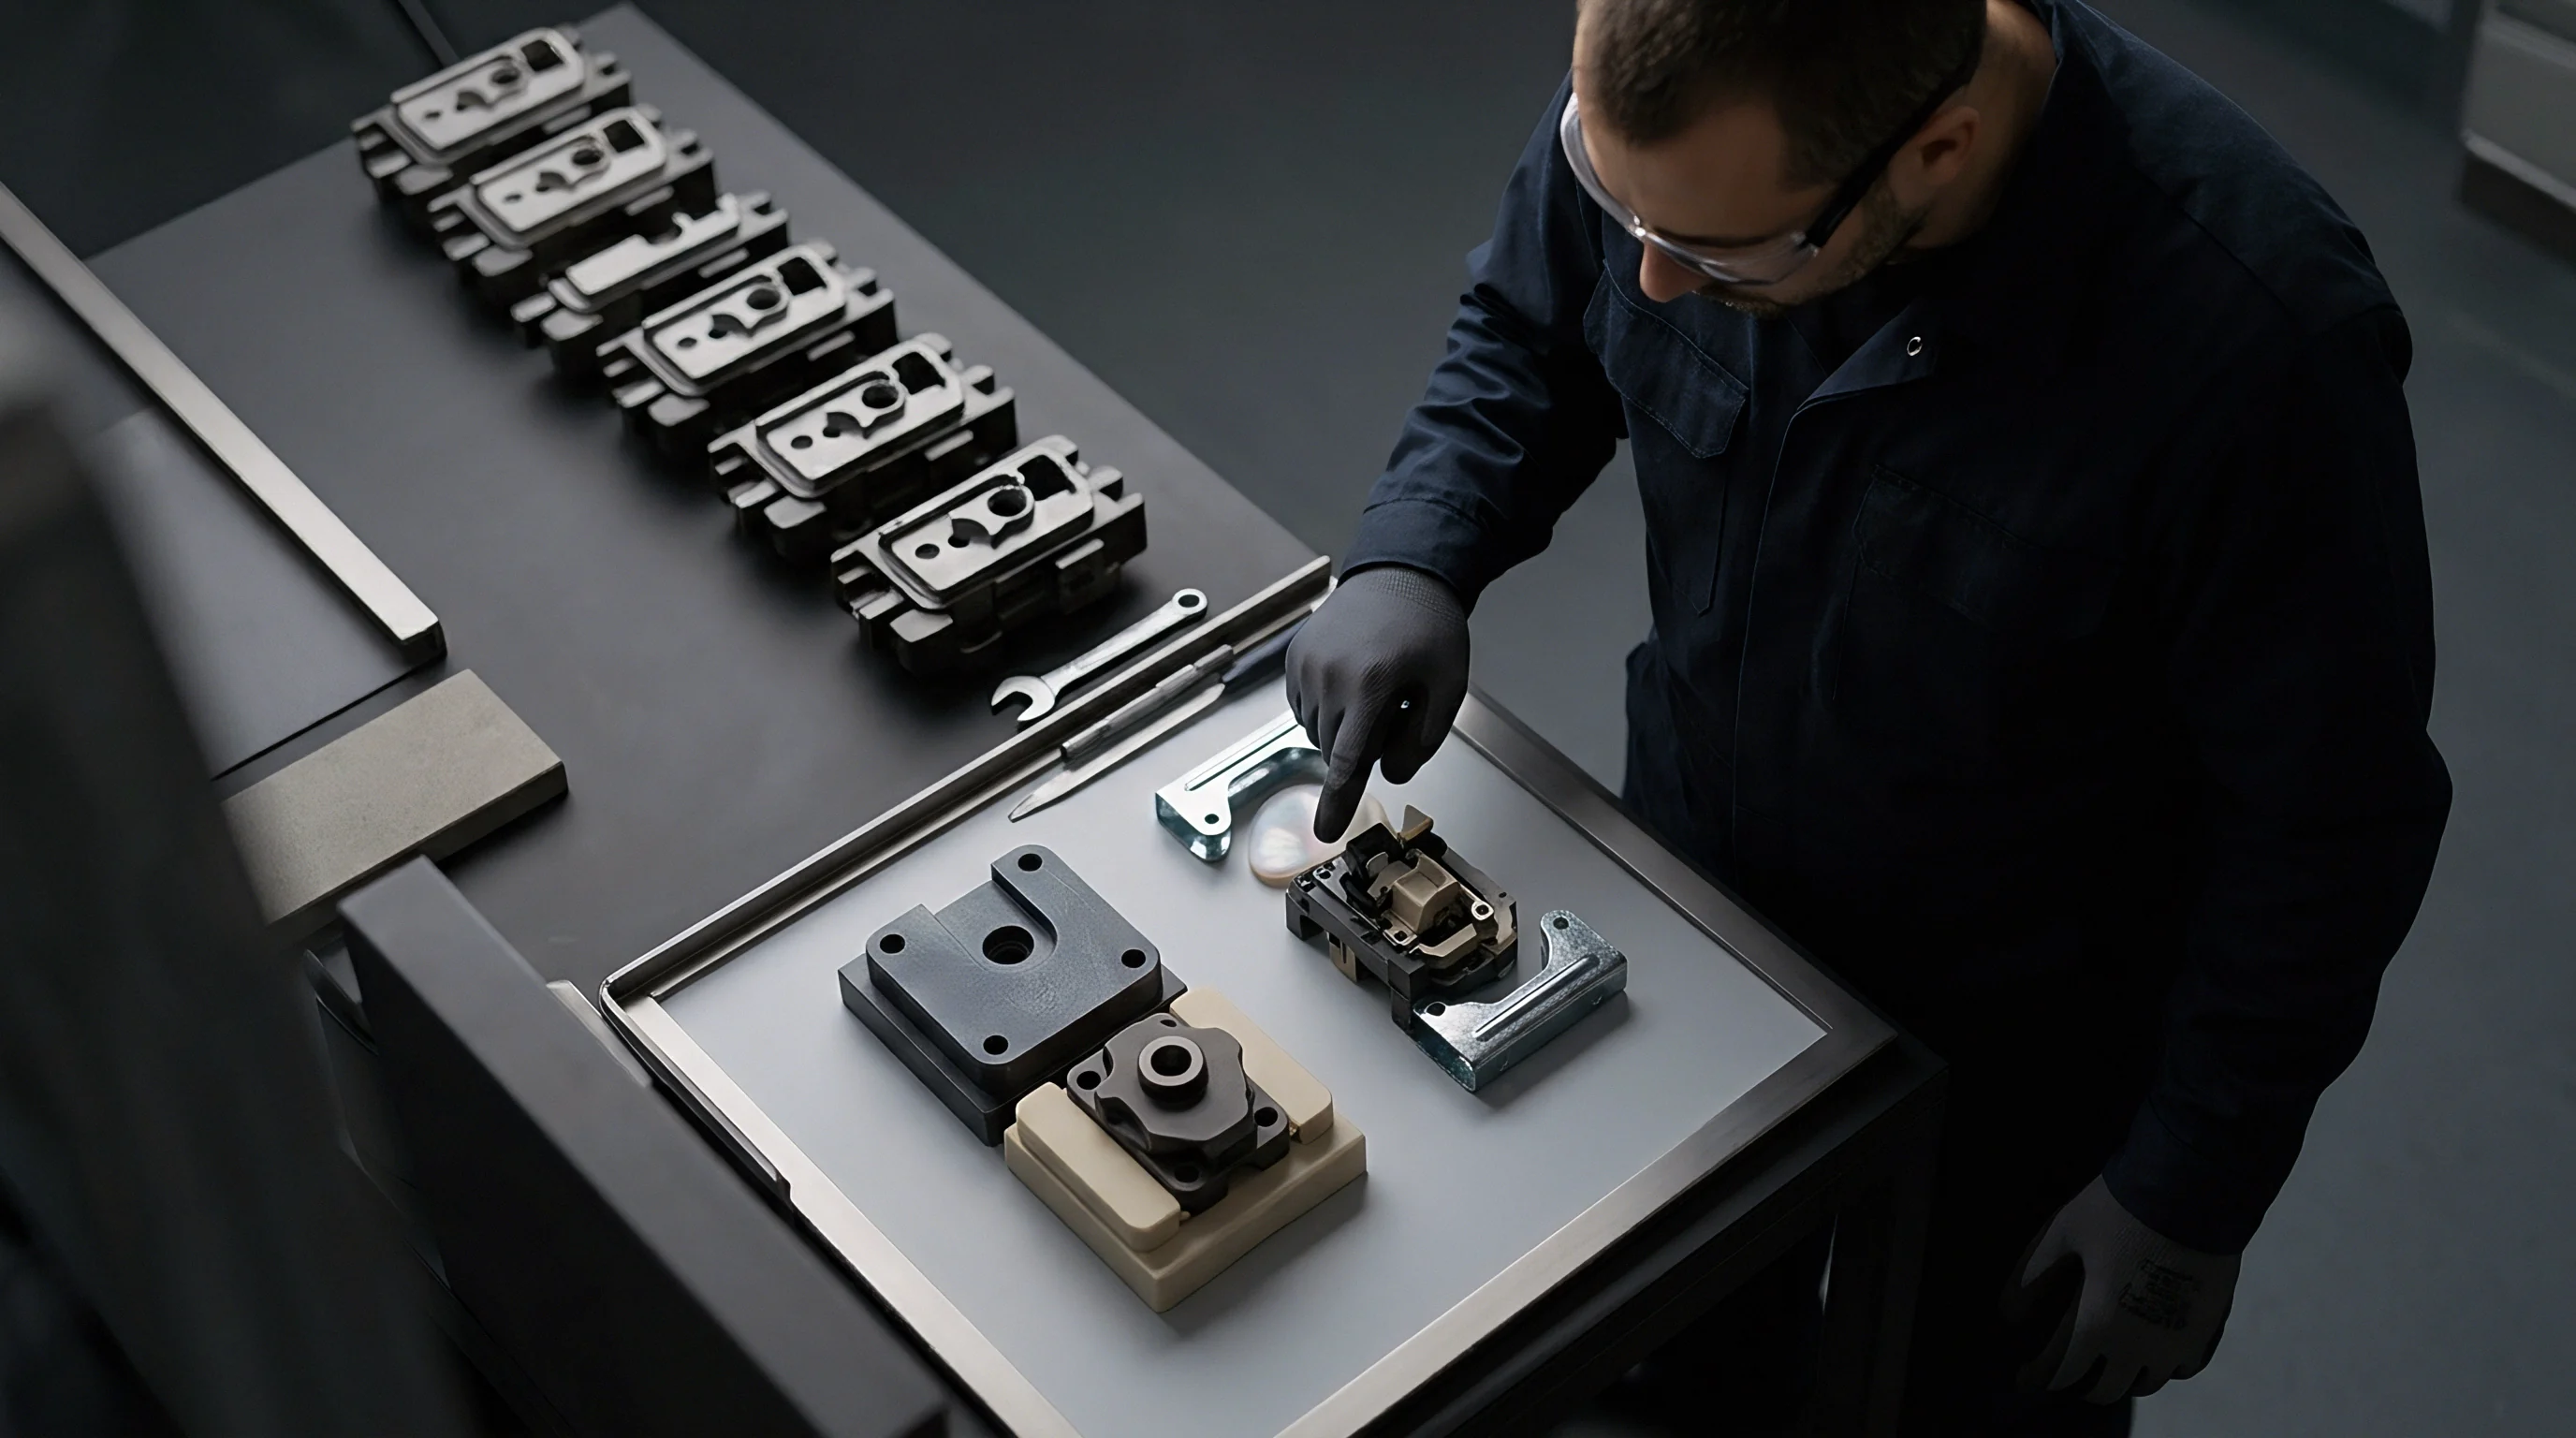
Physical isolation of soft polymeric impressions during scanning prevents mechanical distortion and optical vibration artifacts. Environmental stability inside the metrology room dictates measurement repeatability, as flexible silicone specimens yield easily to subtle thermal changes and ventilation drafts. Securing the soft specimen to a rigid substrate stabilizes spatial positioning during lengthy high-resolution optical rastering.
Substrate Fixturing and Environmental Isolation
Flexible impression media sag under gravity when supported improperly, skewing primary surface tilt angles. Low-modulus elastomers deform under their own weight when specimen thickness exceeds ten millimeters. Mounting impressions into rigid anodized aluminum specimen holders stabilizes boundary edges, with cyanoacrylate adhesives providing fast, low-stress bonding between the elastomer base and the aluminum plate.
Thermal expansion differences between metal and polymer require holding room temperature within plus or minus 0.5 degrees Celsius.
Environmental isolation systems must damp floor vibrations above 2 Hz to prevent fringe jitter during white light interferometric scanning of soft impression specimens.
Air currents passing over soft impression surfaces cause low-frequency optical path fluctuations. Enclosing the optical profiler inside an acrylic environmental chamber mitigates convective draft noise, while passive pneumatic isolation tables attenuate floor vibrations produced by nearby production presses. Unattenuated low-frequency vibrations induce periodic ripple artifacts into three-dimensional topography maps.
Gage Repeatability for Soft Polymer Impressions
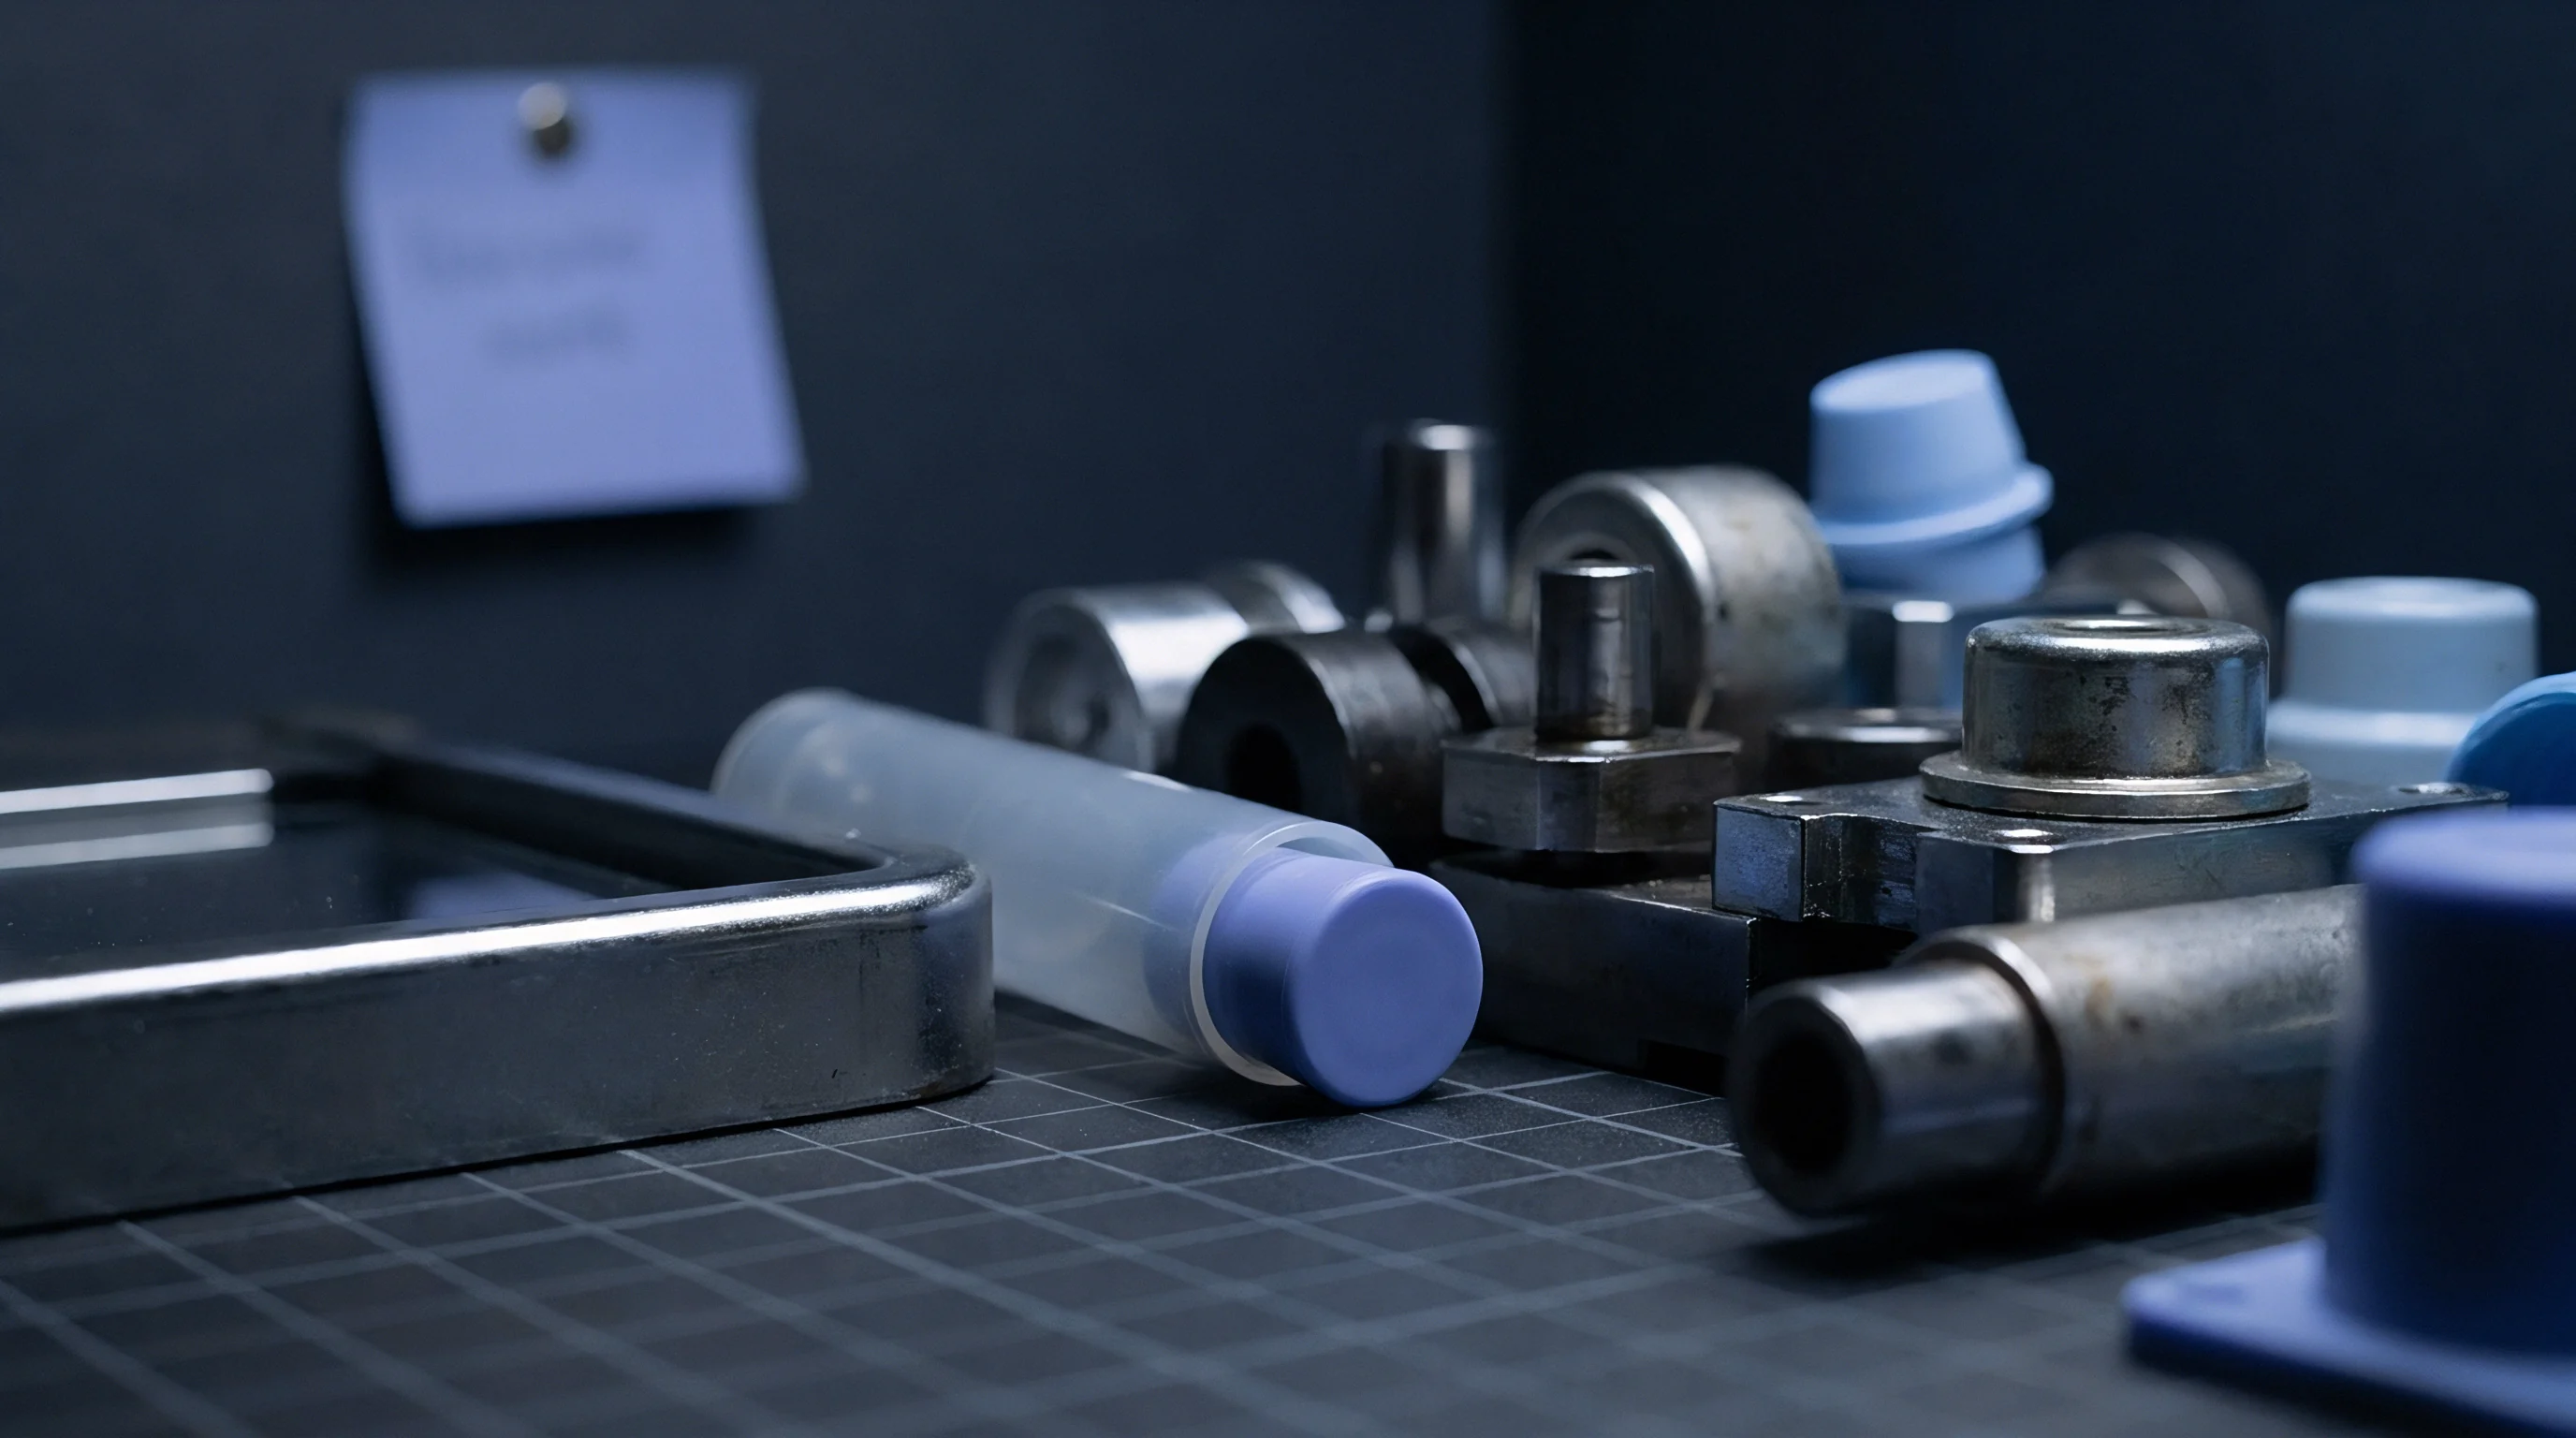
Measurement system evaluation quantifies variance introduced by operator handling, repositioning, and optical sensor drift. Conducting a formal Gage Repeatability and Reproducibility study requires taking multiple measurements across distinct impression specimens using different technicians. Soft polymer media introduce unique variance components related to handling deformation and surface dust accumulation.
| Parameter Metric | Chromatic Confocal (20x) | Coherence Scanning (50x) | Focus Variation (20x) |
|---|---|---|---|
| Numerical Aperture (NA) | 0.45 | 0.55 | 0.40 |
| Working Distance (mm) | 4.50 | 3.40 | 13.00 |
| Lateral Pixel Size (μm) | 0.62 | 0.22 | 0.44 |
| Measurement Field (mm²) | 1.20 x 1.20 | 0.35 x 0.35 | 0.80 x 0.80 |
| Auto-Focus Z-Step (nm) | 20 | 10 | 50 |
- Specimen Leveling Standard Alignment between the impression surface and sensor Z-axis must stay within 0.1 degrees to prevent geometric distortion across scanned fields.
- Environmental Thermal Floor Ambient room temperature must hold within 20 degrees Celsius plus or minus 0.5 degrees during calibration sequences.
- Substrate Bond Integrity The adhesive layer securing the impression elastomer to the metal mounting plate must exhibit zero creep across the test window.
- Sensor Signal Saturation Reflected signal intensity must remain between 70 and 85 percent of the detector saturation ceiling across all field tiles.
Failing to stabilize impression temperature prior to optical scanning causes systematic spatial drift, corrupting step-height dimensions and invalidating tool acceptance dossiers.


Ledger
Tooling procurement contracts link capital equipment milestone payments to verified mold surface parameters. Cavity surface micro-roughness dictates component release forces, cycle speeds, and visual aesthetics of moulded parts. Disagreements between toolmakers and moulding buyers emerge when unverified steel surfaces fail to deliver required part finishes during initial tool trials.

Milestone Release and Technical Dossier Sign-Off
Tooling buyers enforce geometric acceptance criteria before issuing final funds to toolmakers. Indirect optical profilometry protocols provide non-destructive documentation of cavity topography prior to tool shipment. The toolmaker submits a verified surface dossier containing raw optical point clouds, filtering indices, and calculated ISO 25178 areal parameters, with capital release clauses requiring independent audit approval of these surface metrics.
Dispute resolution protocols depend on standardized indirect measurement metrics. Direct stylus profiling risks scratching expensive mirror-polished tool steel, whereas indirect replication preserves steel integrity while creating a permanent physical archive of cavity condition at tool sign-off. Buyer quality teams re-evaluate archived impressions if surface defects emerge during high-volume production runs.
Commercial Allocation of Surface Defect Scrap
Unverified cavity roughness causes ejection drag, driving cycle delays and component rejects during mass production. High local surface peaks in the mold steel create physical interlocks with shrinking polymer melt during cooling, generating ejection forces that cause stress whitening, wall deformation, or part sticking. Re-machining and hand-polishing an unapproved cavity at press-side increases tooling costs and consumes press hours.
Standard procurement contracts contain technical clauses specifying that mold steel surface sign-off relies strictly on ISO 25178 areal parameters measured via indirect replication protocols, shifting financial liability for surface-induced scrap directly to the toolmaker prior to tool shipment.