Optical Profilometry Replica Metrology Protocol for Mould Cavity Topography
Indirect optical profilometry on elastomeric cavity replicas yields sub-micron texture data while eliminating tool teardown and optical access limits.


Cast
Tool steel retains every microscopic mark left by electro-discharge machining, diamond polishing, or chemical etching. Direct optical measurement inside narrow injection mould cavities, deep ribs, or internal undercuts is constrained by line-of-sight limits, narrow numerical apertures, and objective clearance constraints. High-fidelity elastomeric replication transfers the negative surface relief of a closed or semi-accessible mould cavity into a flexible polymer impression.
Metrologists then measure this impression on external optical profilometers without destroying the tool or disassembling multi-plate mold stacks.
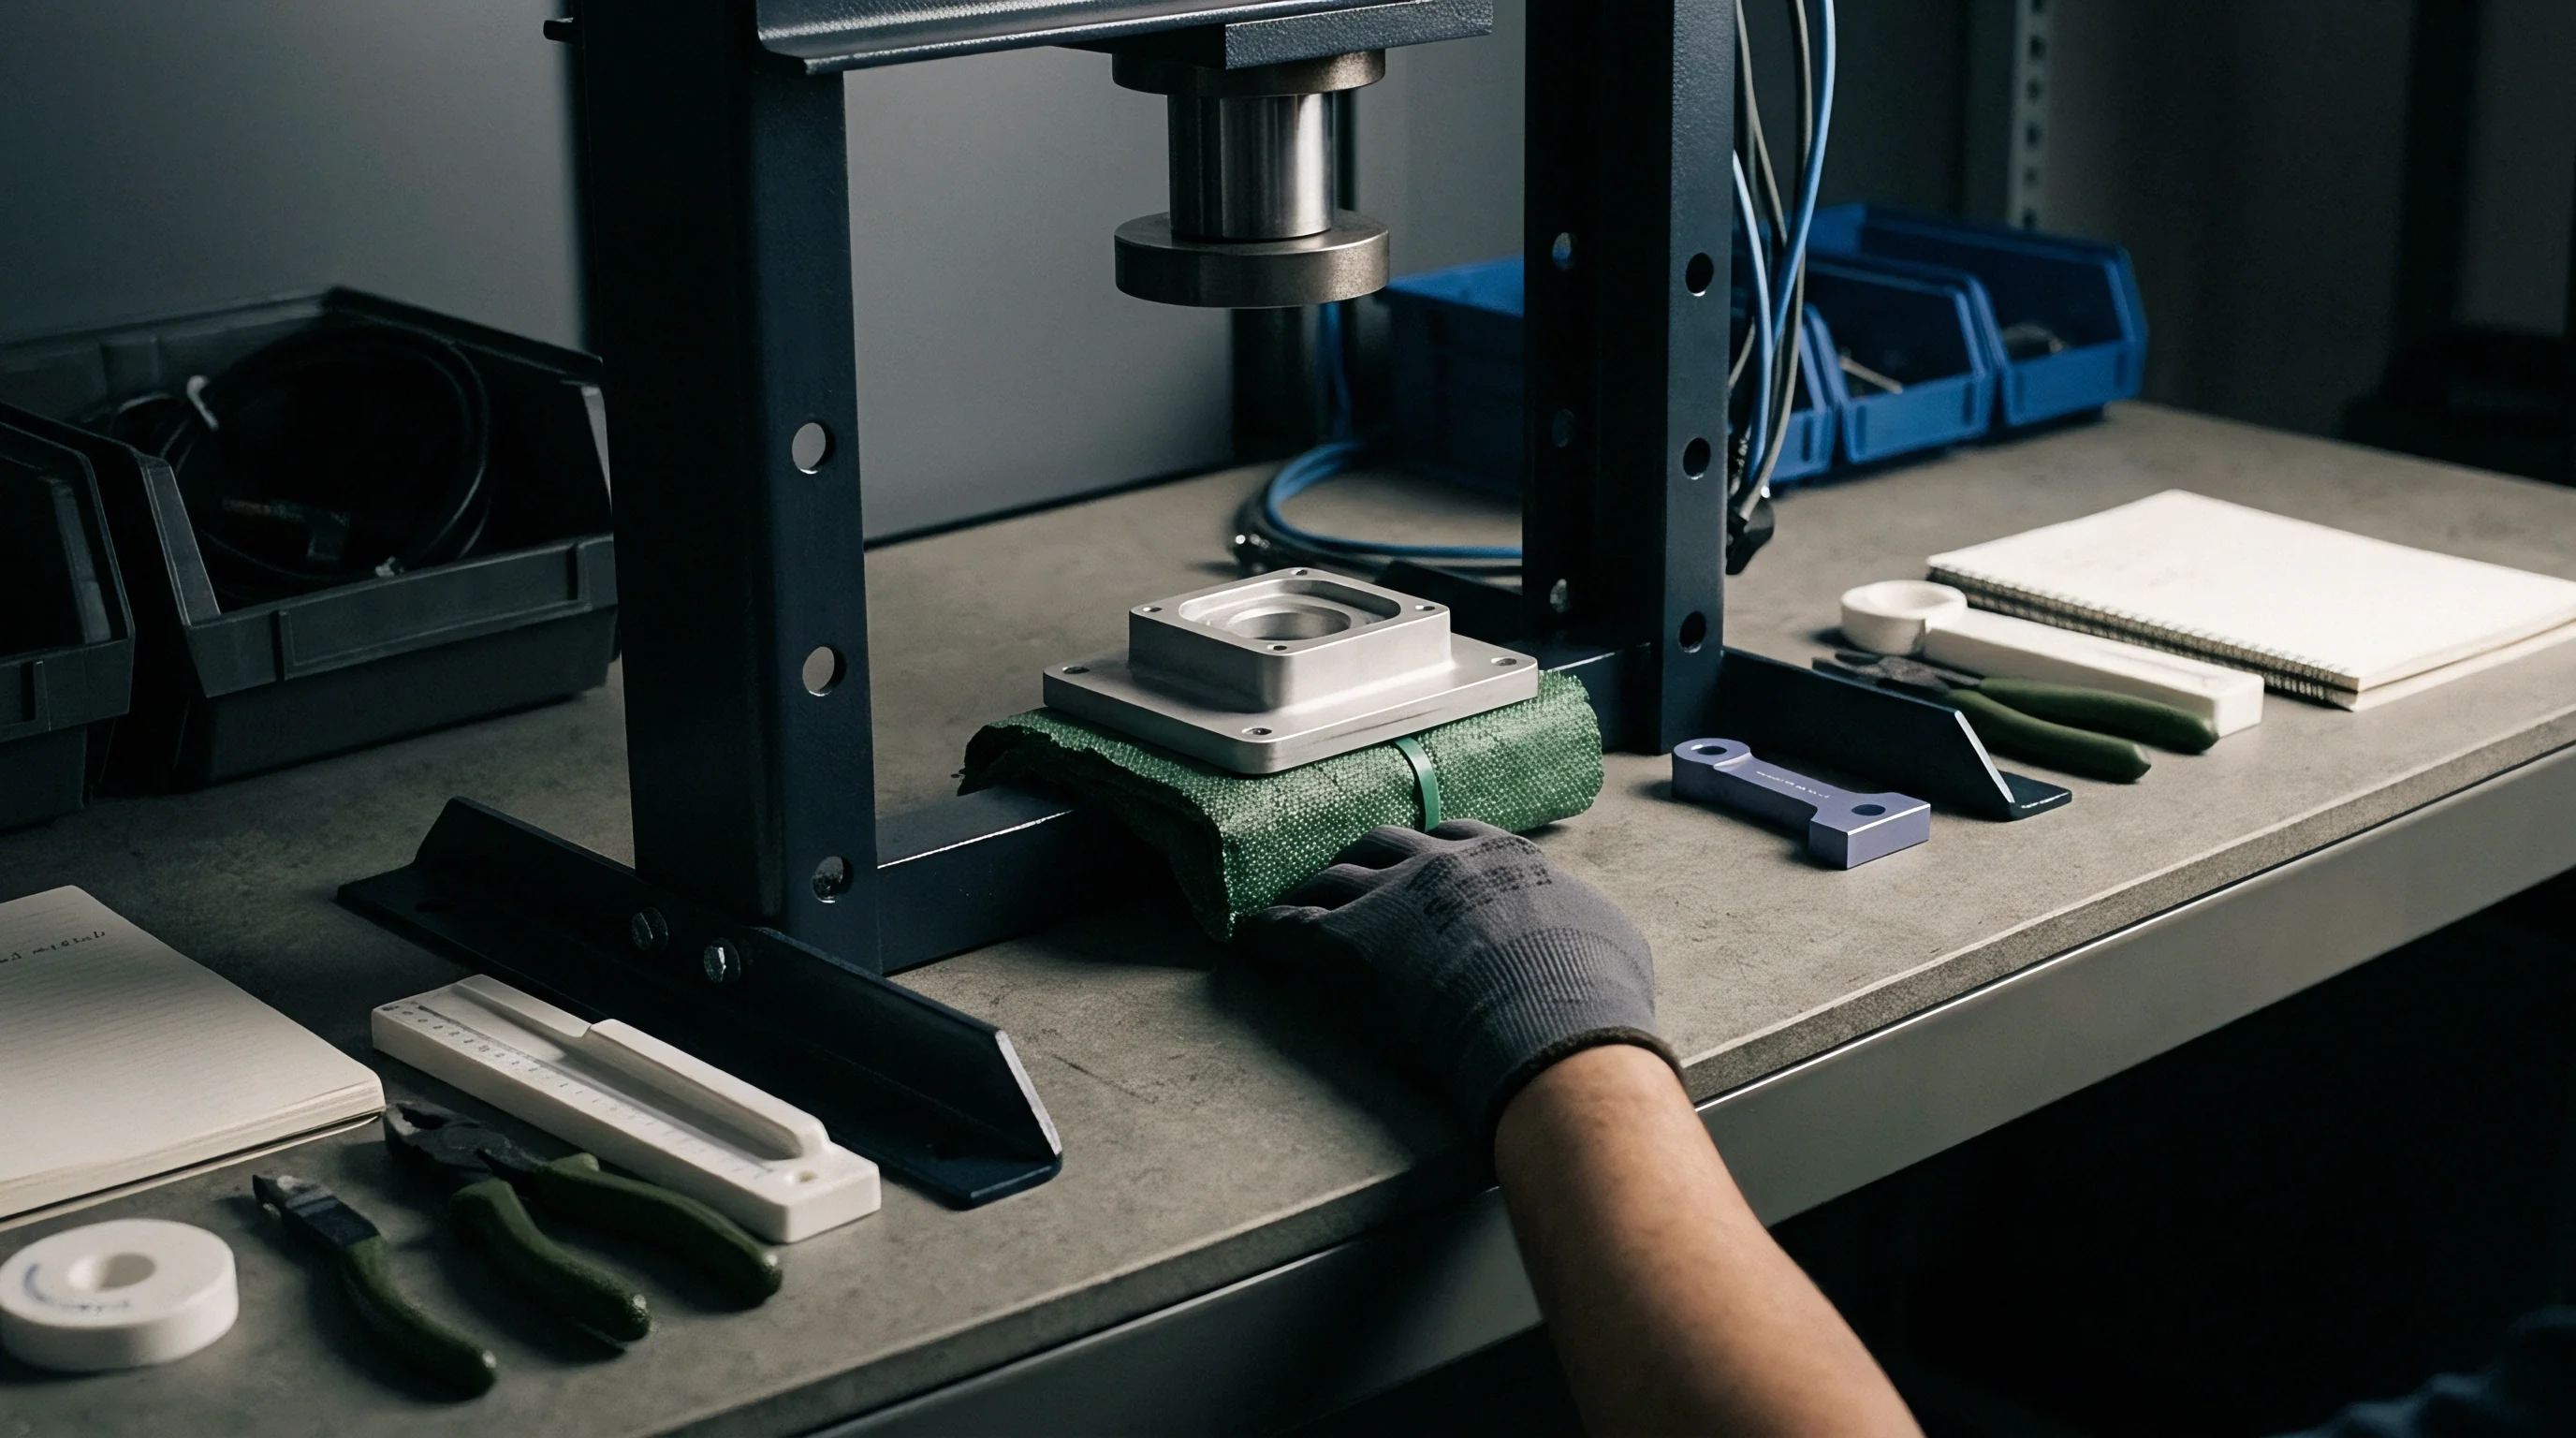
Synthetic elastomers formulated for replication metrology depend on controlled crosslinking kinetics to achieve sub-micron volumetric and spatial fidelity. Vinyl polysiloxane and polyether compounds represent the primary chemistries used for indirect topography extraction. Applied under ambient or low manual pressure, these materials flow into deep surface micro-crevices, wet the metallic substrate completely, and cure into dimensionally stable solids with minimal linear shrinkage.
Offloading the physical measurement from the factory press floor avoids the vibration, oil contamination, and thermal swings that corrupt direct optical interferometry.
Elastomeric Material Chemistry and Crosslinking Dynamics
A metrological replicating compound’s chemical formulation sets its spatial resolution, tear strength, and elastomeric recovery. Polyaddition vinyl polysiloxanes undergo hydrosilylation during cure, as vinyl-functionalized polydimethylsiloxane polymer chains react with hydride-functional siloxanes in the presence of a platinum complex catalyst. Polymerization occurs without releasing volatile reaction side-products, preventing gas bubble nucleation within the curing bulk material.
Minimal volumetric distortion results directly from this additive crosslinking mechanism.
Polyether replicating compounds rely on cationic ring-opening polymerization of aziridine-functional oligomers. Crosslinking produces a rigid, highly polar matrix with exceptionally high tensile stiffness compared to silicone elastomers. This higher matrix rigidity prevents structural bending when measuring high-aspect-ratio features, though polyether compounds demonstrate increased sensitivity to atmospheric moisture absorption prior to full cure.
Comparative physical parameters of primary replicating polymers appear in the table below.
| Polymer Family | Chemical Crosslinking Base | Linear Shrinkage Percentage | Dynamic Surface Resolution | Shore A Hardness | Viscosity at Injection |
|---|---|---|---|---|---|
| Vinyl Polysiloxane (Low Viscosity) | Platinum-catalyzed addition siloxane | 0.05 percent | 0.02 microns | 45 to 50 | 12,000 mPa s |
| Vinyl Polysiloxane (High Stiffness) | Platinum-catalyzed addition siloxane | 0.08 percent | 0.05 microns | 70 to 75 | 85,000 mPa s |
| Polyether Elastomer | Cationic ring-opening aziridine | 0.12 percent | 0.04 microns | 60 to 65 | 35,000 mPa s |
| Methyl Methacrylate Resin | Free-radical peroxide acrylic | 0.45 percent | 0.10 microns | 85 to 90 | 5,000 mPa s |
Mixing ratio accuracy governs crosslinking density and free monomer content in cured elastomeric impressions. Automixing dispensing nozzles force equal volumetric streams through dynamic helical mixing elements, guaranteeing stoichiometric parity between catalyst and base components. Manual mixing introduces local stoichiometry gradients, resulting in unreacted silicone oil phase separation that bleeds onto the replica surface and masks true sub-micron steel roughness.

Polymerization Shrinkage and Rheological Cavity Infiltration
Liquid polymer compounds entering micro-topographical valleys encounter resistance driven by dynamic surface tension and fluid viscosity. Surface wetting behavior depends on the critical surface energy of the tool steel ~ typically between 35 and 45 millinewtons per meter for unpolished P20 or H13 tool steel ~ relative to the liquid resin surface tension. Fluorinated wetting surfactants incorporated into high-grade vinyl polysiloxane formulations depress liquid surface tension below 22 millinewtons per meter, enabling spontaneous capillary flow into steep electro-discharge machining pits.
Two-component vinyl polysiloxane compounds achieve dynamic surface reproduction fidelity down to twenty nanometers when cured under two bar ambient pressure at twenty-two degrees Celsius.
Polymerization shrinkage proceeds through two distinct regimes: dynamic shrinkage during gelation and thermal relaxation post-cure. Gelation marks the transformation from a viscous liquid to a viscoelastic gel, occurring within three to five minutes for standard room-temperature vulcanizing siloxanes. Linear contraction occurring prior to the gel point draws material freely from the bulk reservoir without generating internal tensile strain.
Post-gelation shrinkage generates residual tensile stress within the replica volume, pulling material slightly away from steep vertical cavity walls.
Ambient humidity during silicone mixing alters elastomeric crosslinking density. Excessive moisture accelerates polyether gelation while inhibiting certain platinum-catalyzed siloxane systems, increasing the risk of tacky surfaces. Maintaining a controlled metrology preparation environment keeps dimensional drift strictly bounded within standard calibration limits.

Bubble Evacuation Mechanics and Surface Degassing
Trapped atmospheric air between the fluid polymer and the steel substrate creates rounded voids on the replica surface, obscuring real tool micro-geometry. Dispensing protocols require continuous tip immersion beneath the advancing liquid front to prevent air entrapment during manual injection. Dynamic pressure application during the liquid state forces trapped micro-bubbles into solution within the uncured polymer matrix, suppressing surface void creation.
High-aspect-ratio optical scale features and narrow rib bases demand active degassing protocols before chemical gelation locks liquid geometry. Application of moderate pneumatic pressure around the curing impression forces residual gas pockets to collapse completely against the cavity surface. The following casting failure modes impair geometric fidelity when preparation conditions deviate from established environmental windows:
- Interfacial Micro-Pores form when low application pressure fails to overcome air viscosity in narrow tool textures, creating circular depressions across optical profiles.
- Chemical Inhibition Layers occur when residual sulfur compounds or chlorinated cleaning solvents on the steel surface poison the platinum catalyst, leaving a non-crosslinked liquid film at the interface.
- Tear Line Artefacts manifest during mechanical demoulding when local tensile shear stress exceeds material tear strength, leaving torn polymer fragments embedded inside deep tool undercuts.
- Elastic Recovery Distortion appears when operators pull the cured replica over draft angles under two degrees before crosslinking reaches ninety percent completion.
- Exothermic Thermal Expansion distorts gross cross-sectional dimensions when acrylic resins cure in bulk masses exceeding ten millimeters in thickness.

Curing Thermal Expansion and Dimension Stabilization
Temperature control during casting and curing directly impacts macroscopic dimensional accuracy. Uncured silicone polymers exhibit volumetric coefficients of thermal expansion near 300 times ten to the minus sixth per Kelvin, exceeding tool steel thermal expansion by more than twenty times. Ambient temperature elevation during exotherm or room heating causes thermal expansion during crosslinking, followed by thermal contraction as the cured polymer cools to standard measurement temperatures.
Demoulding too early damages micro-topographical features through plastic shear deformation of unlinked polymer chains. Fully cured siloxanes reach a stable mechanical modulus after twenty minutes at 22 degrees Celsius, where elastic recovery exceeds 99.8 percent. Standardizing cure duration prior to mechanical extraction ensures spatial repeatability across serial tool wear evaluations.
Failing to maintain isothermal room conditions during elastomeric crosslinking induces gross dimensional skew across large optical replicas, resulting in incorrect waviness parameter calculations that invalidate tool signoff documentation.


Scan
Optical profilometry on elastomeric impressions requires matching the optical signal to non-metallic surface properties. Elastomeric replicas lack the high specular reflectivity of polished tool steel, exhibiting diffuse scattering combined with internal optical subsurface scattering. Measuring soft, flexible impressions without mechanical contact eliminates stylus penetration marks, preserving delicate sub-micron replica features for repeated baseline audits.
Coherence scanning interferometry, focus variation profilometry, and confocal laser scanning microscopy operate as the three principal non-contact measurement modalities for replica surface evaluation. Each optical method interacts uniquely with silicone and polyether surfaces. Modality selection depends directly on local surface slope, surface roughness magnitude, and material optical transparency.

Optical Profilometry Modal Selection Physics
Coherence scanning interferometry uses localized light interference fringes produced by a broadband light source split between a reference mirror and the optical sample. Scanning the interference objective vertically along the optical Z-axis yields a localized fringe envelope whose intensity peak identifies precise height values at each pixel location. CSI achieves sub-nanometer vertical resolution independent of field-of-view size, making it the premier method for mirror-polished cavity replicas.
Focus variation profilometry varies the working distance between a precise optical objective and the sample surface while continuously capturing high-resolution two-dimensional images. Standard focus algorithms calculate local image contrast across neighboring pixels, mapping maximum contrast positions to discrete height coordinates. Focus variation excels on rough, highly scattering surfaces with steep local slope angles up to 80 degrees, though vertical resolution degrades rapidly on smooth surfaces exhibiting low contrast.
| Measurement Modality | Vertical Resolution | Lateral Spatial Resolution | Maximum Surface Slope Angle | Primary Surface Compatibility |
|---|---|---|---|---|
| Coherence Scanning Interferometry (CSI) | 0.1 nanometers | 0.35 microns | 15 degrees (specular) | Mirror-polished SPI A-1 to A-3 replicas |
| Focus Variation (FV) | 10 nanometers | 0.45 microns | 85 degrees (diffuse) | Textured, VDI 24 to 45, EDM replicas |
| Confocal Laser Scanning (CLSM) | 1.0 nanometers | 0.20 microns | 70 degrees (mixed) | Micro-structured and high-aspect features |
| Chromatic Confocal Imaging (CCI) | 2.5 nanometers | 1.10 microns | 45 degrees (mixed) | General tool wear and step-height replicas |
Confocal laser scanning microscopy restricts out-of-focus light by placing a physical pinhole aperture in the conjugate focal plane of the microscope objective. Scanning a focused laser beam laterally across the replica builds precise optical sections, yielding clean height maps across steep micro-structures. Signal loss from internal light scattering within semi-translucent siloxanes requires careful selection of laser wavelength and signal detection thresholds.

Where Do Focus Variation Systems Fail on High Gloss Replicas?
Smooth surfaces generated by optical diamond polishing lack the fine spatial high-contrast features required by focus detection algorithms. When evaluating a replica of an SPI A-1 optical lens cavity, a focus variation profilometer encounters field regions with near-zero intensity contrast between adjacent optical sensor pixels. The system fails to pinpoint the focal plane reliably, generating artificial dropouts, pseudo-roughness spikes, or flat signal voids across the raw dataset.
Interferometric modalities overcome contrast limits by generating artificial optical interference fringes regardless of intrinsic surface texture contrast. CSI optics focus light interference directly onto mirror-like polymer surfaces, rendering sub-nanometer surface texture details visible. Opaque pigment loading inside the replicating polymer reduces internal light penetration, increasing fringe visibility on smooth optical impressions.
Angle Limits and Slope Compensation in Coherence Scanning
High numerical aperture objectives capture wide light scattering cones, extending the maximum measurable slope angle on rough surfaces. Standard objective lenses collect reflected light rays up to an angle governed by the lens numerical aperture: the sine of the acceptance angle equals the numerical aperture divided by the ambient refractive index. Rays reflected beyond this angular threshold fail to return through the optical train, causing total signal loss on steep cavity sidewalls.
Adherence to ISO 25178-600 calibration routines prevents spatial frequency aliasing during high-slope optical measurements on elastomeric surface impressions.
Measuring steep slope geometry requires tilting the replica fixture or utilizing chromatic confocal sensors equipped with specialized high-angle optics. Polyether elastomers pigmented with carbon black or titanium dioxide attenuate internal optical reflections, sharpening the reflected surface beam. Standardizing optical illumination settings and detector shutter times maintains continuous signal integrity across varying replica surface inclinations.
Select the appropriate system using the operational parameters below:
- Specular Smooth Surfaces (Sa under 0.05 microns) require coherence scanning interferometry equipped with a ten times or twenty times Mirau objective to preserve nanometer-level Z-resolution.
- Micro-Structured Surfaces (Rz between 1 and 10 microns) demand confocal laser scanning microscopy to accurately capture narrow, deep groove geometry without spatial edge distortion.
- Heavy EDM and Rough Tool Surfaces (Sa over 1.6 microns) require focus variation instruments using high numerical aperture objectives to capture scatter at slope angles exceeding sixty degrees.
- Deep Cavity Under-Cuts and Cross-Sections necessitate physical replica sectioning using a precision microtome blade before mounting under flat optical measurement stages.

Inverted Topography Signal Processing and Inversion Phase Errors
Topographic profiles extracted from elastomeric impressions exist as exact spatial inversions of the parent steel surface. Pits, scratches, and electro-discharge machining craters on the mould steel transform into raised peaks, ridges, and domes on the polymer replica. Digital profilometry software must execute an inverted Z-axis mathematical transform (multiplying all height arrays by negative one) before calculating standardized surface parameters.
Reversing height data without properly shifting spatial registration leads to false identification of surface wear features. A deep scratch on a core pin appears as a pronounced peak in raw replica scans; failing to invert the dataset misclassifies steel gouges as positive material additions. Software inversion scripts must apply coordinate inversion across the entire spatial array simultaneously, maintaining true right-handed Cartesian coordinate relationships.
Light penetration into semi-transparent silicone introduces optical phase shifts, causing the optical sensor to detect an apparent surface reflection location located several nanometers below the physical polymer-air interface.
Raw optical profilometer scans on unpigmented transparent silicone replicas do not match direct stylus measurements, as severe optical penetration errors artificially inflate measured surface roughness figures.


Filter
Spatial height arrays extracted from optical profilometers combine microscopic surface roughness, structural waviness, and gross geometrical form errors into a single composite dataset. Polymer molding performance, melt flow friction, and part ejection forces depend on distinct spatial frequency bands within this raw surface topography. Deriving meaningful surface metrics requires standardized digital filtering based on ISO 25178 standards to isolate functional roughness features from underlying tool surface curvature.
Three-dimensional areal surface texture parameters provide a comprehensive spatial description of tool steel topography compared to legacy two-dimensional line profiles. A single line profile misses localized pitting, directional polishing scratches, and spatial anisotropy within complex mould cavities. Areal parameter evaluation processes the entire volumetric surface distribution, delivering statistically reliable quality metrics for tool release performance and surface finish compliance.
ISO 25178 Parameter Derivation for Injection Tooling
Areal height parameters describe overall surface deviation relative to a mean reference plane. Arithmetical mean height, designated as Sa, quantifies the average absolute height deviation across the evaluated sampling area. Root mean square height, designated as Sz, measures the distance between the highest peak and deepest pit within the defined evaluation boundary.
While Sa provides a baseline comparison, it remains insensitive to isolated spatial defects like local gouges or micro-cracks.
Spatial parameters and hybrid parameters supply critical functional insight into mould release dynamics. Skewness, designated as Ssk, measures the asymmetry of the height distribution profile around the mean plane. Negative Ssk values indicate a surface dominated by deep fluid-retaining valleys, ideal for holding mold release lubricants.
Kurtosis, designated as Sku, quantifies the spikiness of the profile; Sku values above three indicate sharp surface peaks that increase mechanical interlocking with cooling thermoplastic melts, elevating part ejection forces.
| Parameter Symbol | Parameter Name | Mathematical Basis | Mould Functional Significance |
|---|---|---|---|
| Sa | Arithmetical Mean Height | Average absolute height value across evaluation area | General surface finish quality verification indicator |
| Sz | Maximum Height | Sum of maximum peak height and maximum pit depth | Identifies extreme electro-discharge machining pits or gouges |
| Ssk | Surface Skewness | Third central moment of height probability density | Distinguishes sharp peaks (ejection drag) from deep valleys |
| Sku | Surface Kurtosis | Fourth central moment of height probability density | Quantifies peak sharp-ness affecting mechanical interlocking |
| Sdq | Root Mean Square Slope | RMS value of surface local slope across evaluated area | Correlates directly with melt surface friction and optical haze |
| Str | Spatial Texture Aspect Ratio | Ratio of shortest to longest autocorrelation decay distance | Measures surface texture directionality (isotropic vs lay) |
| Vmp | Peak Material Volume | Volume of material contained in extreme surface peaks | Predicts initial tool running-in wear and abrasive shedding |

Gaussian Filtering Protocols and Cutoff Wavelength Selection
Separating surface roughness from long-wavelength form variations requires robust digital filters designed for three-dimensional spatial datasets. Phase-correct Gaussian filters apply an isotropic spatial frequency weighting function that suppresses high-frequency instrument noise and long-frequency structural form without introducing spatial phase shifts. Setting the nesting index, or cutoff wavelength lambda-c, determines the precise spatial frequency boundary separating roughness from waviness.
Selecting an incorrect nesting index severely alters calculated surface metrics. Applying an excessively small cutoff filter suppresses true micro-roughness features, underreporting tool friction parameters. Applying an overly large cutoff filter includes gross cavity curvature within the roughness calculation, artificially inflating Sa metrics.
Recommended filtering procedures for indirect cavity metrology follow a standardized sequence:
- Load the raw inverted height array extracted from the optical profilometer into an ISO 25178 compliant evaluation software module.
- Execute a primary spatial S-filter to remove spatial noise frequencies smaller than the lateral optical resolution of the instrument sensor.
- Apply an F-operator polynomial surface fit to remove macroscopic geometrical form and tilt caused by mechanical sample mounting alignment.
- Select the nesting index filter lambda-c based on expected tool surface texture range, setting lambda-c to 0.8 millimeters for standard polished steel surfaces.
- Apply the phase-correct Gaussian L-filter to split the levelling-corrected dataset into isolated roughness and waviness surface components.
- Extract functional areal parameters, including Sa, Sz, Ssk, and Sdq, directly from the isolated roughness surface file.

Separation of Spatial Waviness and Form Errors
Mould cavities subject to high mechanical clamping forces and thermal cycling develop long-wavelength spatial waviness over extended production runs. Waviness features, designated by Wa or Sa-waviness metrics, reflect structural tool deflection, cutter deflection during CNC milling, or non-uniform manual polishing. Distinguishing surface waviness from fine surface roughness isolates tool machining defects from final surface polishing stages.
Filtering elastomeric cavity impressions with a cutoff wavelength equal to five times the average feed mark spacing isolates structural waviness from micro-roughness without distorting peak geometry.
Robust Gaussian regression filters prevent edge distortion when processing datasets containing missing data points or complex boundaries. Traditional Gaussian filters experience end-effect distortion near scan edges, requiring edge truncation that reduces usable measurement area. Regression filtering algorithms calculate local spatial polynomials, preserving accurate parameter calculations up to the physical boundaries of the elastomeric impression.

Functional Volume Parameters in Texture Evaluation
Areal functional volume parameters, derived from the material ratio curve (Abbott-Firestone curve), quantify the actual volume of space occupied by surface peaks and valleys. Peak material volume, designated Vmp, calculates the volume of solid material located above the ten-percent material ratio threshold. Pit void volume, designated Vvv, quantifies the fluid-retaining volume located within the deepest surface valleys.
Evaluating Vmp and Vvv metrics across serial replica impressions enables direct tracking of tool wear progression. As sharp tool steel peaks erode during high-volume injection molding of glass-filled polymers, Vmp decreases predictably while Vvv remains constant. Tracking material volume metrics provides early warning of tool surface degradation long before dimensional deviations manifest on finished plastic components.
How do metrologists reliably isolate localized optical reflection artifacts from true surface micro-pits on high-aspect polyether cavity impressions?


Etch
Injection moulding tool surfaces suffer continuous mechanical, thermal, and chemical degradation throughout volume production cycles. Abrasive filler materials like glass fibers or mineral spheres induce micro-scale mechanical erosion across high-velocity melt flow paths and gate areas. Corrosive off-gassing from fluoropolymers or flame-retardant resins attacks microscopic steel grain boundaries, degrading polished optical finishes.
Tracking tool degradation through scheduled elastomeric replication protocols establishes preventive tool maintenance windows without requiring invasive tool removal from the molding machine.
Periodic cavity replica sampling builds a quantitative historical record of localized wear rates, pitting severity, and surface texture decay. Comparing serial spatial profiles against baseline T1 sample replicas isolates tool degradation mechanisms before component aesthetic defect limits are breached. Surface profile tracking enables toolroom managers to schedule localized polishing or re-etching during planned downtime, preventing catastrophic tool failure during active production runs.

Tool Steel Degradation and Recast Layer Erosion
Electro-discharge machining creates a distinct thermal boundary structure consisting of a brittle recast white layer above a heat-affected zone on tool steel surfaces. The recast layer contains high residual tensile stresses, micro-cracks, and altered carbide phase distributions. High-cycle thermal fatigue and mechanical impact during injection moulding cause micro-spalling of this un-annealed recast layer, releasing microscopic steel particles into the melt stream and leaving jagged surface cavities.
Replication metrology captures the gradual erosion of the EDM recast structure across sequential production cycles. Baseline optical profilometry on T0 tool impressions reveals characteristic sharp-edged EDM crater rims. Scanning impressions taken after 100,000 injection cycles shows crater rim rounding, micro-crack expansion, and localized material loss, permitting direct mathematical calculation of linear wear rates in micrometers per hundred thousand cycles.

Chemical Etching Decay and Wear Pattern Mapping
Chemically textured tool surfaces produced by acid etching generate specific tactile textures like Mold-Tech or VDI patterns. Corrosive polymer additives and abrasive melt flow gradually degrade these micro-etched textures, blunting sharp texture peaks and smoothing high-frequency spatial features. Chemical decay alters local surface gloss levels on molded plastic parts, creating non-uniform aesthetic patches across show-surface regions.
Areal surface slope metrics, specifically Sdq, and peak sharpness metrics map chemical etching degradation with extreme sensitivity. A fresh chemically etched texture exhibits high Sdq values due to steep, clean grain boundaries. As melt erosion and chemical attack smooth these boundaries, Sdq values decrease monotonically, providing a reliable threshold index for scheduling chemical re-etching treatments.
Integrated tool maintenance tracking requires standardized replica documentation protocols within the quality management system. Maintenance engineers must include complete process metadata alongside each extracted replica file to ensure cross-audit traceability. The required documentation items appear in the list below:
- Tool Identifiers including unique mould serial numbers, cavity position indices, and target component feature designations.
- Production Cycle Counters capturing exact shot counts at the moment of replica impression extraction.
- Polymeric Material Identifiers documenting resin grade, filler percentage, and processing temperatures recorded during the preceding run.
- Replication Process Metadata defining compound batch number, ambient room temperature, relative humidity, and cure duration.
- Metrology Sensor Parameters detailing instrument serial number, objective lens magnification, spatial sampling interval, and Gaussian filter cutoff settings.

Periodic Cavity Sampling and Replication Interval Timing
Establishing appropriate replica sampling intervals balances inspection costs against risk exposure during high-volume production runs. High-wear applications processing 30 percent glass-reinforced polyamides require frequent replication sampling around high-velocity gate areas, whereas un-filled polypropylene closure tools tolerate extended inspection intervals. Baseline replicas must be extracted during initial T1 tool qualification trials to lock in the absolute tool surface state.
Replication sampling frequencies scale directly with polymer abrasive potential and specified surface quality tolerances. Recommended sampling intervals for common molding configurations appear in the table below.
| Tooling Application Class | Processed Polymer Material | Dominant Wear Mechanism | Replication Sampling Interval | Critical Monitoring Parameter |
|---|---|---|---|---|
| Optical Class (SPI A-1 / A-2) | Unfilled PMMA / PC | Chemical haze and micro-scratching | Every 25,000 cycles | Sa, Sz, Peak height distribution |
| Aesthetic Textured Class | ABS / PC-ABS blend | Peak blunting and local gloss decay | Every 100,000 cycles | Sdq, Sku, Material volume Vmp |
| Engineering Structural Class | 30% Glass-Filled PA66 | Abrasive erosion around gates | Every 50,000 cycles | Sz, Linear wear depth, Gate profile |
| High-Volume Packaging Class | Unfilled HDPE / PP | Frictional wear on parting lines | Every 500,000 cycles | Step height wear, Parting line denting |

Replication Metrology Integration in Tool Maintenance Schedules
Integrating elastomeric replication metrology into standard preventive tool maintenance programs eliminates reliance on subjective operator visual checks. Toolroom technicians pull replica impressions directly from target cavity locations during routine mold cleaning intervals while the tool remains mounted in the press or resting on the maintenance bench. Optical profilometry scans executed in the quality laboratory quantify exact surface degradation rates, generating objective predictive maintenance alerts.
Tracking spatial wear maps over successive production runs pinpoints non-uniform melt distribution across multi-cavity tool geometries. Accelerated wear in specific runner branches indicates unbalanced flow front velocities or localized thermal hot spots that demand gating or cooling channel modification.
Cavity wear rate acceleration signals impending surface coating breakdown long before dimensional wall thickness limits fail.

Proof
Commercial acceptance of high-precision injection tooling relies heavily on quantitative proof of cavity surface compliance. Disputes between tier-one plastic molders and international toolmakers frequently center on alleged cavity surface finish deficiencies. Direct profilometry on large, heavy tool steel blocks presents severe logistical challenges and introduces high measurement uncertainty due to environmental instability on factory floors.
Indirect optical profilometry performed on standardized elastomeric cavity replicas provides legally defensible metrological evidence, provided the entire measurement chain follows traceable uncertainty protocols.
Validating indirect optical metrology requires rigorous quantification of the entire measurement uncertainty budget. Metrologists must account for polymer shrinkage variations, temperature-induced expansion stack-ups, optical system noise, and spatial filtration errors. Establishing documented traceability to national metrology institutes transforms replica profiling into an authoritative tool signoff mechanism that protects both tool builder and component buyer.

Uncertainty Stack up in Replica Metrology Chains
Combined standard measurement uncertainty for indirect cavity topography extraction sums individual variance components in quadrature according to ISO/IEC Guide 98-3 guidelines. Primary uncertainty sources split into polymer replication physics and optical profiling measurement errors. Material variance stems from batch-to-batch polymer linear shrinkage instability, local thermal expansion during curing, and incomplete elastic recovery after demoulding.
Instrumental uncertainty contributions include optical sensor calibration bias, Z-axis displacement non-linearity, lateral stage step accuracy, and optical noise floors. Environmental temperature fluctuations during optical scanning induce physical expansion of the polymer substrate, introducing linear drift across extended scan grids. Quantified uncertainty budget components for a typical high-precision replica profilometry protocol appear in the table below.
| Uncertainty Source Designation | Probability Distribution | Standard Uncertainty Value | Sensitivity Coefficient | Uncertainty Contribution |
|---|---|---|---|---|
| Polymer Linear Shrinkage Variation | Rectangular | 0.012 percent | 1.00 | 0.024 microns |
| Replication Thermal Drift (22 ± 1°C) | Normal | 0.008 microns/K | 1.00 | 0.008 microns |
| Optical Instrument Height Calibration | Normal | 0.005 microns | 1.00 | 0.005 microns |
| Instrument Optical Noise Floor | Rectangular | 0.002 microns | 1.00 | 0.002 microns |
| Gaussian Filter Nesting Index Bias | Normal | 0.004 microns | 1.00 | 0.004 microns |
| Operator Demoulding Strain Variance | Normal | 0.010 microns | 1.00 | 0.010 microns |
Summing these variance components yields an expanded combined measurement uncertainty of approximately 0.056 microns for Sa parameters at a 95 percent confidence coverage factor of k equals two. Combining material shrinkage variance with instrument noise across calibrated reference standards establishes measurement uncertainty. This expanded uncertainty figure defines the hard boundary for verifiable tool surface compliance assertions.
Cross-Laboratory Alignment and ISO 17025 Conformance
Resolving surface compliance disputes between international procurement teams and offshore tool shops requires certified cross-laboratory measurement alignment. Quality laboratories executing replica profilometry must operate under ISO/IEC 17025 accreditation scopes explicitly covering areal surface texture parameters. Measurement protocols must specify exact instrument optical settings, illumination intensity, lateral pixel resolution, and filtering software versions to guarantee inter-laboratory reproducibility.
Round-robin verification trials using certified physical calibration standards align optical profilometers across disparate facilities. Transfer standards containing etched rubert lines, sinusoidal grids, and step-height features provide traceable verification of instrument lateral and vertical axes. Calibrating both direct steel measurement sensors and replica scanning procedures against identical transfer standards isolates instrument systematic bias from replica casting material errors.

Thermal Expansion and Material Shrinkage Compensation
Accurate macroscopic feature evaluation on elastomeric impressions demands precise mathematical compensation for material shrinkage and thermal expansion stack-ups. Polymer casting compounds exhibit linear expansion coefficients exceeding tool steel by an order of magnitude. If an elastomeric impression cures at 25 degrees Celsius in an unconditioned toolroom and undergoes optical measurement at 20 degrees Celsius in a metrology laboratory, thermal contraction significantly reduces measured feature spacing.
Mathematical scaling factors applied inside profilometry evaluation software correct linear dimension shrinkage prior to feature extraction. The complete linear scaling correction factor, K-corr, combines tool steel thermal expansion, polymer crosslinking shrinkage, and polymer thermal contraction according to the formula:
K-corr = 1 + S-lin + (alpha-poly times (T-cure – T-meas)) – (alpha-steel times (T-tool – T-meas))
Where S-lin represents linear chemical shrinkage, alpha-poly and alpha-steel denote linear thermal expansion coefficients, T-cure represents curing temperature, T-meas represents lab measurement temperature, and T-tool denotes steel temperature at casting. Applying this dimensional scale correction guarantees accurate step-height and lateral pitch extraction across varying ambient casting environments.
Supplier Metrology Clauses and Tool Acceptance Terms
Procurement contracts for high-precision injection tooling must explicitly define indirect surface metrology protocols within technical signoff specifications. Generic drawing notes referencing unstandardized surface callouts generate ambiguity that prevents legal enforcement when surface defects cause part ejection failures. Contractual metrology clauses must detail replication material chemistries, sampling locations, optical profilometry modalities, and ISO 25178 parameter limits.
Incorporating explicit metrology language into tooling supply agreements establishes definitive acceptance criteria before cutting steel. A robust contract enforcement clause specifies: Mould cavity surface compliance verification shall be performed via indirect optical profilometry on two-component vinyl polysiloxane replicas cured under controlled ambient conditions of 22 ± 2 degrees Celsius. Topography evaluation shall conform strictly to ISO 25178-2 and ISO 25178-3 protocols utilizing a phase-correct Gaussian filter with a nesting index lambda-c of 0.8 millimeters.
Tool release approval requires that all measured areal roughness parameters (Sa, Sz, Ssk) across designated optical show-surface zones fall strictly within specified upper and lower specification limits, taking into account an expanded measurement uncertainty budget of 0.06 microns.
Direct optical scanning of deeply recessed injection mould features introduces significant phase distortion that elastomeric replica casting entirely eliminates.
Commercial purchase orders incorporating explicit ISO 25178 indirect replication protocols mandate immediate tool rework at the supplier’s expense whenever replica parameter scans reveal Sa deviations exceeding specified engineering drawing bounds.