Tool Steel Wear Quantification under High Glass Filler Loading
High glass filler loading causes severe matrix wash-out and gate land expansion, requiring powder metallurgy steels or carbide inserts to maintain tolerances.

Melt
Rheological Shear and Fiber Fracture Mechanics
High glass filler loading transforms liquid polymer carrier resin into a abrasive slurry during injection moulding. Polyamide 66, polybutylene terephthalate, and polyether ether ketone formulations containing 40% to 60% chopped glass fiber by weight produce severe wall friction inside runners, gates, and cavity lands. Glass fibers typically possess an initial log-normal length distribution centered between 250 and 400 micrometers with a uniform diameter of 10 to 13 micrometers.
As the fluid enters high-shear zones where shear rates exceed 15,000 reciprocal seconds, intense hydrodynamic stresses snap fibers into shorter fragments. Broken fiber ends present sharp, un-lubricated cross-sections that directly contact tool steel surfaces.
Boundary layer mechanics dictate the rate at which moving fillers scour cavity surfaces. Polymer melt flows through a channel via a velocity profile where liquid adjacent to the steel wall exhibits near-zero velocity under ideal conditions. Solid glass inclusions exceed the thickness of this visual boundary layer.
Glass filaments rotate, tumble, and migrate transversally across stream lines under high transverse velocity gradients. High-aspect ratio glass filaments hammer against steel surface asperities at impingement points. Micro-machining begins when local contact pressure between hard glass fibers (Mohs hardness 6.5, structural hardness approximately 550 to 650 HV) exceeds the yield strength of the steel matrix.
Melt viscosity drops under severe shear thinning, which reduces the hydrodynamic cushioning effect of the polymer matrix. At 50% glass weight fraction, the volumetric filler concentration reaches approximately 32%. Particle-to-particle interactions become dominant.
Glass filaments lock together in transient mechanical networks, forcing solid fibers into high-stress mechanical contact with cavity walls. Wear rates accelerate dramatically at core pins, gate inserts, and flow deflectors where the melt front turns sharp corners.

Abrasive, Erosive, and Corrosive Wear Interplay
Tooling degradation under heavily filled resin streams occurs through three simultaneous physical mechanisms. Two-body abrasion takes place when glass fibers embedded in the viscous core scrape parallel along the steel surface. Three-body abrasion occurs when detached metal particles or fractured glass debris roll between the bulk melt stream and the cavity wall, gouging micro-grooves into the tool surface.
Hydrodynamic erosion strips away softened or damaged micro-layers under localized high-velocity impact, particularly directly opposite sub-surface or edge gates.
Thermo-chemical wear worsens mechanical damage when processing temperatures exceed 300 degrees Celsius. High shear heating at narrow gate constrictions thermalizes resin degradation products. Halogenated flame retardants, residual monomers, and outgassed volatile acids attack the microstructural matrix of un-passivated steels.
Corrosive pit formation removes iron atoms from surrounding carbide grains. Mechanical fluid shear then strips unanchored carbides out of the weakened matrix, leaving microscopic voids that collect further corrosive condensates and accelerate surface micro-spalling.
| Filler Fraction (Weight %) | Volumetric Glass Ratio (%) | Effective Viscosity Shift at High Shear | Dominant Surface Wear Mechanism | Relative Tool Wear Multiplier |
|---|---|---|---|---|
| 30% Glass Fiber | 17.5% | 1.8x base polymer | Two-body sliding abrasion | 1.0x baseline |
| 40% Glass Fiber | 24.8% | 2.9x base polymer | Two-body abrasion and gate impingement erosion | 2.8x baseline |
| 50% Glass Fiber | 32.6% | 4.6x base polymer | Three-body micro-abrasion and matrix wash-out | 6.4x baseline |
| 60% Glass Fiber | 41.2% | 7.2x base polymer | Severe micro-spalling and impact erosion | 14.1x baseline |
The volumetric loading of glass fiber dictates particle contact frequency against cavity walls more directly than weight percentage.
Sub-surface shear stresses peak immediately behind the melt front. Wear pattern distribution maps show maximum steel removal situated within two millimeters of gate exits where kinetic energy conversion creates localized thermal spikes. Misdiagnosing pure mechanical gouging when chemical pitting contributes to material removal leads to selecting ultra-hard but corrosion-sensitive tool steels that crack prematurely under cyclic injection fatigue.

Carbide
Metallurgical Microstructures and Matrix Hardness
Tool steel survival under high filler abrasion requires balancing bulk matrix hardness with primary carbide distribution. Conventional mold steels like AISI P20 (1.2311) hardened to 30 HRC or AISI H13 (1.2344) tempered to 52 HRC lack adequate hard phase volume to resist continuous glass scouring. Standard iron-chromium matrix phases yield rapidly under fiber impact.
Glass filaments cut continuous swaths through unreinforced martensite, causing gate land dimensions to expand within several thousand press cycles.
Powder metallurgy tool steels provide wear resistance through high volume fractions of vanadium, chromium, and tungsten carbides uniformly distributed in a martensitic matrix. Vanadium carbides (VC) register extreme micro-hardness values between 2,400 and 2,800 HV, significantly exceeding the hardness of E-glass fibers (600 HV). Chromium carbides (M7C3 and M23C6) offer micro-hardness between 1,200 and 1,600 HV.
A high density of small, spherical carbides spaced closer together than the average glass fiber diameter prevents fibers from penetrating the softer martensitic binder.
Matrix hardness acts as the foundation supporting hard carbide particles. Tempering tool steel below 56 HRC permits the surrounding binder to deform elastically under impact loading. Micro-yield within the martensite allows glass fibers to catch carbide edges, leverage them out of the structure, and expose fresh binder underneath.
High-vanadium PM steels like Uddeholm Vanadis 4 Extra, CPM 10V, or Böhler M390 tempered to 60-62 HRC maintain rigid support around carbide grains, preventing binder wash-out.

Carbide Pullout and Matrix Wash-Out Dynamics
Matrix wash-out follows a distinct two-stage physical degradation sequence. Plastic melt scours the softer iron matrix between primary carbide grains. Grooves form around individual carbides, diminishing mechanical anchorage within the steel surface.
High velocity melt flow exerts fluid drag forces against the exposed carbide heads, exceeding the fracture strength of the remaining binder root. The carbide grain breaks free, creating a pit that disrupts local laminar flow and induces turbulence.
Primary carbide size determines the threshold for mechanical stripping. Large, blocky primary carbides measuring above 10 micrometers in diameter experience high fluid drag forces. Micro-cracks initiate at the carbide-matrix interface under cyclic thermal and pressure loading.
Powder metallurgy processes refine carbide diameter down to 1 to 3 micrometers. Fine, evenly dispersed carbide networks distribute mechanical shear loads across millions of microscopic anchor points, resisting pullout under extreme melt velocity conditions.
| Grade Specification | Metallurgical Type | Primary Hard Phase Volume | Working Hardness Range | Resistance to Glass Fiber Wash |
|---|---|---|---|---|
| AISI H13 (1.2344) | Conventional Hot-Work Steel | ~3% M23C6 Chromium Carbides | 48 – 52 HRC | Low |
| AISI D2 (1.2379) | Conventional High-Cr Cold-Work | ~12% M7C3 Chromium Carbides | 58 – 60 HRC | Moderate |
| Böhler M390 / CPM 20CV | PM Stainless Tool Steel | ~20% (14% Cr, 6% VC Carbides) | 58 – 62 HRC | High |
| CPM 10V / Vanadis 10 | PM High-Vanadium Cold-Work | ~17% Pure VC Vanadium Carbides | 60 – 64 HRC | Very High |
| Micro-Grain WC-Co (10% Co) | Sintered Tungsten Carbide | >85% Tungsten Carbide (WC) | 88 – 92 HRA | Extreme |
Bulk Rockwell hardness numbers fail to predict tool longevity if the underlying alloy lacks a high volume fraction of primary vanadium carbides.
Steel vendors frequently attribute premature gate washout to excessive melt temperature rather than structural binder degradation. Bulk hardness measurements mask localized microstructural loss where binder wash-out occurs between primary carbide clusters.
Metric
Standardized Laboratory Tests versus Injection Cavity Physics
Standardized wear testing methods provide screening data for metallurgical selection, but direct translation to injection moulding conditions requires rigorous calibration. Standard laboratory tests apply constant mechanical loading under dry or abrasive slurry conditions. Injection moulding exposes tool surfaces to non-Newtonian melt flow, rapid thermal cycling over 100 degrees Celsius per second, and fluctuating cavity hydrostatic pressures reaching 200 MPa.
Wear coefficients derived from ambient dry tests routinely miscalculate actual steel wear rates inside gates by more than an order of magnitude.
Dry sand/rubber wheel testing according to ASTM G65 measures coarse abrasive wear under low velocity contact. The test uses silica sand particles ranging from 212 to 300 micrometers. Chopped glass fibers inside injection moulding compounds break down to lengths below 100 micrometers within the screw barrel.
Particle size discrepancy in ASTM G65 alters the contact mechanics entirely, failing to replicate the fine micro-scratching and chemical interaction generated by hot polymer melts under pressure.
Why Do Standard ASTM Wear Tests Fail to Predict Gate Erosion?
Abrasive wear behavior changes fundamentally when particles are suspended inside a highly viscous fluid medium. Dry friction tests enforce direct solid-to-solid contact under normal external forces. Injection gates channel fluid where shear rate, melt viscosity, and dynamic pressure determine whether glass fibers contact the wall directly or ride on a microscopic liquid film.
ASTM G65 and pin-on-disk tests (ASTM G99) lack high-temperature fluid dynamics, preventing them from reproducing binder wash-out caused by high shear fluid drag.
Adapting tribological modeling to filled polymer processing requires modifying Archard’s classical wear equation. Archard models worn volume as directly proportional to normal force and sliding distance, inversely proportional to material hardness. In highly filled injection moulding, normal force against the tool wall is a function of cavity pressure and fiber orientation angle relative to the flow direction.
Wear volume calculation requires integrating localized shear stress and instantaneous volumetric fiber flow rate across the gate land profile.
The modified Archard wear coefficient, designated as K, varies continuously across the injection cycle. During the filling phase, high shear rates produce maximum wall friction while the melt front advances. During the packing and holding phases, high static pressure forces glass filaments firmly against core pins and cavity corners while velocity approaches zero.
Slurry wear models based on ISO 20808 or adapted ASTM G75 Miller number protocols provide better empirical correlation by testing tool steels within heated, pressurized polymer test channels under controlled melt flow rates.
Micro-scale abrasion testing using a rotating sphere coated with filled polymer paste reproduces fine scratches seen on polished gate inserts. Quantifying wear coefficients through micro-sphere indentation isolates matrix wear resistance from bulk fatigue properties. Data extracted from micro-abrasion profiles allows tool designers to map wear rate constants into finite element injection moulding simulations, predicting cavity wall loss across millions of press cycles.
Standard pin-on-disk abrasion coefficients underestimate actual gate land loss because they omit hot polymer melt chemistry and shear stress effects.
Laboratory wear tests leave an unresolved question regarding how microscopic filler alignment variations at converging flow fronts alter local micro-abrasion rates across complex three-dimensional core geometry.
Gauging
Metrology for Cavity Wear and Gate Erosion Mapping
Tracking cavity steel loss across production runs requires high-precision optical and physical measurement techniques. Dimensional changes at gate lands or core pins often remain below 10 micrometers during initial wear stages. Conventional hand micrometers and standard vernier calipers lack the accuracy and spatial resolution required to measure localized wash-out patterns.
Advanced toolroom audits employ non-contact three-dimensional optical profilometry and focus variation microscopy to build surface height maps of worn steel inserts.
Focus variation metrology captures high-density point clouds across steeply inclined tool geometries. Optical sensors measure surface topography, generating depth profiles with sub-micron vertical resolution. Comparing 3D scan files of a worn tool insert against its nominal CAD model yields precise spatial wear maps.
Differential volumetric analysis identifies exact locations where melt streams gouged steel away, quantifying volume loss in cubic millimeters per hundred thousand shots.
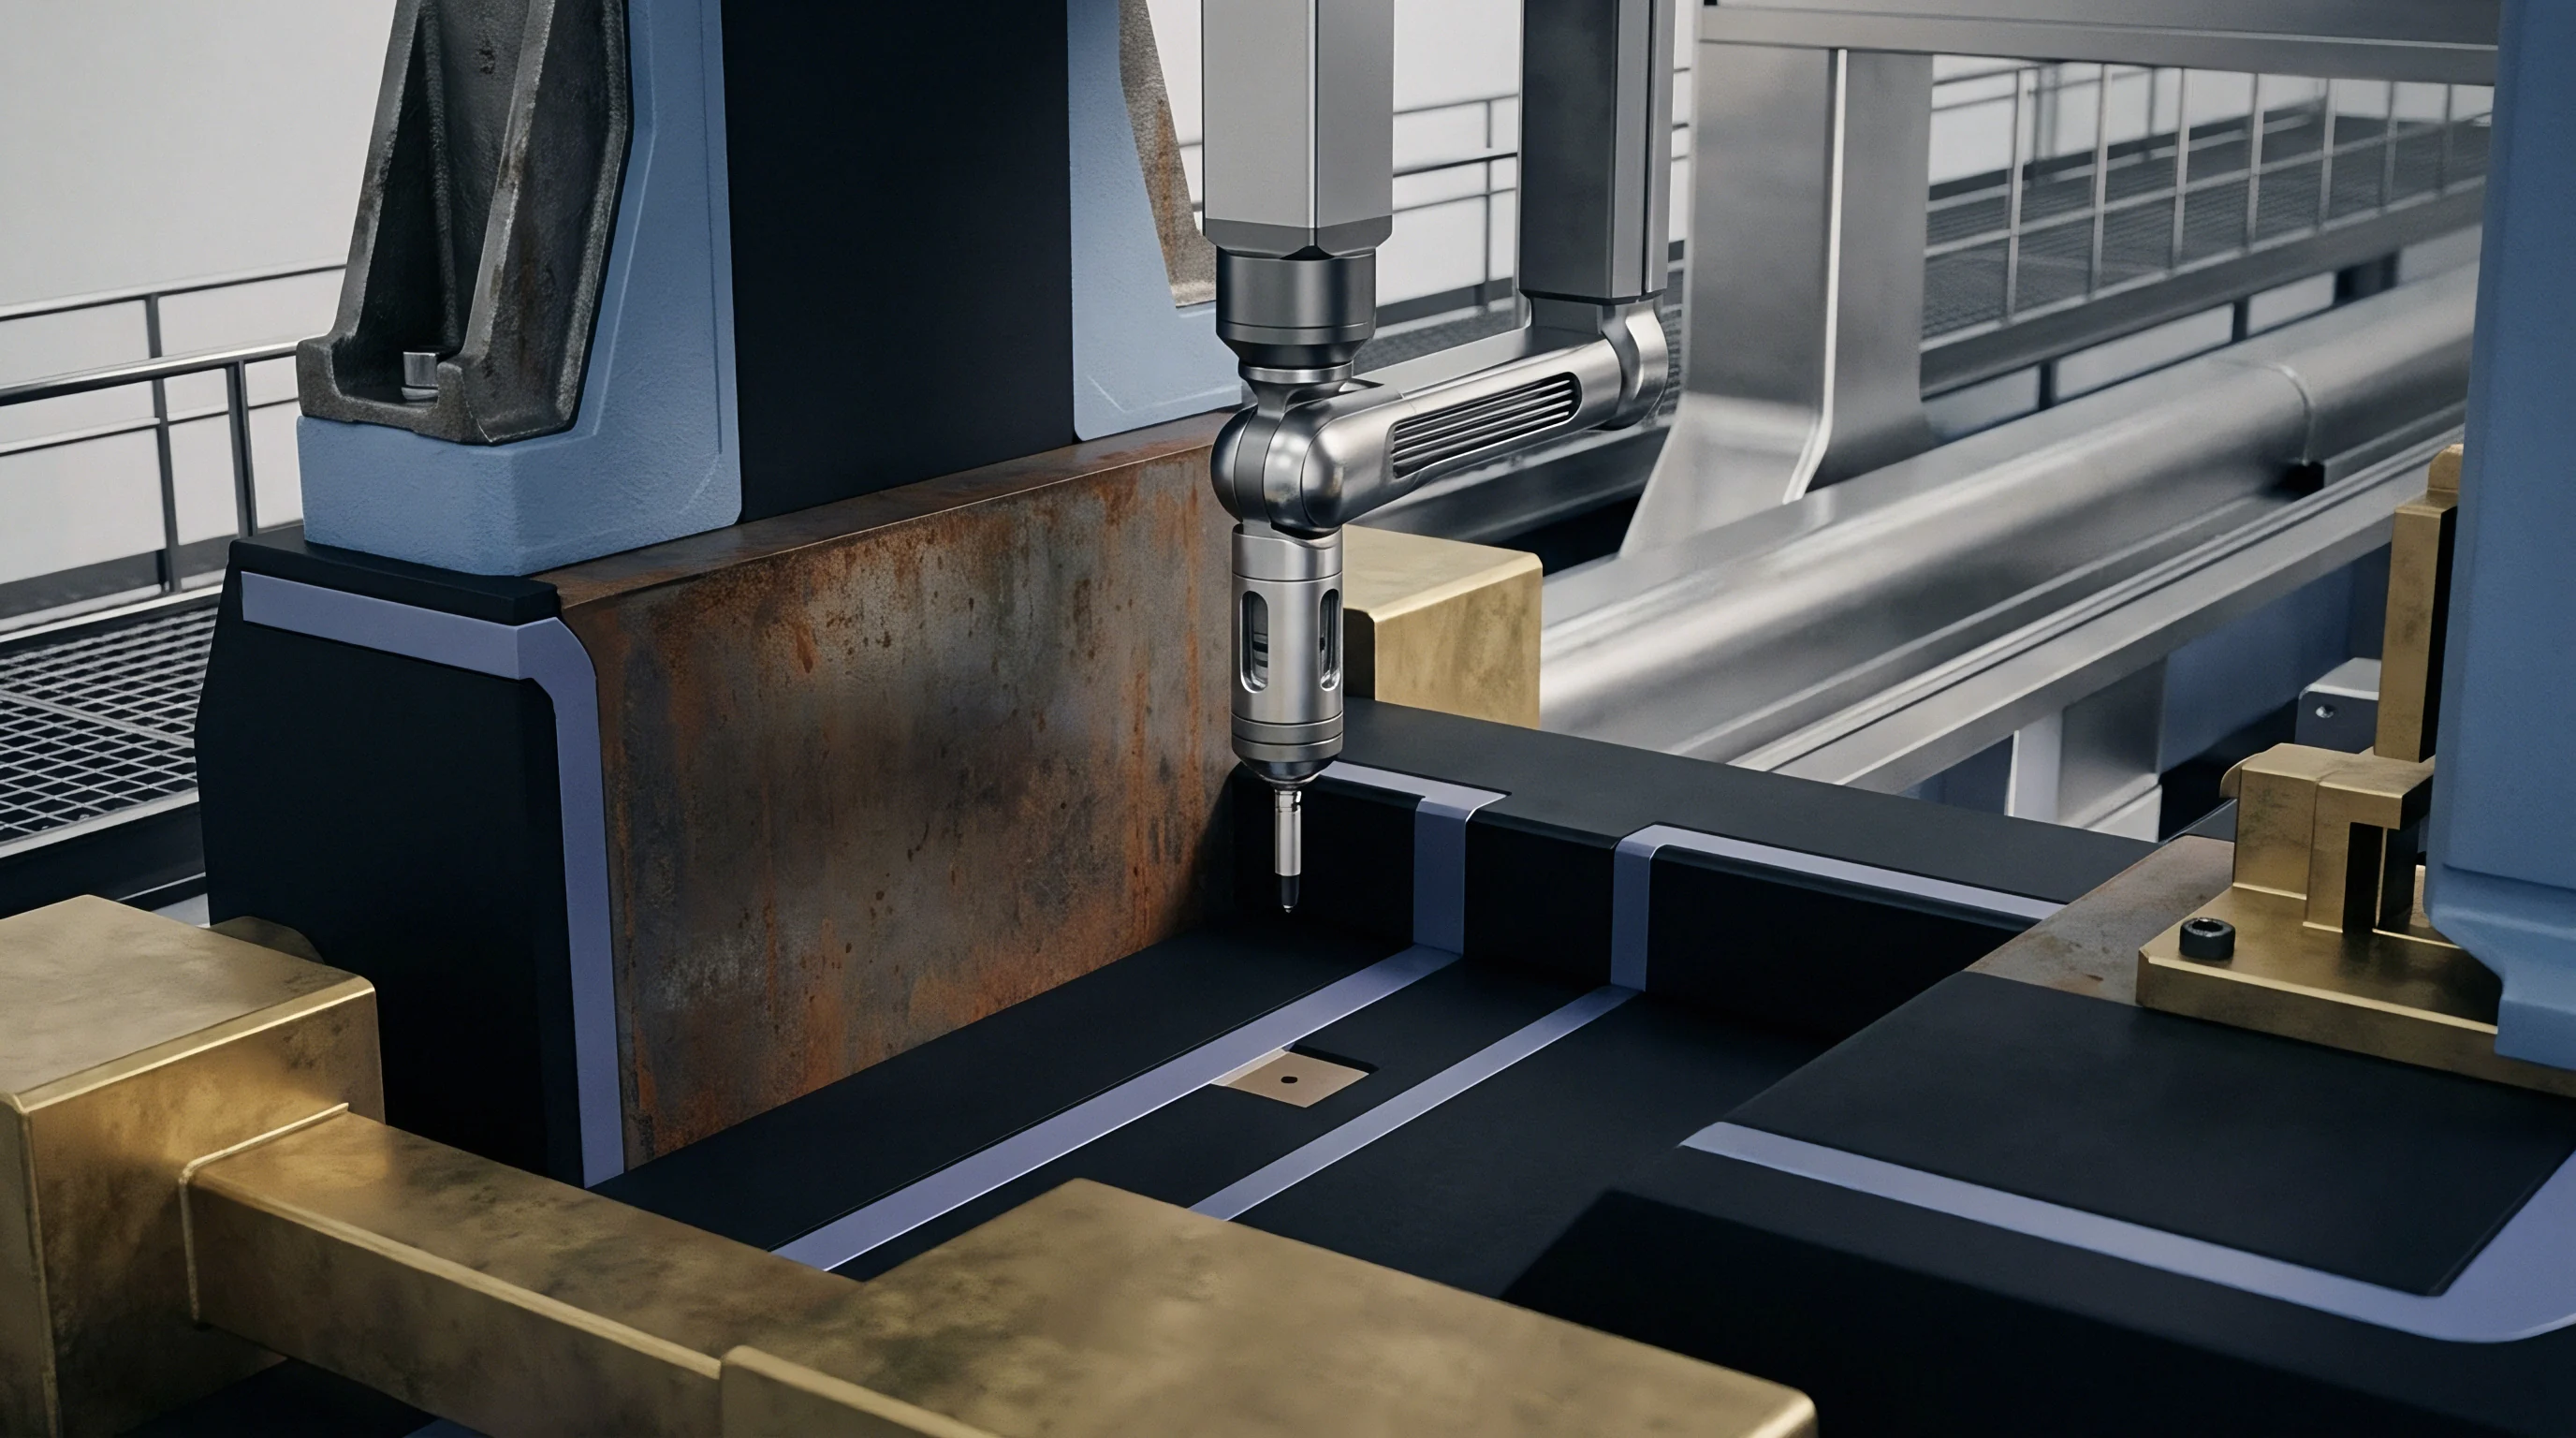
Tactile coordinate measuring machines equipped with micro-stylus probes (stylus tip radii under 100 micrometers) verify narrow gate geometries where optical signals encounter optical shadowing. Micro-probing captures cross-sectional profiles along gate lands, detecting wall expansion before flash appears on moulded parts. White light interferometry provides atomic-scale surface roughness profiles (Ra and Rz), measuring micro-scratch depths within the binder matrix before dimensional tolerances are breached.
In-situ indirect quantification techniques monitor machine process variables to detect tool wear without disassembling the mould. Cavity pressure transducers installed directly behind gate lands exhibit continuous peak pressure drops as gate cross-sectional area enlarges from wear. Tracking part weight stability across shift logs provides another early warning signal; as gate lands erode, packing efficiency increases, raising individual part mass past specification limits.
| Measurement Method | Spatial Resolution | Measurement Domain | In-Situ Capabilities | Primary Measurement Metric |
|---|---|---|---|---|
| Focus Variation Microscopy | 0.1 micrometers vertical | Direct steel insert inspection | Offline toolroom measurement | 3D surface topography map and volume loss |
| Micro-Stylus CMM Probing | 0.5 micrometers linear | Specific gate and land profiles | Offline toolroom measurement | 2D dimensional wall expansion profile |
| White Light Interferometry | 0.01 micrometers vertical | Localized micro-structure area | Offline toolroom measurement | Surface roughness parameters Ra, Rz, Rsk |
| In-Cavity Pressure Transducer | 0.1 bar pressure shift | Real-time melt stream monitoring | Online live injection process | Dynamic fill/pack pressure delta curve |
| Gravimetric Part Tracking | 0.001 grams part weight | Moulded production component | Online quality audit monitoring | Part mass increase via gate enlargement |
Standardized Gate Erosion Audit Protocol
- Clean the tool insert thoroughly using ultrasonic solvent baths to eliminate polymer residue, grease, and outgassed volatiles from steel pores.
- Mount the insert in a temperature-controlled metrology frame stabilized at 20 degrees Celsius for two hours to prevent thermal expansion errors.
- Perform a full-field optical 3D surface scan of the gate land and core pin contact areas to establish baseline geometry against original CAD models.
- Record initial surface roughness parameters Ra, Rz, and skewness value Rsk across three parallel measurement tracks oriented transverse to flow direction.
- Run a qualified production batch of 25,000 shots under monitored melt temperature, injection velocity, and cavity pressure conditions.
- Dismount the insert, repeat solvent cleaning, and re-scan the exact coordinate grid mapped during the baseline measurement.
- Calculate total volumetric steel loss in cubic millimeters by subtracting the worn point cloud from the baseline CAD geometry using aligned reference datums.
- Determine localized maximum depth erosion rate expressed in micrometers per 10,000 cycles to project remaining tool life before tolerance breach.
Dimensional changes appearing on moulded parts always lag behind actual tool steel wear by thousands of press cycles.

Life

Wear Rate Curves and Life Expectancy Modeling
Tool steel removal follows a non-linear three-stage progression over its operational lifespan. Stage one represents break-in wear. Microscopic steel asperities remaining from wire EDM or manual polishing strip away rapidly within the first 5,000 to 15,000 cycles.
Surface roughness Rz drops temporarily as high peaks shear off, stabilizing into a relatively smooth profile.
Stage two exhibits steady-state abrasive wear. Steel loss proceeds linearly across hundreds of thousands of cycles. Micro-abrasion and matrix wash-out remove steel at a controlled rate dependent on carbide volume fraction and melt velocity.
Tooling engineers model stage two with constant wear coefficients to predict maintenance intervals and plan insert replacement schedules.
Stage three introduces catastrophic wash-out. Continuous matrix degradation loosens large carbide grains, converting two-body sliding friction into severe three-body micro-grinding. Localized geometry changes create flow turbulence, which accelerates shear heating and localized erosion.
Gate lands expand rapidly during stage three, leading to uncontrollable dimensional drift, excessive part flashing, and sudden pressure loss during packing.
Predicting tool longevity requires establishing clear failure criteria based on component drawing tolerances according to DIN 16742 standards. Class TG4 standard tolerances allow small dimensional variations, whereas Class TG3 tight tolerances demand strict dimensional control. When gate land depth expands beyond the drawing allowance, packing pressure drops and sink marks appear on thick part sections, signaling end of effective tool life.
Worked Example: Gate Erosion Rate and Tool Life Projection
Consider a four-cavity injection mould producing electrical housing components from polyamide 66 reinforced with 50% short glass fiber by weight. The mold utilizes edge gates with initial dimensions of 1.20 mm land depth, 2.00 mm width, and 1.50 mm land length. The steel specified for the gate inserts is conventional AISI H13 hardened to 52 HRC.
Injection parameters set press injection pressure at 140 MPa, driving melt through each gate at a shear rate of 22,000 reciprocal seconds. Drawing specifications assign a maximum allowable gate land depth increase of +0.05 mm (50 micrometers) before gate vestige trimming fails quality audits.
Field metrology data collected via optical profilometry establishes a steady-state erosion rate of 1.8 micrometers per 10,000 production cycles for AISI H13 under these processing conditions. The total wear life calculation evaluates allowable dimensional delta divided by linear wear rate:
Total Service Cycles = (50 micrometers allowable wear) / (1.8 micrometers / 10,000 cycles) = 277,777 cycles.
Upgrading the insert material to CPM 10V powder metallurgy steel (62 HRC, 17% vanadium carbide volume fraction) reduces the steady-state wear rate down to 0.22 micrometers per 10,000 cycles under identical process conditions:
Total Service Cycles = (50 micrometers allowable wear) / (0.22 micrometers / 10,000 cycles) = 2,272,727 cycles.
The material upgrade extends gate insert service life by a factor of eight, amortizing the higher initial steel purchase and machining costs over a significantly longer production run.

Moulded Component Defect Modes Caused by Steel Wear
- Gate vestige protrusion expanding past drawing limits due to gate land land depth wash-out, causing assembly interference in downstream automated production lines.
- Heavy parting line flash forming at core pin bases and ejector pin holes where abrasive clearance expansion exceeds 0.015 mm, permitting resin leakage under high pressure.
- Severe surface fiber exposure creating rough, un-pigmented patches on show surfaces caused by turbulent flow over micro-spalled cavity steel.
- Dimensional wall expansion causing critical snap-fit features to exceed DIN 16742 TG3 tolerances as cavity boundary walls scour wider over time.
- Sink mark formation on thick ribs resulting from pressure loss across eroded gates during the holding phase of the injection cycle.
A tooling supply contract specifying maximum allowable gate growth per hundred thousand cycles transfers wear risk directly to the toolmaker.

Defense
Surface Coatings, Treatments, and Hard Alloys
Extending tooling life under 40% to 60% glass filler loading requires layered material engineering strategies. Thin-film Physical Vapor Deposition (PVD) coatings apply ultra-hard ceramic compounds directly onto finished steel surfaces. Titanium Aluminum Nitride (TiAlN) and Aluminum Titanium Nitride (AlTiN) coatings deliver surface hardness values between 3,000 and 3,500 HV, vastly exceeding glass fiber hardness.
Thermal stability up to 800 degrees Celsius prevents coating oxidation under high shear friction.
Substrate support dictates PVD coating durability. Applying an ultra-hard 3-micrometer TiAlN film onto soft 30 HRC steel leads to premature eggshell failure. High local contact pressure deforms the underlying soft steel, causing the brittle coating layer to crack and spall off under impact.
Toolmakers must harden the base steel substrate to a minimum of 54 HRC before applying hard coatings.
Duplex surface treatments combine plasma nitriding with subsequent PVD coating deposition. Plasma nitriding diffuses nitrogen into the surface layer, creating a high-hardness diffusion zone 0.1 to 0.2 mm deep with hardness around 1,000 HV. This diffusion zone creates a continuous yield strength gradient between the soft steel core and the exterior ceramic PVD film, preventing coating delamination under cyclic clamping forces.
Chemical Vapor Deposition (CVD) diamond coatings and Diamond-Like Carbon (DLC) formulations offer low friction coefficients combined with micro-hardness reaching 5,000 HV. CVD processing temperatures around 900 degrees Celsius anneal standard tool steels, demanding specialized substrate materials like solid tungsten carbide inserts. Sintered tungsten carbide with 6% to 10% cobalt binder resists mechanical abrasion, maintaining gate geometry across tens of millions of press cycles.
| Tooling Substrate / Coating System | Surface Hardness Range | Relative Tooling Cost Index | Expected Life (50% GF Resin) | Primary Failure Mode |
|---|---|---|---|---|
| Hardened AISI H13 (Uncoated) | 50 – 52 HRC (~520 HV) | 1.0x baseline | 150,000 cycles | Rapid gate land matrix wash-out |
| AISI H13 + Single Layer TiAlN PVD | ~3,000 HV surface | 1.3x baseline | 450,000 cycles | Eggshell micro-cracking and spalling |
| Hardened CPM 10V (Uncoated) | 62 – 64 HRC (~800 HV) | 2.2x baseline | 2,000,000 cycles | Slow, uniform micro-abrasion |
| CPM 10V + Duplex Plasma Nitride + AlTiN | ~3,300 HV surface | 2.8x baseline | 4,500,000 cycles | Gradual coating wear down to nitride zone |
| Solid WC-Co Carbide Inserts | 89 – 91 HRA (~1,600 HV) | 4.5x baseline | 10,000,000+ cycles | Thermal shock micro-cracking at gate exit |

Tooling Specification Clauses for High-Filler Procurement
- Substrate Material Certification requiring mill test reports confirming powder metallurgy steel grade, carbide size distribution below 3 micrometers, and vacuum heat treatment to targeted HRC.
- Duplex Surface Treatment Protocol mandating plasma nitriding depth parameters prior to PVD film deposition to prevent eggshell substrate collapse under injection fatigue.
- Interchangeable Gate Insert Construction requiring modular sub-insert design for all runner entry points to allow cost-effective steel replacement without re-machining core blocks.
- Pre-Production Baseline Metrology Audit specifying mandatory 3D optical surface scans of gate geometry recorded in the tool dockets prior to mold sign-off.
- Wear Life Guarantee Thresholds establishing maximum permitted gate dimension drift (in micrometers per 100,000 cycles) tied directly to tooling retention payments.
Specifying high-vanadium powder metallurgy steels or tungsten carbide sub-inserts inside high-wear gate zones protects component dimensional stability while minimizing lifetime tooling maintenance costs. Aligning tool steel selection, surface engineering, and quality metrology early in the procurement cycle ensures injection moulding operations maintain precise process control across high-volume production runs.