Quantification Uncertainty of Semi Volatile Non Intentionally Added Photoinitiators in Recycled Polyolefin Streams
Quantifying semi-volatile photoinitiators in recycled polyolefins requires matrix-matched standard addition to counter 40% measurement uncertainty.


Flake
Post-consumer polyolefin fractions contain complex mixtures of migrated printing ink ingredients, degradation byproducts, and adhesive additives. Mechanical recycling processes wash, shred, and melt post-consumer high-density polyethylene and polypropylene containers printed with UV-cured flexographic or offset inks. Although photoinitiators split during print curing to generate free radicals, unreacted parent molecules and secondary cleavable fragments remain trapped inside the crosslinked ink film.
Friction washing with hot caustic solutions strips surface inks imperfectly. Low-molecular-weight additives dissolve directly into the polymer matrix during melt extrusion, turning functional ink chemicals into non-intentionally added substances in recycled pellets. These semi-volatile organic compounds have boiling points between 170 degrees Celsius and 400 degrees Celsius, with octanol-water partition coefficients showing strong lipophilic affinity for polyolefin networks.
Unbound photoinitiators migrate rapidly through polyethylene and polypropylene amorphous regions owing to the high free volume and low glass transition temperature of aliphatic polyolefin chains. The chemical diversity of industrial UV-curable formulations introduces benzophenone, 2-isopropylthioxanthone, 4-methylbenzophenone, 2-ethylhexyl-4-(dimethylamino)benzoate, and 1-hydroxycyclohexyl phenyl ketone into recovery batches. These compounds resist hot alkaline flake washes at 85 degrees Celsius because their solubility parameters closely match the hydrophobic polyolefin backbone.

Cross-Contamination Routes in Mechanical Washing Streams
Industrial optical flake sorters separate opaque bottles, colored packaging, and transparent polyolefin containers using near-infrared reflection. Near-infrared spectral libraries identify the resin type but miss sub-micron printed coatings entirely. Printed labels, direct-to-bottle UV inks, and varnishes enter the granulator alongside unprinted container walls.
Grinding knives apply mechanical shear that forces printed skin layers into direct contact with the freshly cut edges of unprinted polymer flakes. Hot aqueous caustic washing at 2.0 percent sodium hydroxide removes water-soluble label adhesives and loose dirt, but the surfactant bath cannot dissolve crosslinked acrylate ink films. These insoluble flakes move along with the bulk polymer into the mechanical spin dryer.
Thermal exposure in the dewatering and drying loop heats the flakes to 110 degrees Celsius, accelerating solid-state diffusion of small aromatic molecules from surface ink flakes straight into adjacent unprinted plastic chips.
A hot caustic wash at eighty-five degrees Celsius leaves unreacted aromatic photoinitiator residues embedded in the polyolefin amorphous domains.
Extrusion compounding is where the worst contamination occurs. Twin-screw extruders running at melt temperatures between 190 degrees Celsius and 240 degrees Celsius turn the polyolefin flakes into a continuous liquid phase under barrel pressures of 80 bar to 150 bar. Residual solid ink fragments disperse throughout the polymer melt, while unreacted photoinitiators dissolve completely into the liquid plastic.
Vacuum degassing ports pull off volatile organic substances with boiling points below 180 degrees Celsius, but semi-volatile photoinitiators have vapor pressures too low for effective vacuum stripping during typical residence times of 45 to 90 seconds.
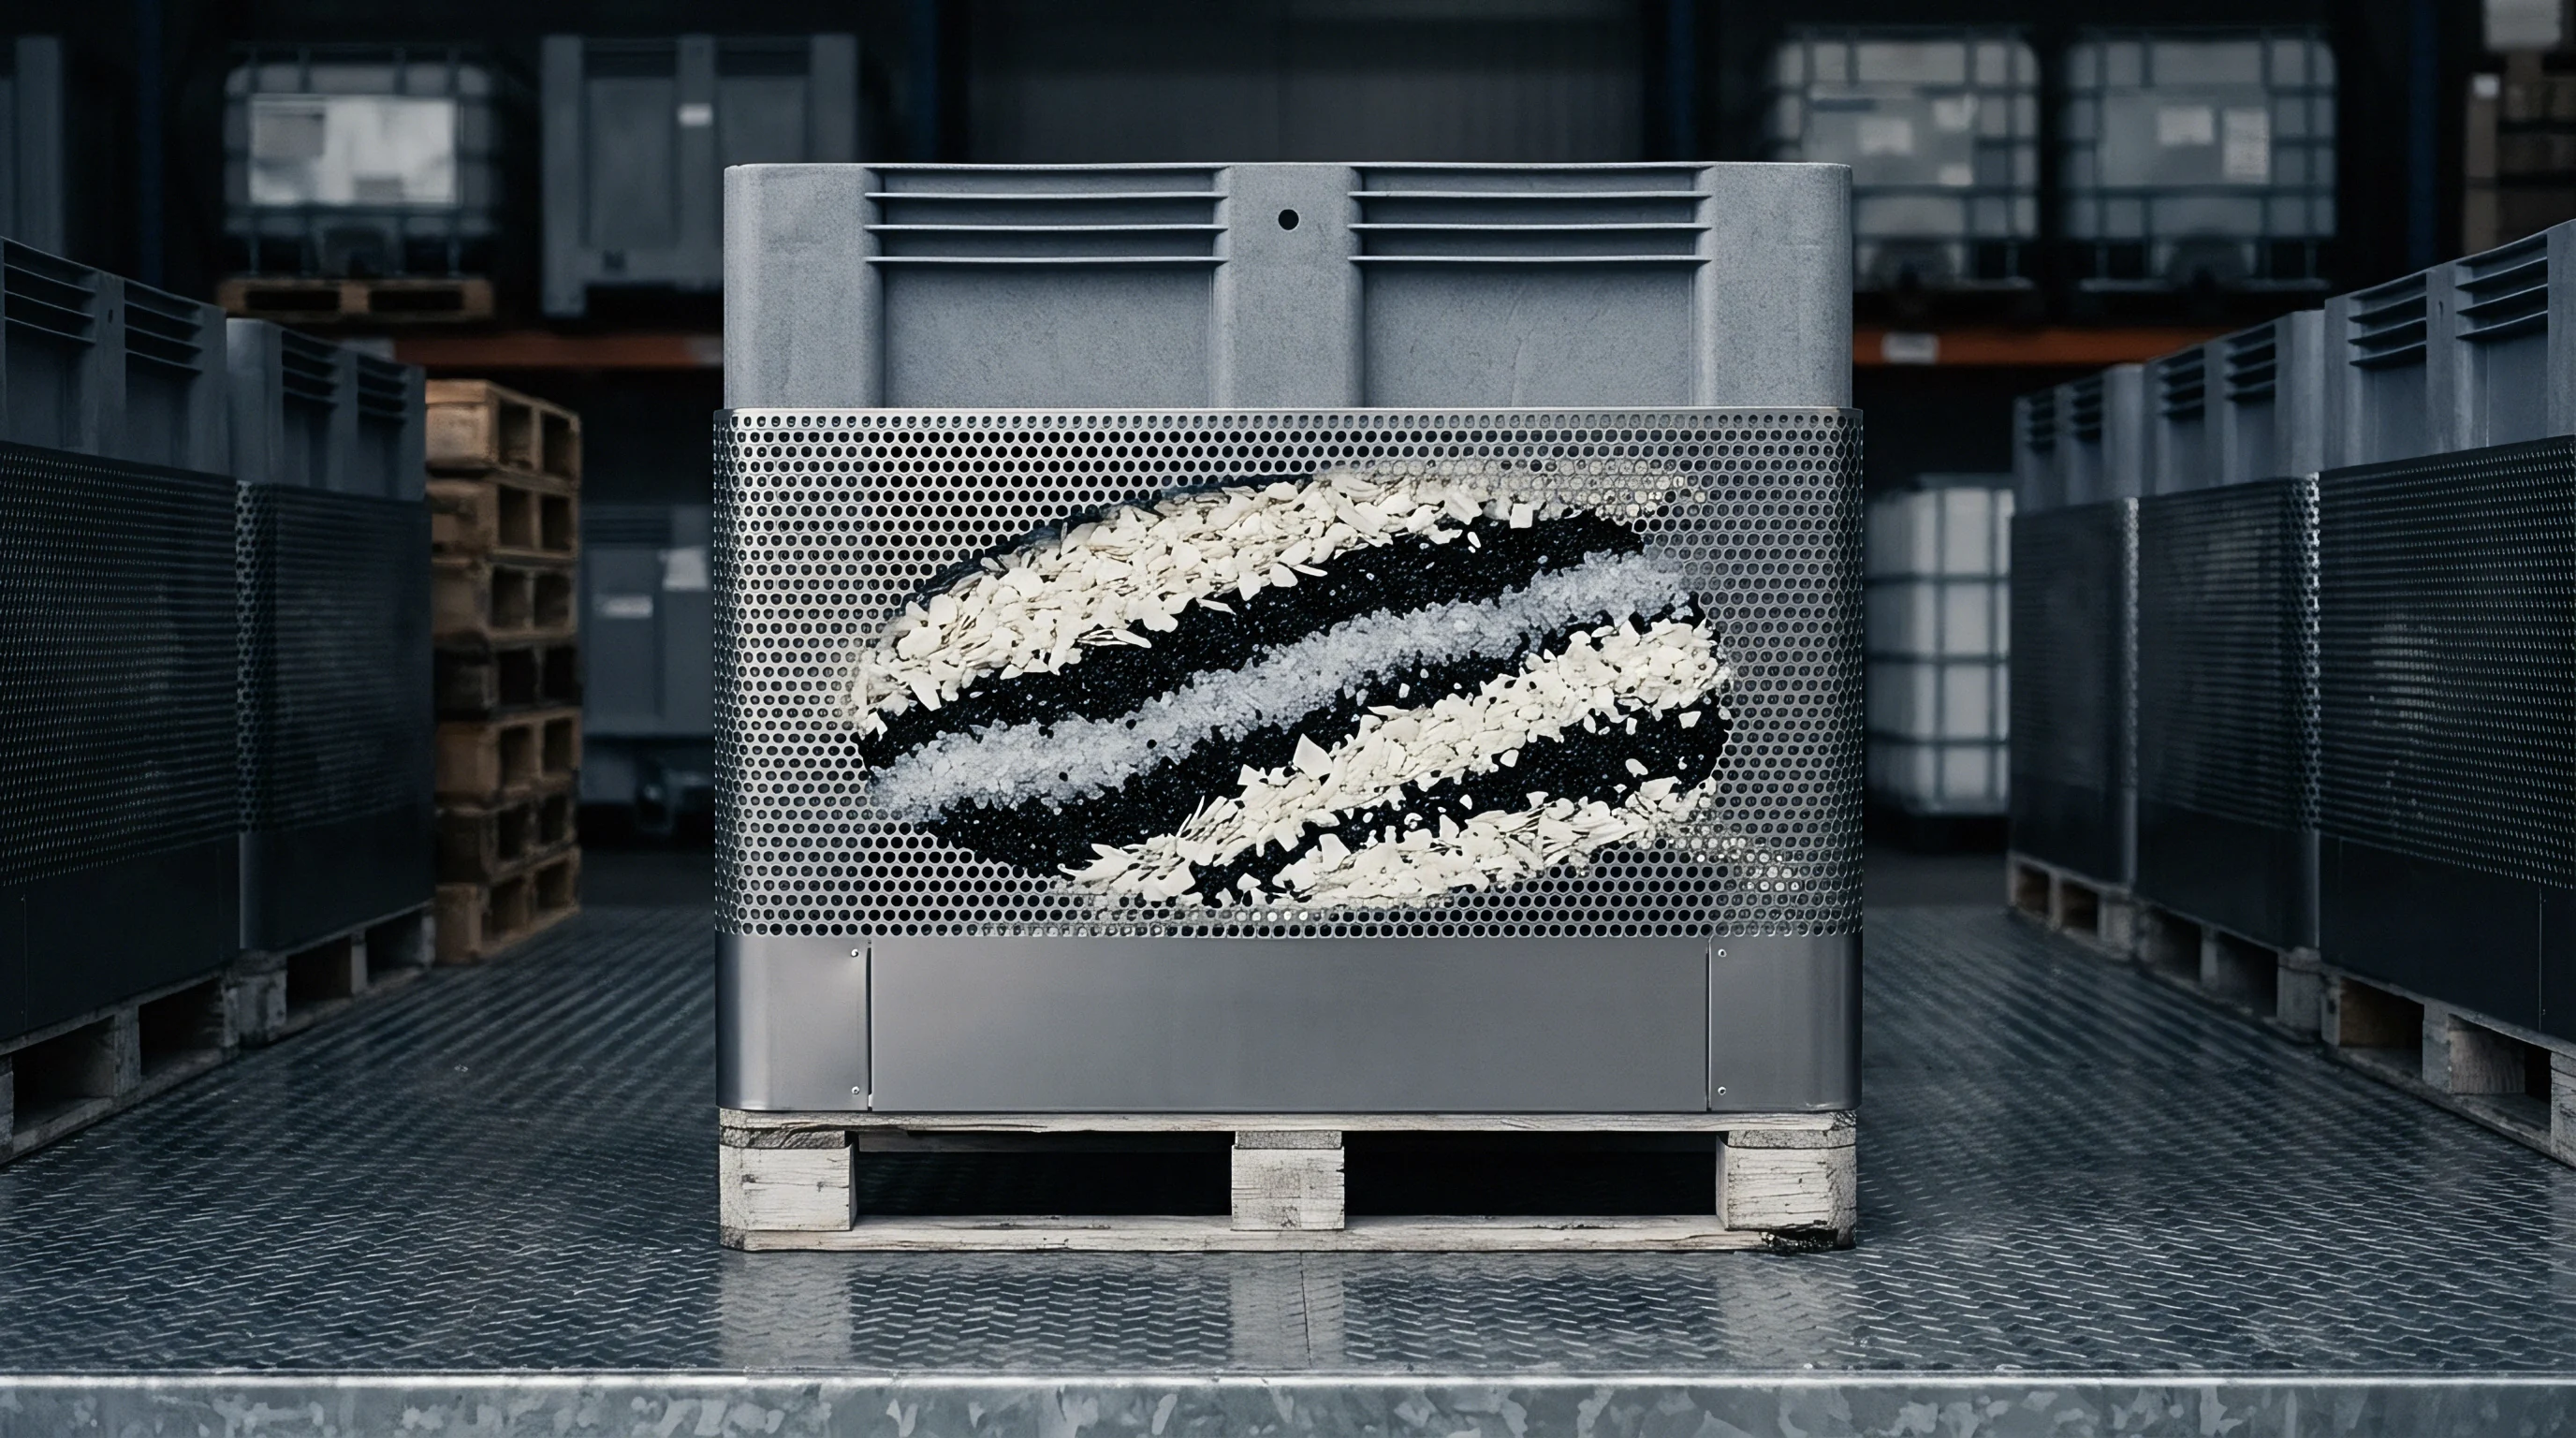
Thermal Dissolution and In-Melt Homogenization
Polymer processing additives undergo thermal degradation during extrusion. Type I Norrish-cleavage photoinitiators like 2,2-dimethoxy-2-phenylacetophenone fragment into benzaldehyde, methyl benzoate, and acetophenone derivatives under processing heat. In contrast, Type II photoinitiators such as benzophenone and isopropylthioxanthone rely on hydrogen abstraction from tertiary amines or the polyolefin backbone itself; these molecules survive repeated thermal cycles and accumulate in post-consumer resin batches.
Mechanical recycling plants blend bales from varied regional collection programs, leading to hourly fluctuations in feedstock composition across material recovery facilities. A single processing run might combine containers that held industrial lubricants, household detergents, cosmetics, and dry food packaging. This heterogeneity leaves semi-volatile chemical loads unevenly distributed across manufactured pellet lots.
| Compound Name | Chemical Abstracts Service | Molecular Weight (g/mol) | Boiling Point (deg C) | Log Kow Partitioning | Thermal Stability Limit (deg C) |
|---|---|---|---|---|---|
| Benzophenone | 119-61-9 | 182.22 | 305 | 3.18 | 260 |
| 4-Methylbenzophenone | 134-84-9 | 196.25 | 326 | 3.69 | 270 |
| 2-Isopropylthioxanthone | 5495-84-1 | 254.35 | 395 | 5.44 | 290 |
| 1-Hydroxycyclohexyl phenyl ketone | 947-19-3 | 204.27 | 298 | 2.33 | 220 |
| Ethyl 4-(dimethylamino)benzoate | 10287-53-3 | 193.24 | 310 | 3.21 | 250 |
| 2-Benzyl-2-(dimethylamino)-4-morpholinobutyrophenone | 119313-12-1 | 366.50 | 460 | 4.26 | 280 |
Re-granulation distributes these compounds throughout the bulk matrix. While pellets within a single extrusion lot show homogeneous baseline contamination, concentration differences between distinct production lots can be massive.


Spike
Measuring semi-volatile photoinitiators in recycled polyolefins requires careful solid-liquid extraction protocols.
Injecting polyolefin solutions directly into a chromatograph quickly fouls columns and contaminates detectors with dissolved non-volatile oligomers. Analytical chemists generally use three sample preparation pathways: total polymer dissolution followed by cold anti-solvent precipitation, microwave-assisted extraction with polar solvents, or accelerated solvent extraction under pressure. Total dissolution involves dissolving high-density polyethylene or polypropylene in hot aromatic or cycloaliphatic solvents like toluene, ortho-dichlorobenzene, or decahydronaphthalene at 120 degrees Celsius.
Once polymer chains uncoil, adding cold methanol, acetone, or acetonitrile precipitates the high-molecular-weight polyolefin fraction while semi-volatile photoinitiators partition into the liquid supernatant, which is then filtered, evaporated, and reconstituted for analysis.

Solvent Selection and Solid-Liquid Extraction Efficiency
Dichloromethane, hexane, ethyl acetate, and acetone swell the polyolefin matrix without dissolving the long polymer chains. Swelling opens amorphous inter-lamellar regions so solvent molecules can reach trapped analytes. Ultrasonic extraction with dichloromethane at 40 degrees Celsius pulls low-polarity photoinitiators from high-density polyethylene over four hours, whereas thicker polypropylene wall sections need six to twelve hours to reach diffusion equilibrium.
Accelerated solvent extraction operates at 80 degrees Celsius to 120 degrees Celsius under 100 bar pressure, keeping organic solvents liquid well above their atmospheric boiling points. Matrix swelling speeds up dramatically, cutting extraction cycles to twenty minutes, though the aggressive thermal environment can degrade heat-sensitive targets like 1-hydroxycyclohexyl phenyl ketone and amino-benzoate synergists inside the cell. The choice of extraction method introduces major systematic bias into the final result.
Polyolefin crystallinity ranges from 40 percent in impact copolymer polypropylene up to 75 percent in blow-molding grade high-density polyethylene. Crystalline spherulites exclude large additive molecules, forcing photoinitiators into amorphous pockets that solvents swell selectively. When a laboratory applies a standardized solvent mixture across samples of varying crystallinity, extraction recovery rates can shift by double-digit percentages.
Surrogate Recovery and Internal Standard Selection
Accurate quantification hinges on selecting structural or isotopically enriched analogs as internal standards. Deuterated benzophenone-d10 and carbon-13 enriched isopropylthioxanthone track extraction recovery, concentration losses, and chromatographic ion suppression reliably, but isotope-labeled standards are expensive and hard to source for obscure ink additives. Laboratories often fall back on surrogate internal standards like deuterated anthracene-d10, triphenyl phosphate, or 4-hydroxybenzophenone.
These surrogates have different steric profiles, log Kow values, and boiling points than target photoinitiators. Adding surrogate standards to dry polymer flakes before extraction does not work like native incorporation, because the surrogate never penetrates the crystalline-amorphous structure the way a contaminant does during hot melt extrusion. +—————————————————————————–+
| POLYMER SAMPLE PREPARATION AND EXTRACTION BIAS |
+—————————————————————————–+
| |
| –> Granule size reduction to External surface deposition of internal std |
| | (Bias: surface standard vs trapped native) |
| v |
| –> Total Dissolution / Precipitation OR |
| | Pressurized Liquid Extraction (PLE) |
| v |
| –> Polymer precipitation and membrane filtration |
| | (Risk: analyte occlusion in precipitated wax) |
| v |
| –> Turbovap nitrogen blowdown at 35 deg C |
| | (Risk: volatile evaporation of light markers) |
| v |
| –> Solid-phase extraction (C18 / silica cartridge) |
| | |
| v |
| –> GC-MS/MS or LC-ESI-MS/MS analysis |
| |
+—————————————————————————–+ Analytical bias manifests when native photoinitiators remain bound within partially swollen crystalline boundaries while surface-spiked surrogate standards extract almost instantly.
The calculated recovery factor overestimates extraction efficiency for the native contaminant, meaning the true concentration of the non-intentionally added photoinitiator in recycled resin is consistently underreported. Spiking native reference standards into virgin polyolefin pellets followed by twin-screw compounding produces authentic matrix-matched calibration standards that mirror how ink residues are physically entrained in post-consumer materials. Surface-coated pellets yield recovery numbers twenty to thirty-five percent higher than melt-compounded pellets under identical ultrasonic extraction conditions.
Grinding temperatures during sample preparation also demand careful control. Cryogenic milling under liquid nitrogen reduces recycled pellets to fine powders below 500 microns, expanding the specific surface area and accelerating extraction kinetics. Room-temperature rotary knife milling, by contrast, heats the polymer above 60 degrees Celsius ~ volatilization drives off low-boiling photoinitiators before solvent ever touches the matrix.
Cryogenic pulverization preserves semi-volatile integrity during size reduction. Pressurized liquid extraction minimizes solvent volume while maintaining high matrix penetration. Precipitation clean-up separates high-density polyolefin wax from liquid extracts to protect chromatography columns.
Matrix-matched calibration corrects for incomplete desorption of native contaminants trapped inside the bulk resin. In practice, a surface spike will always desorb before the trapped contaminant leaves the polymer core.


Response
Chromatographic quantification of semi-volatile photoinitiators relies either on gas chromatography coupled with mass spectrometry or liquid chromatography paired with tandem triple quadrupole mass spectrometry.
Each detection system introduces distinct response variations. Photoinitiators span diverse functional chemistries ~ from non-polar aromatic ketones to basic tertiary amines and sulfur-containing heterocycles ~ and these functional groups yield unpredictable ionization efficiencies across different instrument platforms. Gas chromatography with electron ionization mass spectrometry offers structural identification through standardized 70 electron-volt fragmentation libraries, fragmenting molecules reproducibly into characteristic mass-to-charge ratios.
However, thermal degradation occurs in the injection port at high temperatures. Operating injectors in splitless mode at 280 degrees Celsius induces partial pyrolysis of heat-sensitive compounds like Irgacure 907 and 1-hydroxycyclohexyl phenyl ketone.
Electron Ionization Fragmentations and Thermal Breakdown
Thermal breakdown in the chromatographic liner generates artifact peaks that skew quantitative balances. Inside hot glass inlet liners, 1-hydroxycyclohexyl phenyl ketone decomposes into cyclohexanone and benzaldehyde. If an analyst quantifies only the parent molecular ion peak at mass-to-charge 204, the reported value understates actual contamination by forty to sixty percent.
Thermal Breakdown in GC Inlet (280 deg C):
1-Hydroxycyclohexyl phenyl ketone —> Cyclohexanone + Benzaldehyde
(C13 H16 O2, MW = 204.27) (C6 H10 O) (C7 H6 O) Liquid chromatography paired with electrospray ionization avoids thermal degradation by operating at moderate column temperatures between 30 degrees Celsius and 50 degrees Celsius, but it introduces matrix-induced signal suppression. Recycled polyolefins contain synthetic oligomers, slip additives like erucamide and oleamide, and degraded primary phenolic antioxidants such as Irganox 1010 and Irgafos 168. These co-eluting substances compete with target photoinitiators for charge allocation at the electrospray droplet surface.
Erucamide concentrations in post-consumer polyolefins frequently exceed 1,000 milligrams per kilogram; when erucamide co-elutes with 2-isopropylthioxanthone or 4-methylbenzophenone, the photoinitiator signal can drop by up to seventy percent compared to a clean solvent standard.
| Analyte | Instrument Platform | Ionization Mode / Transition | Instrument LOQ (mg/kg resin) | Matrix Ion Suppression (%) |
|---|---|---|---|---|
| Benzophenone | GC-EI-MS | EI, m/z 182 -> 105, 77 | 0.05 | 0 to 5 |
| 4-Methylbenzophenone | GC-EI-MS | EI, m/z 196 -> 119, 91 | 0.05 | 0 to 8 |
| 2-Isopropylthioxanthone | LC-ESI-MS/MS | ESI+, m/z 255.1 -> 212.0, 184.0 | 0.01 | 45 to 65 |
| Irgacure 907 | LC-ESI-MS/MS | ESI+, m/z 280.1 -> 180.1, 152.1 | 0.02 | 30 to 50 |
| Omnirad 819 (BAPO) | LC-ESI-MS/MS | ESI+, m/z 419.2 -> 262.1, 137.0 | 0.05 | 50 to 75 |
| Ethyl 4-(dimethylamino)benzoate | GC-EI-MS | EI, m/z 193 -> 165, 148 | 0.02 | 5 to 12 |
Semi-quantitative screening protocols attempt to measure dozens of unidentified non-intentionally added substances simultaneously without authentic reference standards. The analyst calibrates the entire run against a single surrogate compound, such as deuterated benzophenone or dibutyl phthalate. Yet relative response factors between structural classes vary across two orders of magnitude in electrospray ionization and by factors of three to five in electron ionization mass spectrometry.
Relative Response Factor Variations in Non-Targeted Screening
A response factor measures instrument signal intensity per unit mass of analyte. In electron ionization, total ion current relates roughly to the ionization cross-section of the molecule. Even under standardized 70 electron-volt conditions, molecules with heteroatoms or conjugated aromatic systems generate widely differing base-peak intensities.
Relative Response Factor (RRF) Calculation:
( Area_analyte / Area_surrogate )
RRF = ————————————-
( Conc_analyte / Conc_surrogate ) Calculating the concentration of 2-isopropylthioxanthone using a benzophenone calibration curve in liquid chromatography without determining compound-specific response factors can result in errors over three hundred percent. A basic nitrogen atom in an amine co-initiator like ethyl 4-(dimethylamino)benzoate captures protons efficiently in positive electrospray mode, producing large peak areas at low absolute concentrations. Neutral aromatic ketones, conversely, ionize inefficiently and produce small signals that mask substantial contamination.
Screening non-intentionally added photoinitiators against a single surrogate standard introduces semi-quantitative errors reaching several hundred percent.
Matrix-matched standard addition provides the only reliable bridge across ionization suppression and response factor divergence. The testing laboratory spikes known concentrations of authentic target photoinitiators directly into aliquots of the real recycled polyolefin extract. Plotting the augmented peak area against added mass reveals the true slope of instrument response in the presence of co-extracted polymer additives.
Operating without matrix-matched calibration curves skews reported values away from physical reality: a buyer who accepts a screening report calculated against a generic hydrocarbon standard risks importing articles that exceed migration limits by an entire order of magnitude.

Variance
Quantifying semi-volatile photoinitiators in post-consumer polyolefins entails substantial measurement uncertainty. Quality assurance dossiers for food contact plastics demand rigorous evaluation of uncertainty budgets following the Guide to the Expression of Uncertainty in Measurement and Eurachem guidelines.
Measurement uncertainty combines random laboratory effects, instrument tolerances, extraction variances, and matrix heterogeneity into an expanded uncertainty interval. This budget breaks down into five primary standard uncertainty components: sample mass determination, volumetric solvent measurement, extraction recovery, calibration curve regression, and instrument repeatability. In heterogeneous recycled plastics, sampling variance and recovery bias dominate the overall error distribution.
+—————————————————————————–+
| BOTTOM-UP MEASUREMENT UNCERTAINTY PATHWAYS (GUM) |
+—————————————————————————–+
| |
| –> Balance tolerance and weighing precision |
| | |
| –> Pipette calibration and temperature drift |
| | |
| –> Linear regression error and standard purity |
| | |
| –> Instrument injection repeatability (n = 6) |
| | |
| –> Spike recovery variance across matrix lots |
| | |
| –> Inter-pellet post-consumer batch variance |
| | |
| v |
| COMBINED STANDARD UNCERTAINTY: |
| u_c = sqrt( u_mass^2 + u_vol^2 + u_cal^2 + u_rep^2 + u_rec^2 + u_homog^2 ) |
| | |
| v |
| EXPANDED UNCERTAINTY (Coverage Factor k = 2, 95% Confidence Interval): |
| U_expanded = 2 * u_c |
| |
+—————————————————————————–+
Bottom-Up Uncertainty Modeling for Trace Additives
Combined standard uncertainty is calculated by summing the squares of individual relative standard uncertainties. Analytical balance uncertainty for a 1.0000 gram sample contributes a relative standard uncertainty below 0.05 percent. Class A volumetric glassware and calibrated micropipettes add approximately 0.50 percent.
Reference material purity contributes 0.58 percent, assuming a certificate stating 99.0 plus or minus 1.0 percent under a rectangular distribution. Linear calibration regression introduces substantial uncertainty near the limit of quantification: ordinary least-squares regression across a six-point curve yields calibration uncertainty ranging from 2.5 percent at high concentrations to 12.0 percent near the lower limit. Instrument repeatability across six replicate injections contributes 1.8 percent to 3.5 percent.
Finally, extraction recovery uncertainty reflects rate dispersion across polyolefin matrix types: testing across multiple post-consumer sources shows recovery rates for benzophenone shifting between 68 percent and 94 percent, producing a relative standard uncertainty of 8.6 percent for the recovery correction factor.

Matrix Heterogeneity and Lot-to-Lot Dispersion
Heterogeneity in recycled resin batches creates the largest uncertainty component. Even after melt homogenization, post-consumer flakes preserve micro-domain variations. Quantifying this variance requires drawing multiple primary samples from distinct locations within a container or silo.
Ten independent 1.0-gram subsamples taken from a single 1,000-kilogram bag of recycled high-density polyethylene pellets yield relative standard deviations for 4-methylbenzophenone between 14.0 percent and 22.5 percent. This dispersion is not chromatographic measurement error; it reflects the physical variation of contaminated flake incorporation during mechanical compounding.
| Uncertainty Source | Parameter Value | Probability Distribution | Divisor | Standard Uncertainty u(x) | Relative Uncertainty u_rel (%) |
|---|---|---|---|---|---|
| Sample Mass | 1.0024 g | Rectangular | 1.732 | 0.00029 g | 0.03 |
| Extraction Volume | 10.00 mL | Triangular | 2.449 | 0.0163 mL | 0.16 |
| Reference Standard Purity | 98.50 % | Rectangular | 1.732 | 0.577 % | 0.59 |
| Calibration Curve Fit | Regression residuals | Normal | 1.000 | 0.042 mg/kg | 4.94 |
| Instrument Repeatability | 6 replicate runs | Normal | 1.000 | 0.024 mg/kg | 2.82 |
| Extraction Recovery Bias | Mean recovery: 78.4% | Normal | 1.000 | 0.068 | 8.67 |
| Inter-Pellet Heterogeneity | 10 field samples | Normal | 1.000 | 0.145 mg/kg | 17.06 |
Combining the relative uncertainties listed in the budget demonstrates how heterogeneity and extraction bias dictate the analytical outcome: Combined Relative Standard Uncertainty Calculation:
u_c,rel = sqrt( 0.03^2 + 0.16^2 + 0.59^2 + 4.94^2 + 2.82^2 + 8.67^2 + 17.06^2 ) %
u_c,rel = sqrt( 0.0009 + 0.0256 + 0.3481 + 24.40 + 7.95 + 75.17 + 291.04 ) %
u_c,rel = sqrt( 398.93 ) % = 19.97 % Multiplying the combined relative standard uncertainty by a coverage factor of k = 2 gives an expanded relative uncertainty of 39.94 percent at a 95 percent confidence level. For a measured 2-isopropylthioxanthone concentration of 0.85 milligrams per kilogram in a pellet batch, the expanded uncertainty is plus or minus 0.34 milligrams per kilogram ~ putting the true concentration somewhere between 0.51 and 1.19 milligrams per kilogram.

Worked Sensitivity Case on Threshold Compliance
Consider a packaging converter purchasing recycled polypropylene pellets for a cosmetic jar application with a strict internal non-intentionally added substance limit of 0.05 milligrams per kilogram for 4-methylbenzophenone. The supplier provides a single-point test report showing 0.038 milligrams per kilogram and declares the batch compliant. However, the testing lab used ultrasonic liquid extraction with single-point calibration without assessing matrix recovery or lot heterogeneity.
Applying the bottom-up uncertainty model to their preparation parameters reveals a true combined relative expanded uncertainty of 48.0 percent. Upper Bound Verification:
Reported Value: 0.038 mg/kg
Expanded Uncertainty: +/- 48.0% (k = 2)
Absolute Uncertainty: 0.038 * 0.480 = 0.0182 mg/kg
Upper Confidence Bound (95%): 0.038 + 0.0182 = 0.0562 mg/kg Because the upper confidence bound exceeds the buyer limit of 0.050 milligrams per kilogram, a single test result cannot prove compliance with statistical confidence. If enforcement authorities or customer qualification audits resample the material, the probability of getting a test value above the threshold reaches thirty-one percent.
Unquantified uncertainty shifts risk directly onto the downstream entity placing the finished article on the market. If an auditor samples a batch exhibiting high positive variance, the product faces non-compliance notices, withdrawals, and inventory write-offs. Supply contracts should therefore specify that non-intentionally added substance limits apply to the upper bound of the expanded measurement uncertainty interval at ninety-five percent confidence, rather than the unadjusted nominal laboratory result.


Assay
Evaluating compliance for recycled polyolefin articles intended for food contact requires translating matrix concentrations into specific migration into food simulants. Regulation (EU) 10/2011 establishes specific migration limits for authorized substances and enforces a default threshold of 0.01 milligrams per kilogram (10 parts per billion) for unauthorized non-intentionally added substances that are not mutagenic, carcinogenic, or toxic to reproduction. Under Commission Regulation (EU) 2022/1616, mechanical polyolefin recycling streams face strict decontamination and quality control mandates.
Photoinitiators from printing inks fall outside the positive list of authorized substances in Annex I of Regulation (EU) 10/2011 unless explicitly listed: benzophenone carries a specific migration limit of 0.60 milligrams per kilogram, whereas 4-methylbenzophenone and 2-isopropylthioxanthone lack specific authorization and fall under the 0.01 milligram per kilogram default threshold.

Specific Migration Testing and Simulant Interactions
Migration testing places the recycled plastic article in contact with official food simulants under standardized time and temperature conditions defined in Annex III and Annex V of Regulation (EU) 10/2011. Long-term storage at room temperature is tested by exposure for 10 days at 40 degrees Celsius. For fatty foods, the regulation specifies simulant D1 (50 percent ethanol in water) or simulant D2 (vegetable oil or alternatives like isooctane and 95 percent ethanol).
Polyolefins swell considerably in lipophilic simulants: isooctane and 95 percent ethanol penetrate the amorphous network of polyethylene and polypropylene rapidly, accelerating photoinitiator diffusion by orders of magnitude compared to real fatty foods like butter or meat. Migration Test Conditions (Regulation (EU) 10/2011):
+———————–+————————+—————————+
| Food Simulant | Intended Food Contact | Standard Test Regime |
+———————–+————————+—————————+
| Simulant A (10% EtOH) | Aqueous foods | 10 days at 40 deg C |
| Simulant B (3% AcOH) | Acidic foods (pH < 4.5)| 10 days at 40 deg C | | Simulant D1 (50% EtOH)| Fatty / alcoholic foods| 10 days at 40 deg C | | Simulant D2 (Oil/EtOH)| Pure fatty foods | 10 days at 60 deg C | +-----------------------+------------------------+---------------------------+

Diffusion Modeling versus Physical Contact Testing
Migrating substance quantities can be estimated through deterministic mathematical diffusion modeling based on Fickian second law equations, as recognized by European food safety authorities. The Piringer model calculates the diffusion coefficient D_P of an organic migrant in a specific polymer based on the migrant molecular weight, polymer matrix parameters (A_P values), and absolute contact temperature.
Piringer Diffusion Coefficient Model:
D_P = D_0 * exp( A_P’ – alpha * M_r^(2/3) + (E_A / R) * ( 1/T_ref – 1/T ) )
Where:
A_P’ = Polymer-specific matrix parameter (e.g. HDPE = 14.5, PP = 13.1)
M_r = Relative molecular weight of the photoinitiator
E_A = Activation energy of diffusion in the polymer network
T = Contact temperature in Kelvin Conservative diffusion modeling assumes zero initial migrant concentration in the food simulant and an infinite partition coefficient favoring migration into the food phase. For post-consumer polyolefins, calculating migration from residual matrix concentrations requires exact knowledge of initial bulk levels.
If input matrix concentrations carry an expanded measurement uncertainty of plus or minus 40 percent, calculated migration values scale linearly with that error, generating wide compliance uncertainty bands.
| Target Compound | Initial Resin Conc. (mg/kg) | Modeled Migration (mg/kg food) | Measured Migration (mg/kg food) | Specific Migration Limit (mg/kg) | Compliance Status |
|---|---|---|---|---|---|
| Benzophenone | 1.45 +/- 0.35 | 0.24 +/- 0.06 | 0.18 +/- 0.04 | 0.60 | Pass (Documented) |
| 4-Methylbenzophenone | 0.22 +/- 0.08 | 0.036 +/- 0.013 | 0.028 +/- 0.007 | 0.01 (Screening) | Fail (Exceeds 10 ppb) |
| 2-Isopropylthioxanthone | 0.08 +/- 0.03 | 0.012 +/- 0.005 | 0.009 +/- 0.003 | 0.01 (Screening) | Borderline / Ambiguous |
| Irgacure 907 | 0.15 +/- 0.05 | 0.021 +/- 0.007 | 0.014 +/- 0.004 | 0.01 (Screening) | Fail (Exceeds 10 ppb) |
| Omnirad 819 | 0.45 +/- 0.15 | 0.048 +/- 0.016 | 0.031 +/- 0.009 | 0.01 (Screening) | Fail (Exceeds 10 ppb) |
The data demonstrates that for unauthorized non-intentionally added photoinitiators like 2-isopropylthioxanthone, the measured migration value of 0.009 milligrams per kilogram sits below the 0.010 milligram per kilogram threshold, but its upper analytical uncertainty bound (0.012 milligrams per kilogram) crosses into non-compliance.

Toxicological Risk Assessment and Thresholds of Toxicological Concern
Substances lacking explicit toxicological evaluations in Annex I of Regulation (EU) 10/2011 undergo risk assessment via the Threshold of Toxicological Concern concept pioneered by the European Food Safety Authority. Chemical structures are categorized into Cramer Classes based on chemical reactivity and functional alerts: Cramer Class I compounds possess simple chemical structures and low oral toxicity, with a human intake threshold of 1,800 micrograms per person per day (equivalent to 0.03 milligrams per kilogram food). Cramer Class II substances represent intermediate toxicity profiles, with an intake threshold of 540 micrograms per person per day (0.009 milligrams per kilogram food). Cramer Class III chemicals contain complex aromatic structures, heteroatoms, or reactive functional groups, carrying an intake limit of 90 micrograms per person per day (equivalent to 0.0015 milligrams per kilogram food or 1.5 parts per billion). Genotoxic Alerts require reduction of dietary exposure to below 0.15 micrograms per person per day (0.0025 micrograms per kilogram food), ruling out the use of default thresholds. Most industrial photoinitiators fall into Cramer Class III due to their substituted polycyclic aromatic rings, keto groups, and heteroatoms. The acceptable migration limit for a Cramer Class III non-intentionally added substance corresponds to 1.5 parts per billion in food. Standard multi-analyte gas chromatography screening methods cannot achieve a limit of quantification of 1.5 parts per billion in complex fatty food simulants. When an analytical laboratory reports a non-detected result with an instrument detection limit of 10 parts per billion, the test does not prove toxicological safety for a Cramer Class III photoinitiator. The gap between the 10 parts per billion screening detection limit and the 1.5 parts per billion toxicological safety threshold represents an unmonitored exposure risk in post-consumer polyolefins. Functional barriers offer an engineering route to mitigate this migration risk. In a co-extruded multilayer structure, an internal virgin polymer layer, an ethylene vinyl alcohol copolymer layer, or an inorganic silicon oxide coating separates the recycled polyolefin core from the food contact surface. The virgin barrier layer slows the diffusion of semi-volatile photoinitiators, extending the breakthrough time beyond the commercial shelf life of the packaged foodstuff. The effectiveness of a functional barrier depends on layer thickness, storage temperature, migrant molecular size, and operational shelf life. A fifty-micrometer virgin polypropylene layer provides a functional barrier against benzophenone migration at 20 degrees Celsius for up to six months. At 40 degrees Celsius, the breakthrough time drops to under thirty days as thermal activation increases the diffusion coefficient within the barrier layer. Packaging compliance files must document barrier effectiveness through validated physical shelf-life testing or validated numerical mass transport calculations. Relying on generic supplier claims of functional barrier performance without specific time-temperature-migrant transport data invalidates the Declaration of Conformity. The central unresolved challenge remains whether mechanical recycling technologies can reliably strip semi-volatile photoinitiator concentrations down to levels where analytical quantification uncertainty no longer dictates the pass-fail boundary of food contact compliance files.