Isolating Semi Crystalline Polymer Crystallinity Density Shifts via DSC Annealing
DSC annealing isolates true polymer density from processing thermal history by separating secondary crystalline growth from baseline backbone morphology.

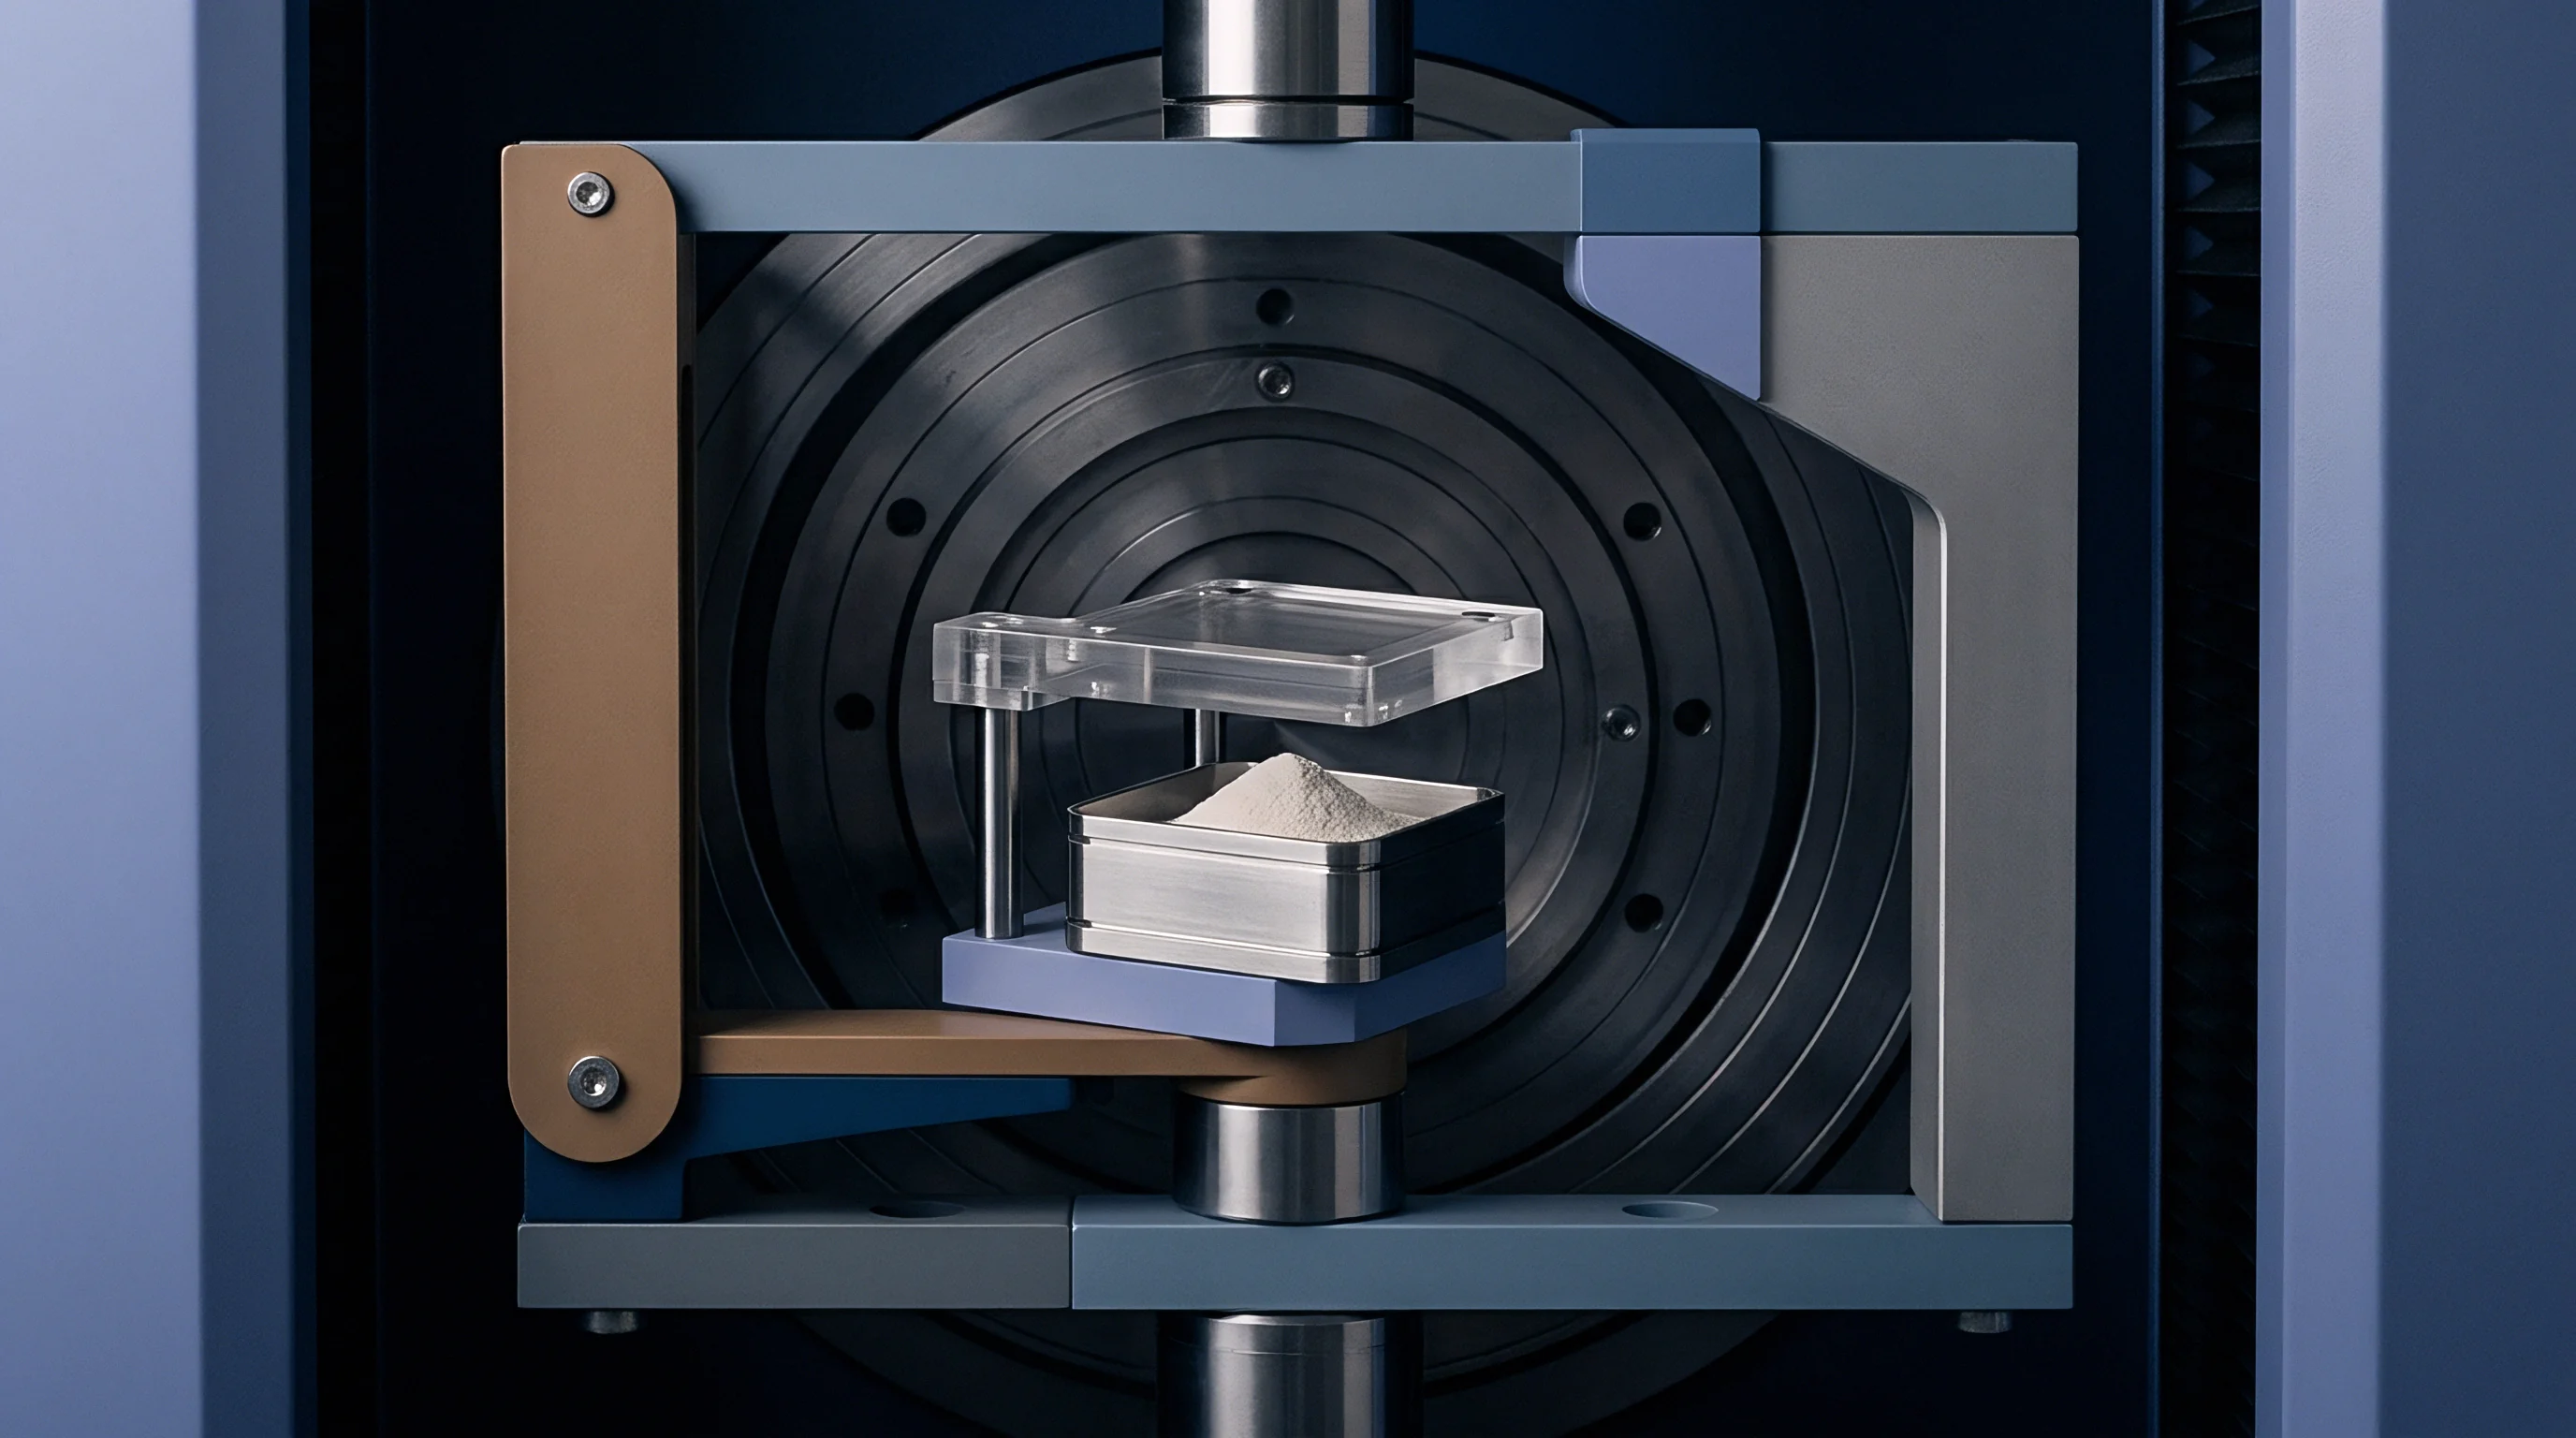
Pan
Differential scanning calorimetry captures the thermal signature of semi-crystalline polymers by recording heat flow across precise temperature ramps. When molded parts or extruded profiles exhibit unexpected dimensional changes, warpage, or environmental stress cracking in service, solid-state density variations represent the underlying physical mechanism. A standard density column measures the net bulk density, pooling the effects of molecular architecture and processing thermal history into a single floating value.
Controlled annealing inside a hermetically sealed aluminum capsule separates these confounded variables. Subjecting the specimen to programmed thermal dwell times isolates reversible processing history from irreversible chain morphology.
Specimen preparation governs the fidelity of the heat flow signal. Operators punch circular discs weighing between 5 mg and 8 mg from the core of the molded component, avoiding sheared edges that introduce localized orientation and cold-drawing artifacts. The pan lid requires cold-welding under an arbor press to eliminate thermal contact resistance between the polymer sample and the sensor pedestal.
Gas purge rates remain fixed at 50 mL/min of high-purity dry nitrogen to prevent oxidative degradation during high-temperature dwell stages above 200 °C.
Baseline drift exceeding 0.05 mW across an empty cell calibration run invalidates the subsequent integration limits for crystalline enthalpy.
The standard single-heating cycle fails to identify why two shipments of identical nominal density behave differently in secondary forming operations. A first heating scan up to 30 °C above the equilibrium melting point erases processing history, recording the as-received crystalline fraction, lamellar thickness distribution, and frozen enthalpy of relaxation. Cooling at a steady, reference state rate of 10 °C/min followed by an isothermal hold below the crystallization temperature forces lamellar thickening under controlled kinetic conditions.
The subsequent second heat reveals the structural baseline of the macromolecular backbone.
- Hermetic pan selection prevents volatile loss and plasticizer migration during extended thermal cycles.
- Sample specimen mass stays within tight bounds to suppress internal thermal gradients during high-rate temperature transitions. The pan interface geometry ensures uniform heat transfer.
- Nitrogen purge purity protects polyamides and polyesters from hydrolytic and thermo-oxidative chain scission at elevated plateaus.
- Thermal contact baseline checks confirm flat sensor response before committing resin specimens to multi-hour annealing programs.
Fast-quenched skins on injection-molded components exhibit low initial density and depressed crystalline fractions. Core sections cool slowly, developing thick lamellae and elevated spherulitic content. Running DSC annealing scans across microtomed slices taken at progressive depths from surface to core maps this spatial gradient directly.
Process engineers use these scans to adjust mold cooling circuit temperatures, cycle times, and packing pressures.
Secondary crystallization proceeds slowly at ambient storage conditions, driving post-mold shrinkage and spontaneous embrittlement over months of warehouse storage. Laboratory thermal conditioning accelerates this mechanism into a quantifiable testing window. Placing the encapsulated specimen at a designated annealing temperature below the primary melting onset activates segmental chain mobility within the rigid amorphous fraction.
Folded chains reorganize into existing crystal lamellae, raising density without requiring resin reprocessing.
Thick lamellae resist low-temperature relaxation cycles.
Enthalpy
Latent heat of fusion values derived from peak area integration provide the thermodynamic foundation for calculating crystalline mass fraction. Integrating the endothermic transition between the baseline takeoff point and the post-melt recovery line yields the total enthalpy change in Joules per gram. Comparing this measured enthalpy against the theoretical heat of fusion for an infinite crystal lattice produces the precise degree of crystallinity.
Can Isothermal Annealing Isolate Secondary Lamellar Growth?
Holding the polymer at temperatures between the glass transition and the melting point drives lamellar thickening, causing distinct secondary endothermic peaks on subsequent heating runs. High-density polyethylene held isothermally at 120 °C exhibits progressive ripening of metastable crystals. The original melting peak remains intact while an annealing peak develops directly above the conditioning temperature, tracking the volume of newly organized crystalline mass.
The calculation of crystallinity converts enthalpy measurements into volumetric metrics through two-phase thermodynamic modeling. The crystalline volume fraction relates directly to bulk density through the specific volumes of the isolated phases:
- Run a continuous baseline heating scan from 20 °C to 200 °C at 10 °C/min per ISO 11357-3 to capture the as-received fusion enthalpy.
- Cool the specimen at 10 °C/min to the selected annealing plateau to standardize crystallization conditions.
- Hold the specimen isothermally for a duration between 30 and 120 minutes to permit secondary crystal growth.
- Ramp temperature back to 200 °C at 10 °C/min, integrating the distinct low-temperature endotherm generated during the dwell step.
- Divide the integrated enthalpy by the theoretical reference value to isolate the secondary crystalline fraction from baseline crystallization.
Calorimetric testing relies on reliable published values for the 100% crystalline enthalpy of reference materials. Literature sources document established thermodynamic constants for common commercial resins, though resin compounds filled with mineral fillers or impact modifiers require ash correction before applying the mathematical relationship.
| Polymer Matrix Grade | Reference Heat of Fusion (J/g) | Amorphous Density (g/cm³) | Crystalline Density (g/cm³) | Standard Melting Peak (°C) |
|---|---|---|---|---|
| High Density Polyethylene | 293.0 | 0.855 | 1.000 | 132 |
| Polypropylene Homopolymer | 207.0 | 0.855 | 0.946 | 163 |
| Polyamide 66 Unfilled | 255.0 | 1.070 | 1.240 | 262 |
| Polybutylene Terephthalate | 142.0 | 1.280 | 1.410 | 225 |
| Polyoxymethylene Copolymer | 247.0 | 1.338 | 1.492 | 166 |
Different integration limits alter reported crystalline content significantly. A straight linear baseline drawn across the entire melting envelope incorporates high-temperature premelting and reorganizational processes. Sigmoidal baselines match the changing heat capacity of the specimen across the transition phase, yielding conservative enthalpy values.
Applying identical baseline construction techniques across lot inspections ensures repeatable comparative tracking.
A measured heat of fusion of 175.8 J/g for an unfilled high-density polyethylene specimen tested at 10 °C/min corresponds to exactly 60.0 percent crystalline mass fraction.
Contractual specifications under ISO 11357-3 mandate explicit documentation of baseline start and end temperatures to resolve disputes regarding resin compliance.

Shrinkage
Volumetric contraction in injection-molded components tracks crystalline phase formation. Amorphous domains contract at a lower thermal expansion coefficient, whereas polymer chains folding into dense, orderly crystalline lattices drive substantial volume reduction. When parts drop below the ejection temperature with incomplete crystallization, latent shrinkage persists within the finished geometry.

Does Flotation Density Match Calorimetric Crystal Volume?
Discrepancies frequently arise between density measurements obtained via liquid displacement and crystalline fractions derived from differential scanning calorimetry. Buoyancy techniques measure total part density, incorporating voids, skin-core density variations, micro-porosity, and processing stress fields. Calorimetry targets specific heat absorption associated with phase transitions in sub-gram specimens.
Calculating bulk density strictly from DSC data assumes a simple binary phase model, omitting intermediate rigid amorphous fractions that display distinct densification behavior without generating melting endotherms.
Tooling dimensions rely on predictable material contraction factors. Variations in resin crystallization kinetics alter final part dimensions, creating severe tolerance stack errors in precision assemblies. Processing facilities that encounter dimensional drift use DSC annealing protocols to identify whether out-of-spec dimensions stem from inadequate mold cooling cycles or unannounced lot-to-lot shifts in raw polymer crystallization rates.
| Thermal Treatment Conditioning | DSC Enthalpy (J/g) | Calculated Crystallinity (%) | Apparent Density (g/cm³) | Linear Post-Mold Shrinkage (%) |
|---|---|---|---|---|
| Quenched Water Bath (15 °C) | 82.8 | 40.0 | 0.891 | 1.15 |
| Standard Mold Cycle (40 °C) | 97.3 | 47.0 | 0.898 | 1.52 |
| Hot Tool Cycle (80 °C) | 111.8 | 54.0 | 0.905 | 1.90 |
| Post-Mold Annealed (120 °C, 2 hr) | 124.2 | 60.0 | 0.912 | 2.35 |
Molders adjusting cooling line flow rates induce profound shifts in part stability. Fast cycles quench parts rapidly, locking in low crystalline content and low bulk density. Subsequent shipping inside warm freight containers activates secondary crystallization, producing late shrinkage in customer facilities.
Controlled annealing cycles reveal the maximum shrinkage potential of the molded geometry before assembly occurs.
Crystalline fraction governs part dimensions more aggressively than thermal contraction coefficients alone.
Uncontrolled crystallization in downstream assembly operations leads directly to stress cracking around metal inserts, fastener torque loss, and field component failure.

Inspection
Incoming quality control protocols on railcar and bag deliveries of semicrystalline resins depend on detecting unauthorized modifications to grade formulations. Pellet density values listed on supplier certificates of analysis often obscure variations in nucleating agent concentration, regrind inclusion, or molecular weight distribution shifts. Receiving docks that verify resin lots solely through melt flow rate testing miss significant deviations in solidification behavior that disrupt automatic molding cycles.
Annealing protocols performed in the testing laboratory isolate intrinsic resin properties from pelletization history. Underwater pelletizers produce rapidly quenched spheres with suppressed surface crystallinity, whereas strand pelletizers produce cylinders with slower cooling profiles and higher baseline density. Testing as-received pellets yields deceptive variations that disappear once a standard DSC melt-quench-reheat cycle resets the thermal baseline.
The crystallization peak temperature recorded during controlled cooling at 10 °C/min serves as a direct indicator of nucleating efficiency and molecular purity.
Field failures traced to excessive post-mold warpage typically reveal the fingerprints of process contamination or unannounced additive adjustments. Laboratory evaluation identifies specific red flags in thermal traces:
- Bimodal crystallization peaks during cooling sweeps indicate dry blending of distinct resin streams or cross-contamination from unpurged compounding extruders.
- Elevated crystallization onset temperatures exceeding nominal datasheet values by more than 4 °C signal unapproved additions of clarifying or nucleating masterbatches. The compounder accelerates cycle times at the expense of part ductility.
- Premature low-temperature melting tails demonstrate high fractions of recycled material containing degraded, short-chain polymer fragments. Chain scission accelerates secondary crystallization kinetics.
- Depressed heat of fusion during isothermal dwell checks points to excessive comonomer content or incomplete phase separation in impact-modified copolymers.
Consider an inspection scenario for a 20-tonne shipment of injection-molding grade polyoxymethylene. The technical data sheet specifies a bulk density of 1.410 g/cm³ and a melt volume rate of 8.0 cm³/10 min under 2.16 kg at 190 °C per ISO 1133. Flotation density testing shows an incoming lot density of 1.402 g/cm³, prompting immediate lot quarantine.
A rapid first-heat DSC run reveals a fusion enthalpy of 155.6 J/g, corresponding to 63.0% crystalline content compared to the standard reference value of 68.0%.
Subjecting specimens from the quarantined lot to isothermal annealing at 140 °C for 60 minutes drives crystalline reorganization. The subsequent reheat yields a normalized enthalpy of 167.9 J/g, recovering a calculated crystallinity of 68.0% and proving that the low initial density resulted from an aggressive underwater pelletization quench rather than chemical degradation or comonomer deviations. The lot releases to production without processing delays.
Suppliers explain away lot-to-lot density shifts as harmless variations in pelletizer cooling water temperature.
Dispute
Commercial contracts for engineering polymers ground financial penalties and lot rejections in verified failure to meet specification boundaries. Sourcing managers face considerable challenges when supplier certificates of analysis report density values measured under ASTM D792 or ISO 1183 that differ from the physical behavior seen on high-speed production tools. Establishing verifiable protocols for resolving dimensional disputes requires integrating calorimetric thermal testing into quality agreements.
Annealing protocols provide legally defensible evidence when components crack or warp in production. Standardizing thermal dwell times and peak integration techniques enables independent analytical laboratories to separate manufacturing errors from resin defects. If parts fail to achieve drawing dimensions despite proper tool temperatures, DSC annealing confirms whether the delivered resin lacks the crystallization kinetics necessary to solidify within standard cycle windows.
Procurement teams protect processing margins by embedding objective DSC metrics directly into master purchase contracts. Clauses must specify clear boundaries for secondary peak development, crystallization temperature ranges, and reference enthalpies obtained after erasing previous thermal histories. Tying raw material acceptance to intrinsic polymer morphology shields buyers from hidden resin reformulation and compounding line inconsistencies.
The boundary between reversible processing history and permanent chemical modification remains an open question when thermal degradation overlaps with extensive secondary crystalline reorganization during long-term field aging.