Tooling Surface Finishing Impact on Sample Part Geometry Validation
Cavity surface finish dictates interfacial heat transfer, ejection friction, and metrology scan accuracy, directly altering T1 sample part validation.
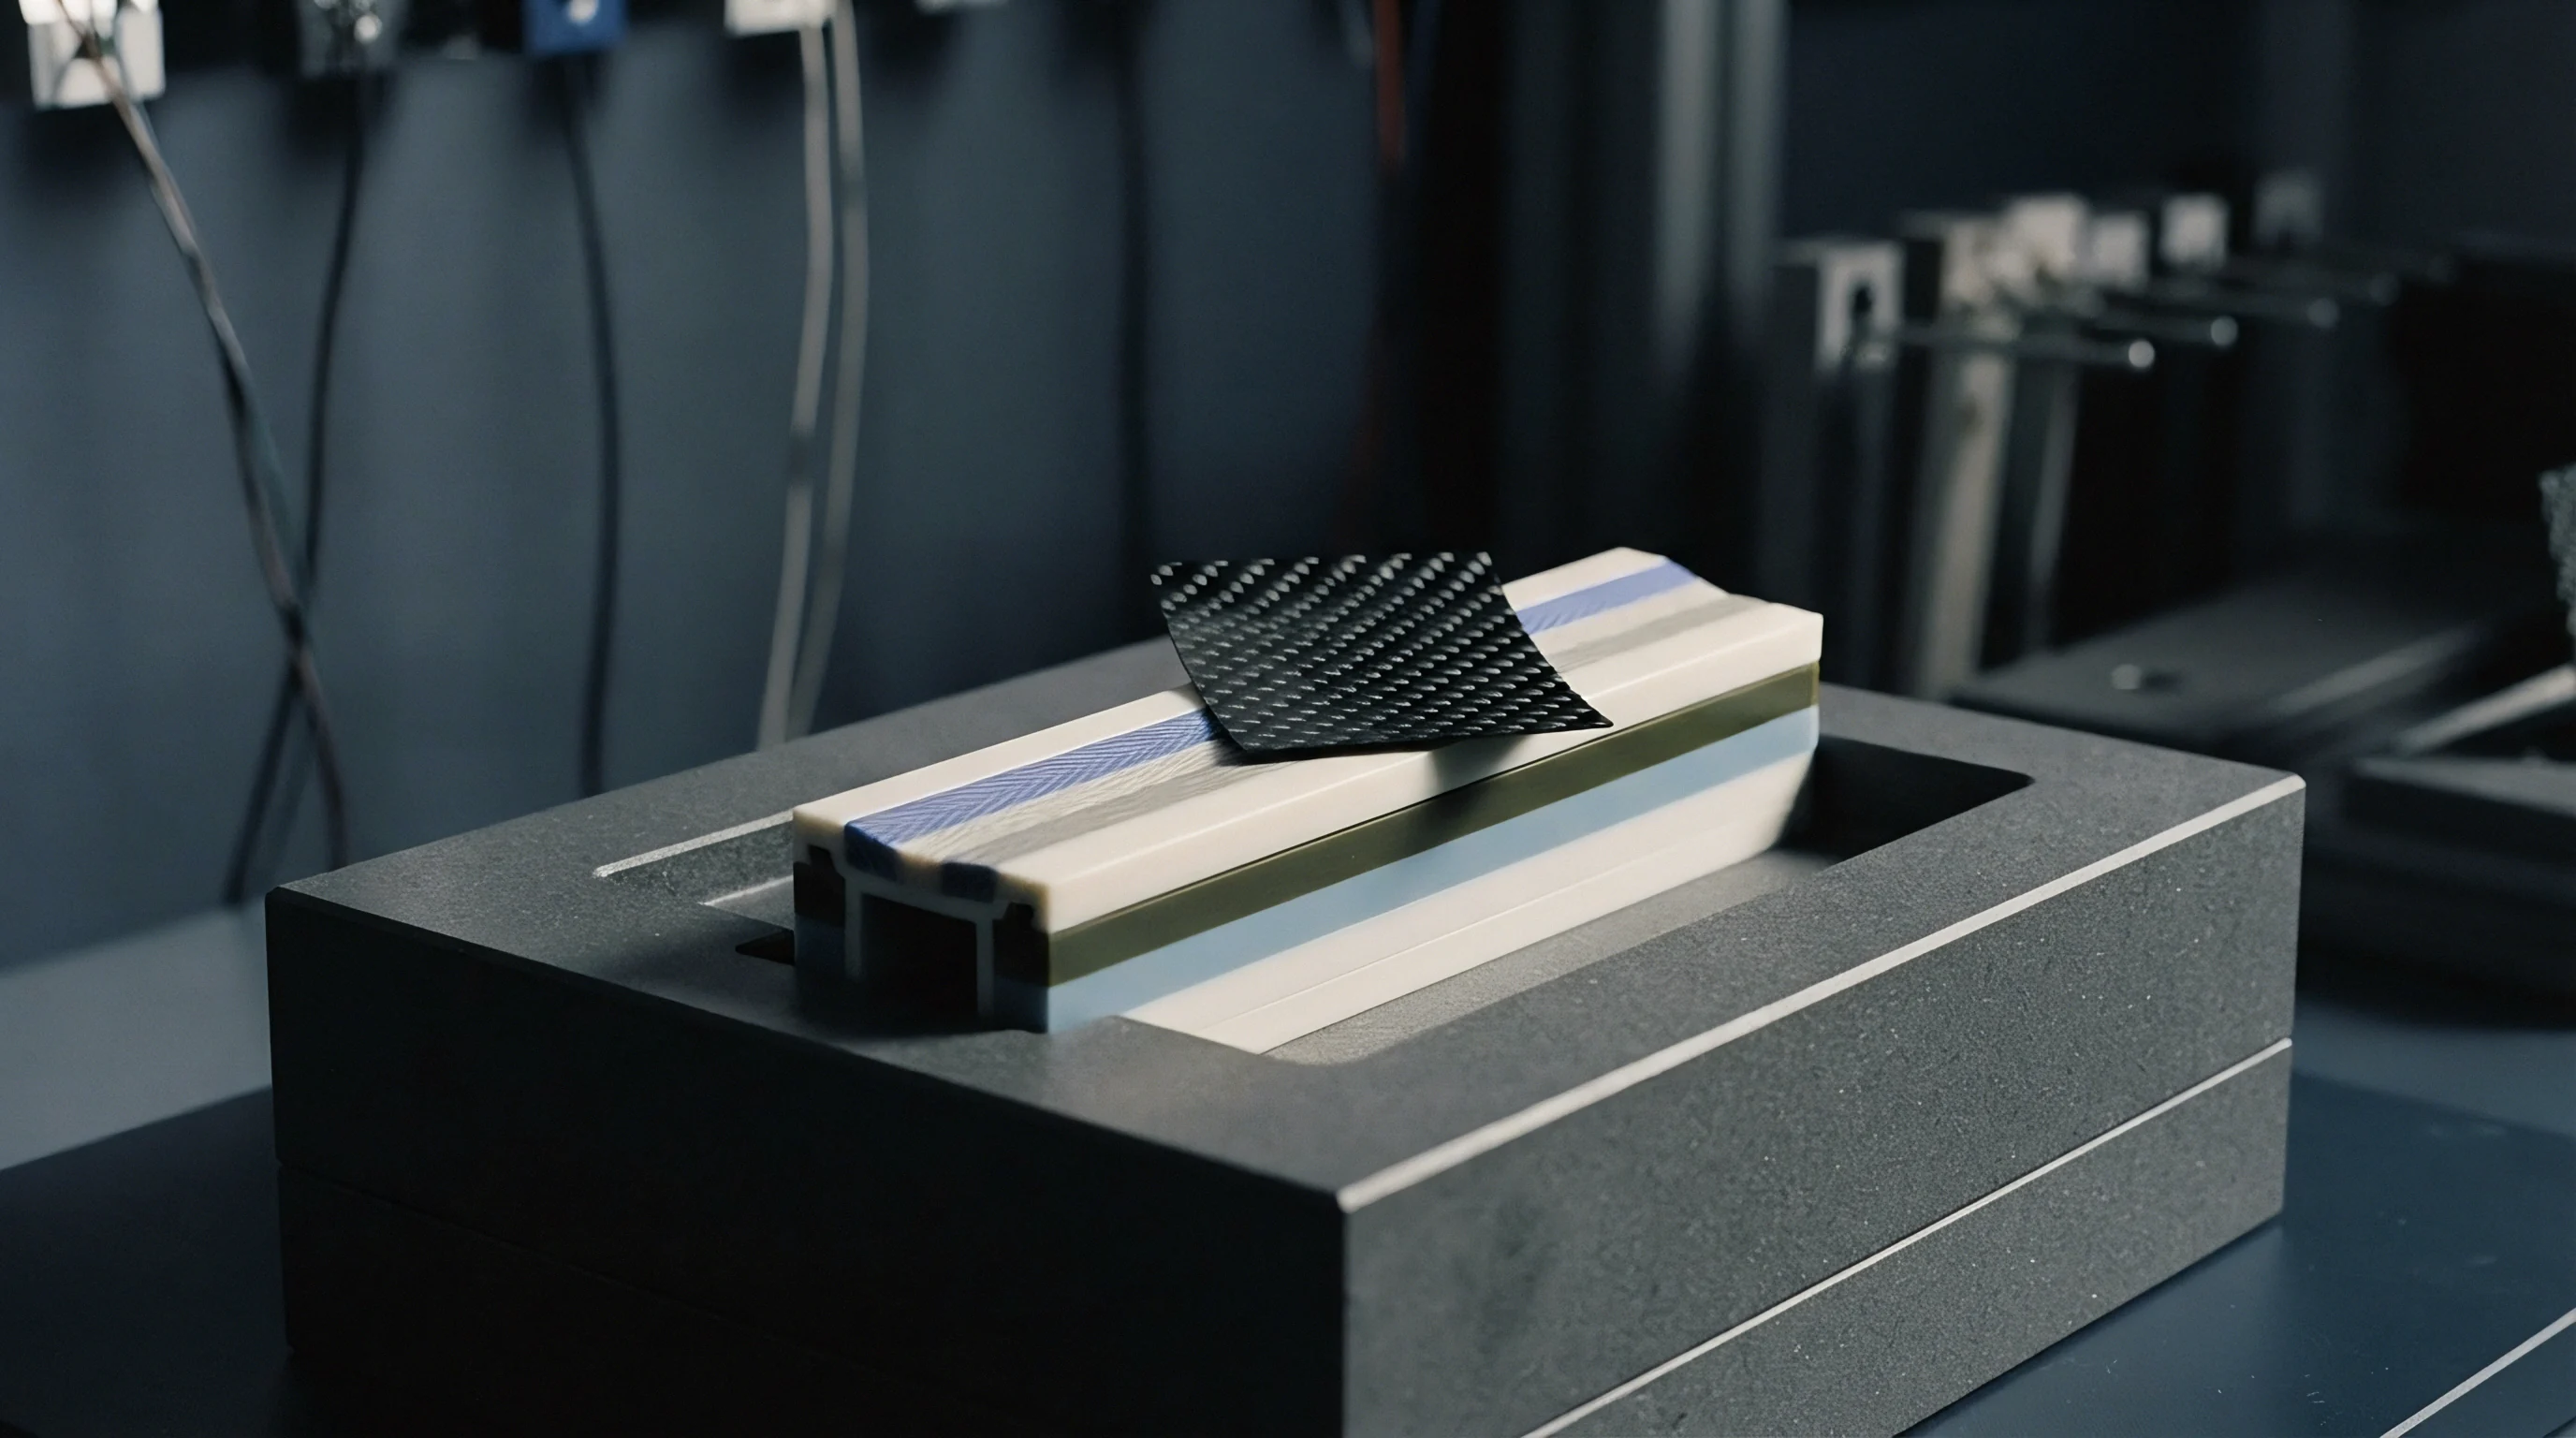

Texture
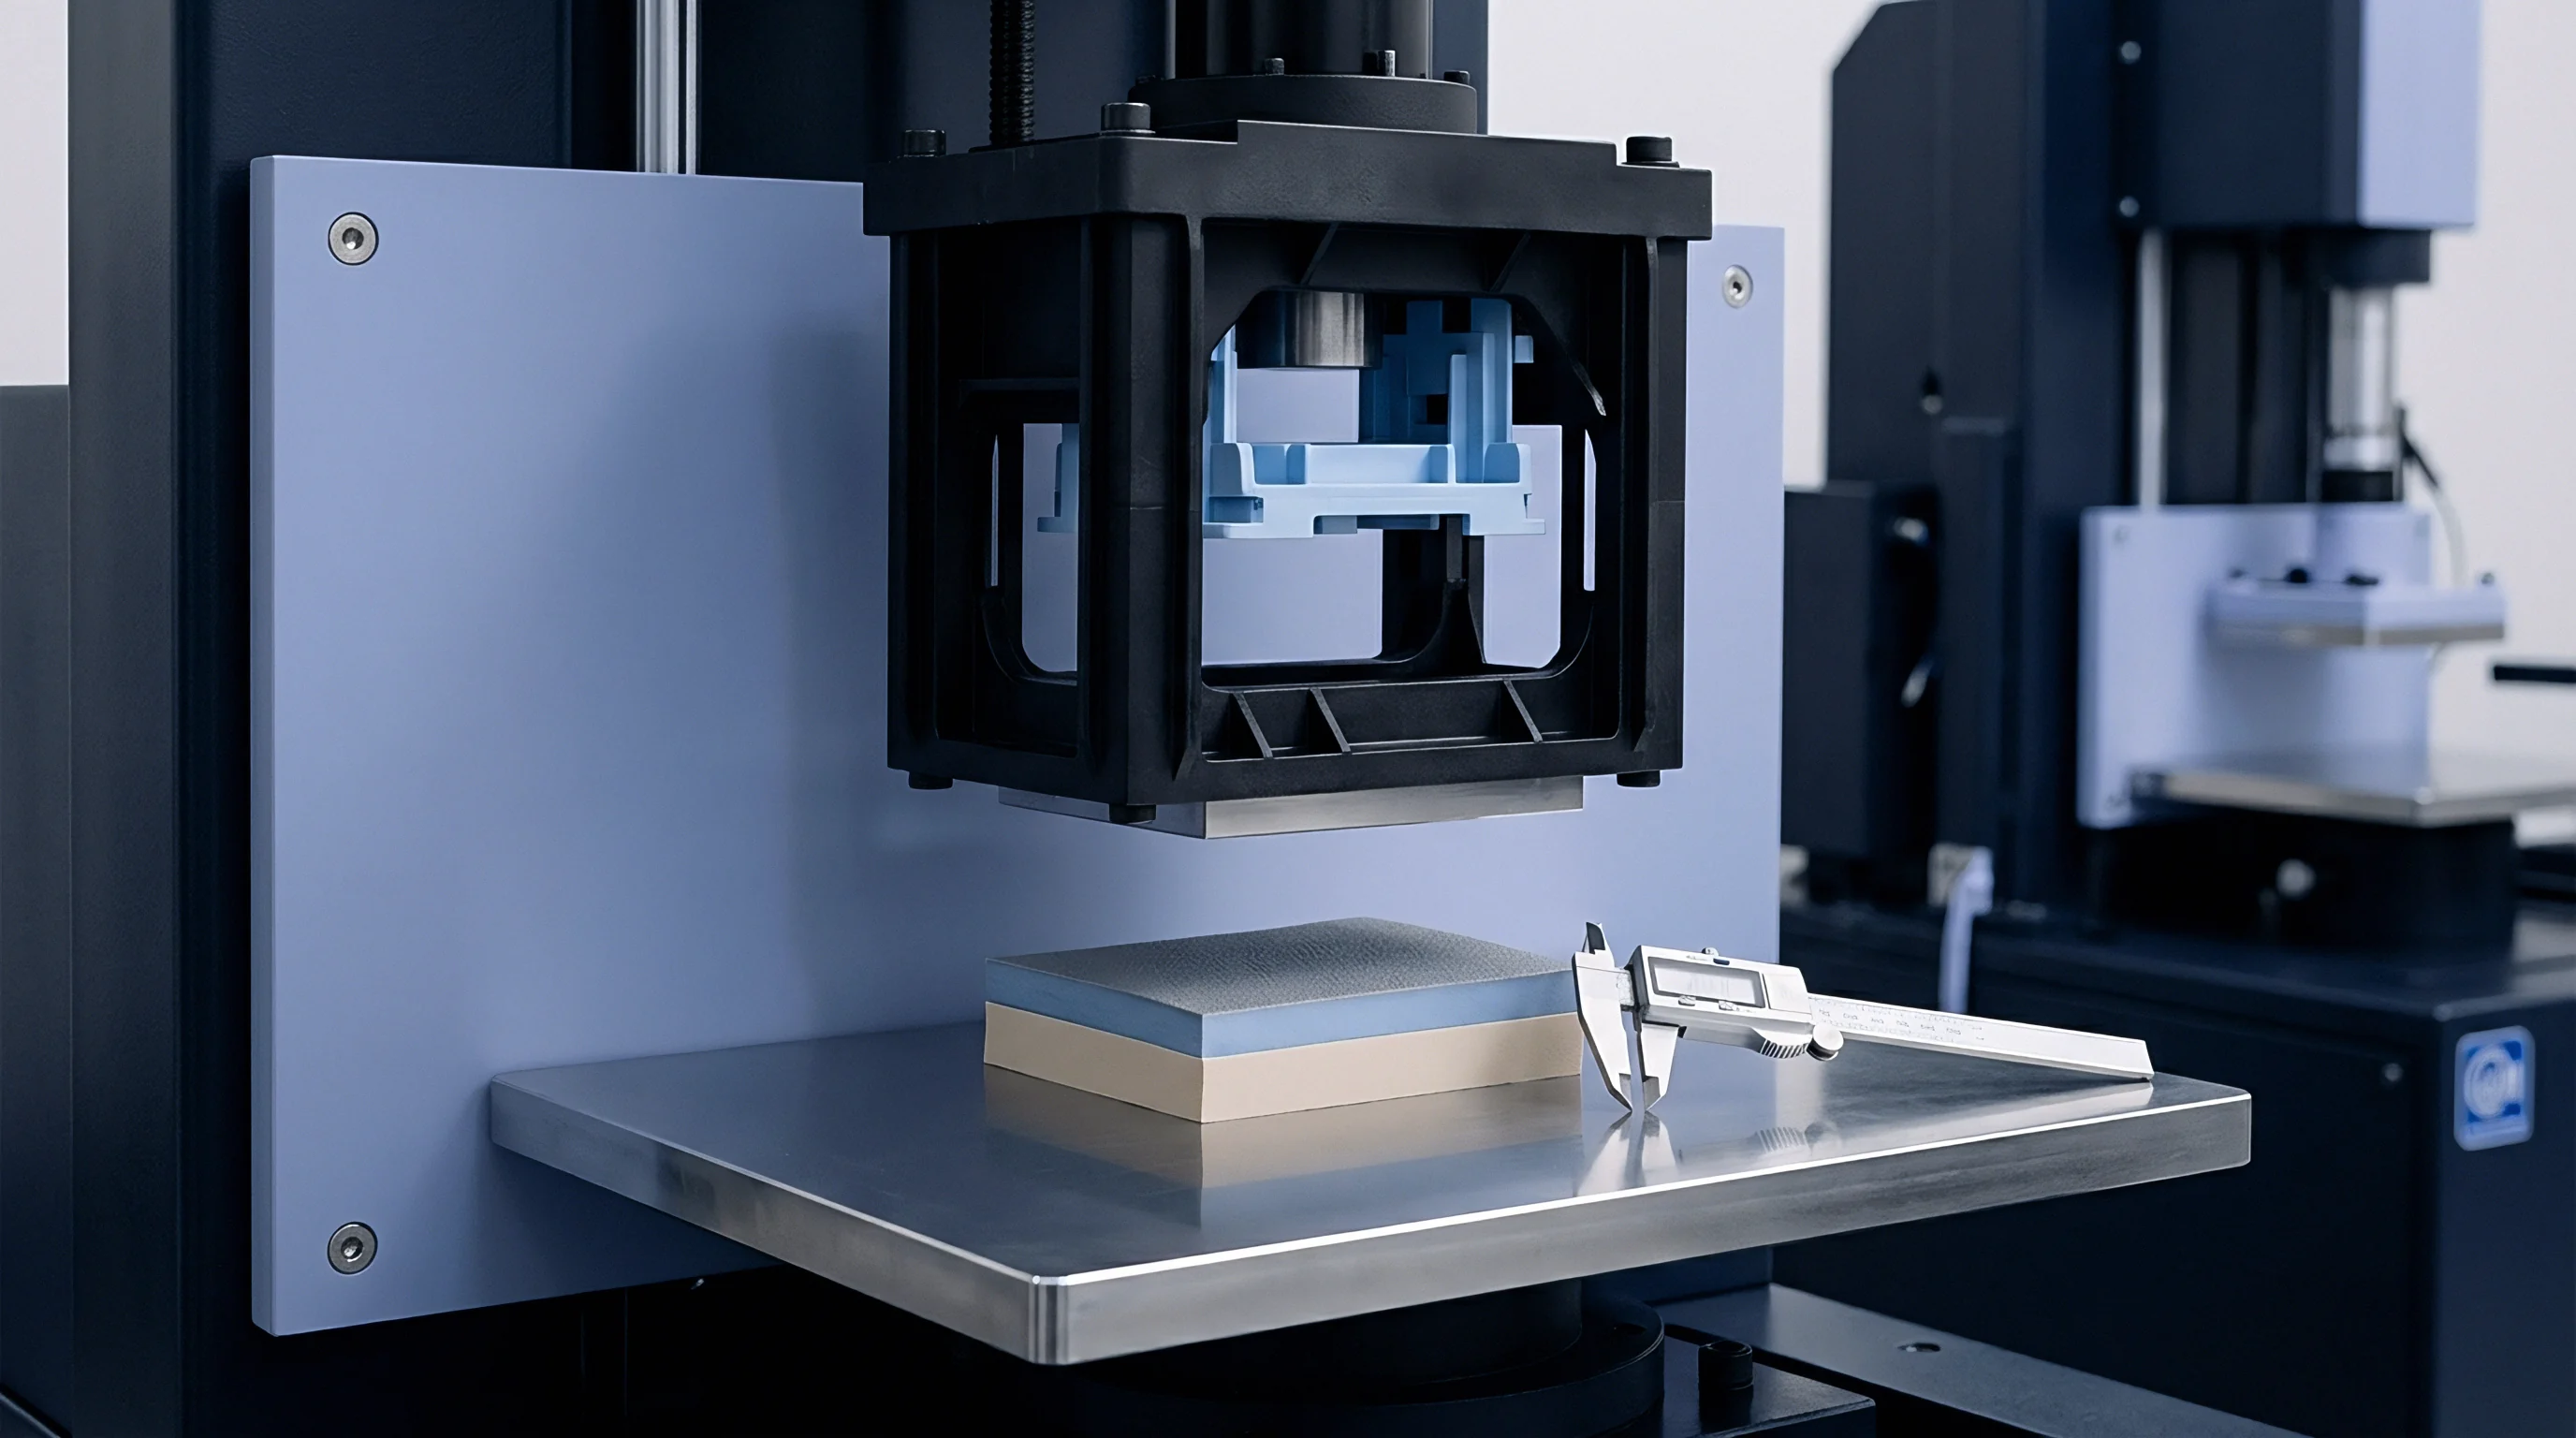
Micro-Topography Standards and Tooling Surface Classification
Tool steel cut by high-speed CNC milling, electrical discharge machining, or hand diamond compounding carries distinct micro-profiles that dictate polymer melt behavior against cavity walls. Standard designations from the Society of the Plastics Industry and the Verein Deutscher Ingenieure index arithmetic mean roughness (Ra) from mirror-polished steel down to coarse micro-structured cavities. An SPI grade A-1 diamond polish drops Ra below 0.012 micrometers, leaving an optically clear surface on amorphous polymers.
SPI grade B-3 paper finishes sit around 0.28 to 0.32 micrometers Ra, marked by directional grit lines from rotary tool passes. Spark-eroded finishes under the VDI 3400 standard run from VDI 12 (0.40 micrometers Ra) to VDI 45 (18.0 micrometers Ra), leaving non-directional, isotropic craters formed by periodic plasma discharges.
Initial off-tool moldings ~ T1 samples ~ frequently come from cavities that are still semi-finished. A shop often cuts core and cavity blocks to nominal CAD geometry with ball-nose mills or raw EDM burns, molding T1 parts well before final optical polishing or photo-etching. This order of operations creates a geometric gap between early samples and production parts.
Cutter marks with an 8-micrometer peak-to-valley height displace melt differently than a 90-micrometer photo-etched leather grain. Altering steel based on measurements taken from raw T1 samples, without adjusting for the final finish, usually means cutting metal twice.
Distinguishing surface features comes down to spatial frequency rather than height alone. Form error spans long spatial wavelengths across a part wall, waviness takes up middle wavelengths, and roughness operates at short spatial wavelengths. On fresh tool steel, high-speed ball-mill paths leave periodic cusps that act as local stress risers and micro-undercuts during initial molding runs.
Spark erosion leaves shallow hemispherical pits bordered by raised recast ridges; high-energy sparks harden the cavity surface into a brittle skin laced with micro-fissures, altering how melt slides across the steel during fill.
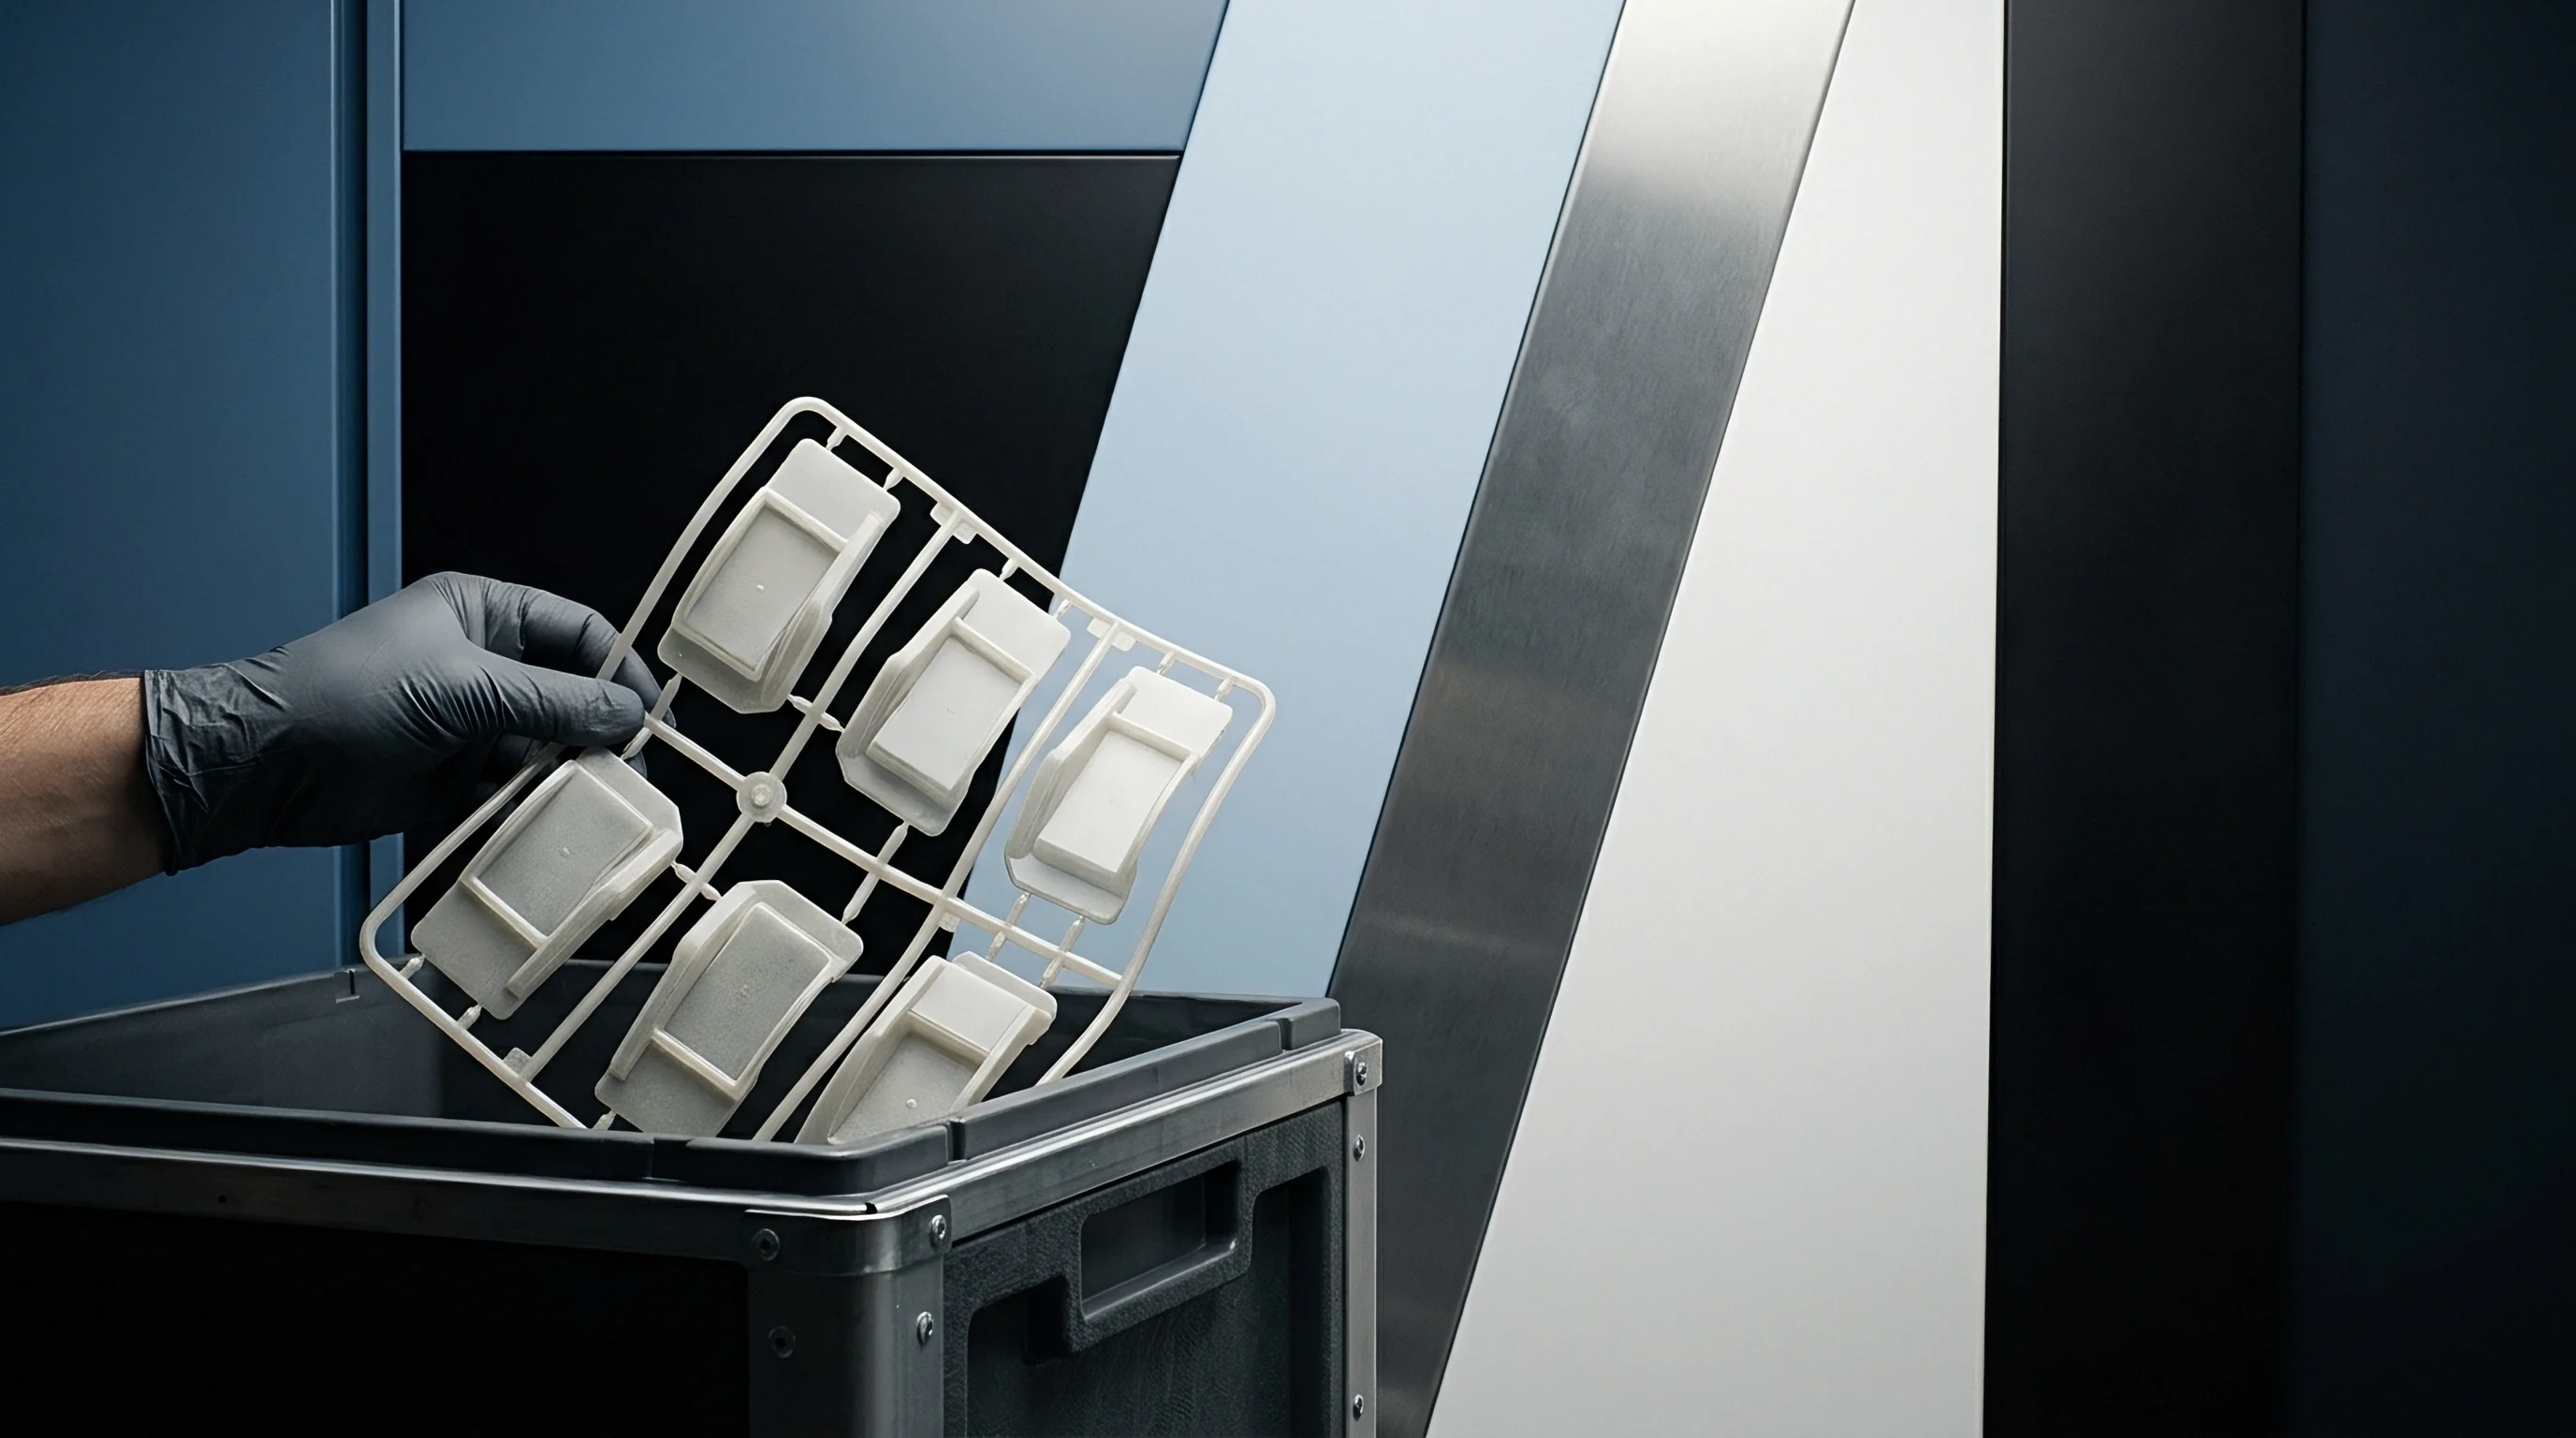
Melt Friction and Cavity Filling Kinetics
Polymer melt entering a cavity rolls forward via fountain flow rather than sliding cleanly, freezing a thin skin the instant it hits cold metal. Cavity roughness controls how tightly this initial frozen skin mechanically anchors during fill. On a polished SPI A-2 surface, minimal mechanical interlocking allows the advancing front to move evenly across the tool boundary.
A rough VDI 33 finish traps early polymer molecules inside micro-craters, spiking boundary shear along the skin immediately.
Anchoring the skin layer shifts wall shear stress profiles and changes local pressure transfer during packing. Greater friction at the cavity interface increases hydraulic pressure loss from the gate to the end of fill, forcing higher peak injection pressures to fill the volume. Amorphous resins such as polycarbonate and polyetherimide are sensitive to wall shear, showing flow marks and frozen-in stress near finish transitions.
Semi-crystalline resins like polyoxymethylene and polyamide 66 glide easily over smooth polished surfaces, but hesitate at the melt boundary when crossing abrupt changes in surface texture.
Micro-textured cavity surfaces set up steep local velocity gradients within the boundary skin. Shear rate spikes as melt crosses raised cutter crests or EDM crater rims, dropping local viscosity in pseudoplastic materials. While this shear thinning lowers resistance right at the wall, micro-turbulence over deep grit-blasted textures can trap tiny air pockets against the steel.
Trapped air acts as a thermal insulator, changing local cooling rates and altering physical part dimensions before ejection.
Tool designers usually scale cavity dimensions with a single linear shrink factor across the part model. That uniform assumption fails when surface finishes differ between the core and cavity sides. A section molded between an SPI A-2 polished cavity wall and a VDI 27 textured core wall sees asymmetric boundary shear while packing.
Polymer chains along the smooth cavity slip and relax, whereas chains on the rough core side lock into spark-eroded pits. This uneven anchoring causes lopsided thermal contraction through the wall thickness, locking in stress differentials before ejection.
Surface chemistry plays a significant role as well. Nickel-PTFE tool plating drops friction coefficients below 0.10, helping the skin slip during packing. Physical vapor deposition coatings like titanium nitride or chromium nitride protect sharp steel edges while lowering surface energy.
Uncoated tool steels heavily processed by EDM keep an amorphous oxide layer that grabs the polymer skin during initial production runs ~ a wall-drag condition molders often mistake for undersized cavities.
Toolrooms running T1 trials need to log the exact finish on every insert before hanging the mold. Evaluating part dimensions across different finishing stages means tracking Ra along with peak-to-valley height Rz and mean peak spacing Rsm. Ra alone is deceptive: a ground surface and a grit-blasted surface can both measure 0.80 micrometers Ra while behaving completely differently during demolding and heat transfer.
When T1 parts come up small, cavities are often intentionally left undersized to reserve cutter stock for final texturing, as acid etching will open up clearances and bring features back into spec.
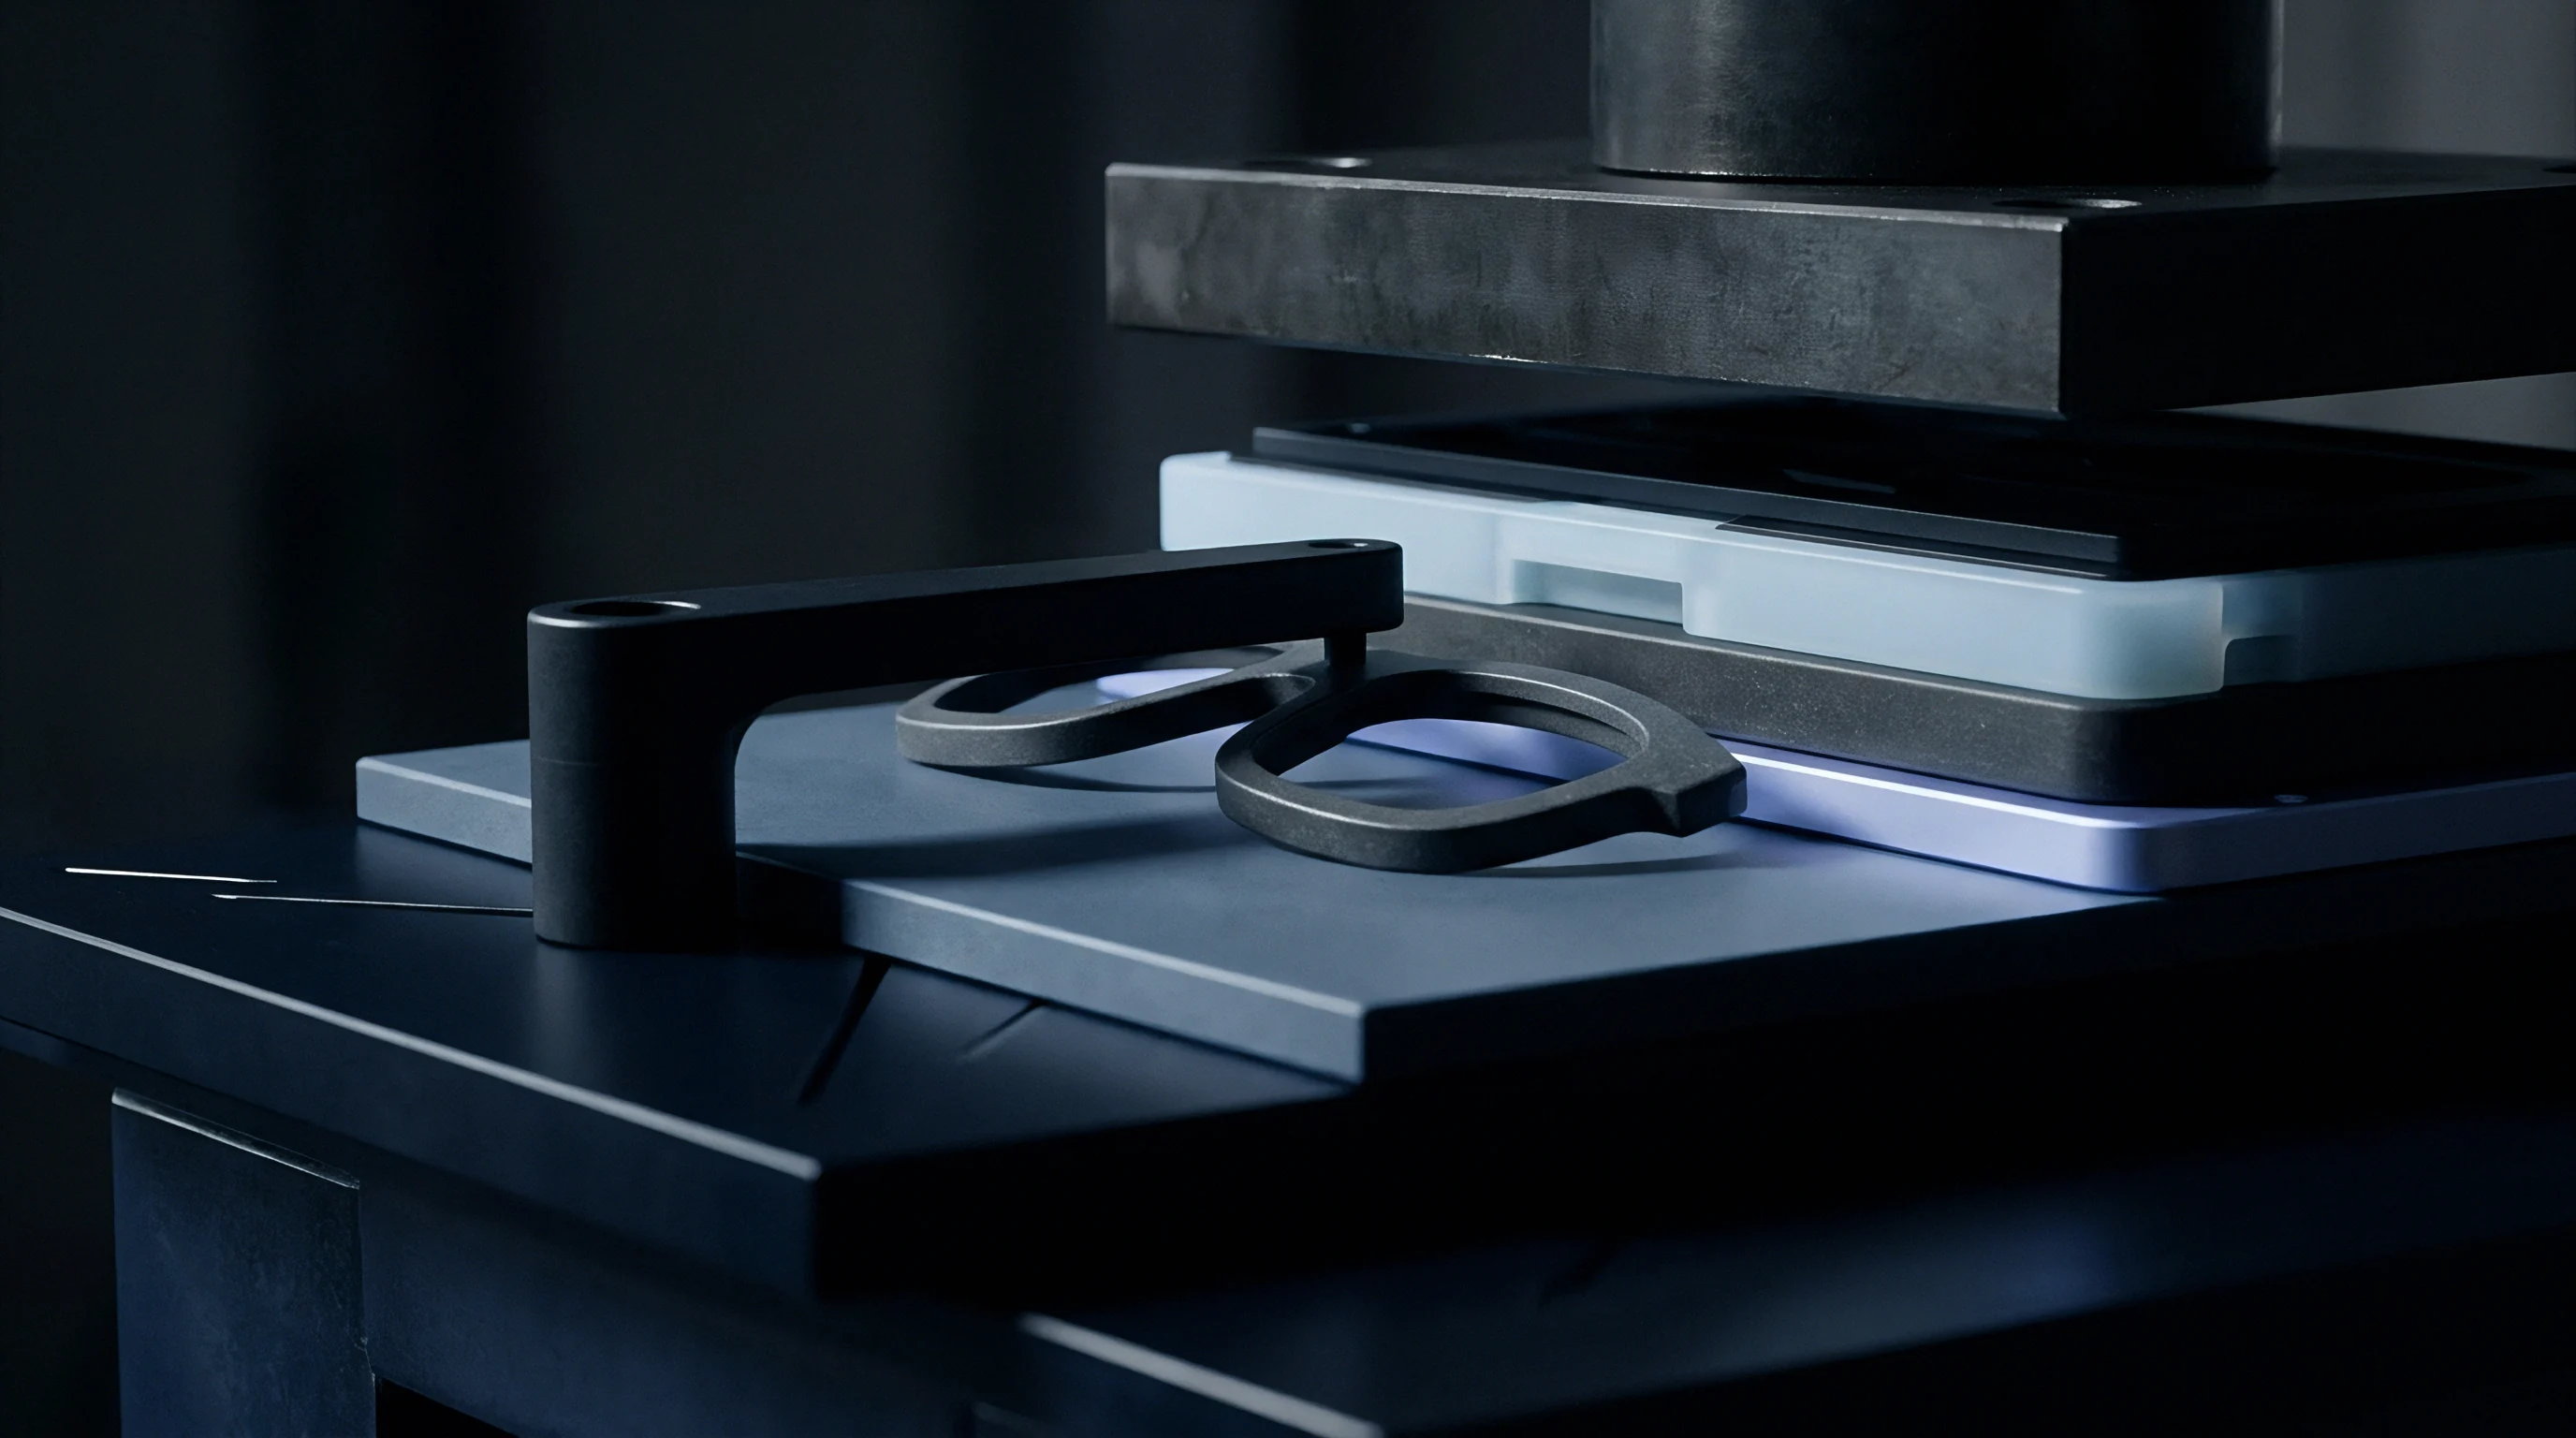

Drag
Ejection Force Dynamics and Mechanical Demolding Distortion
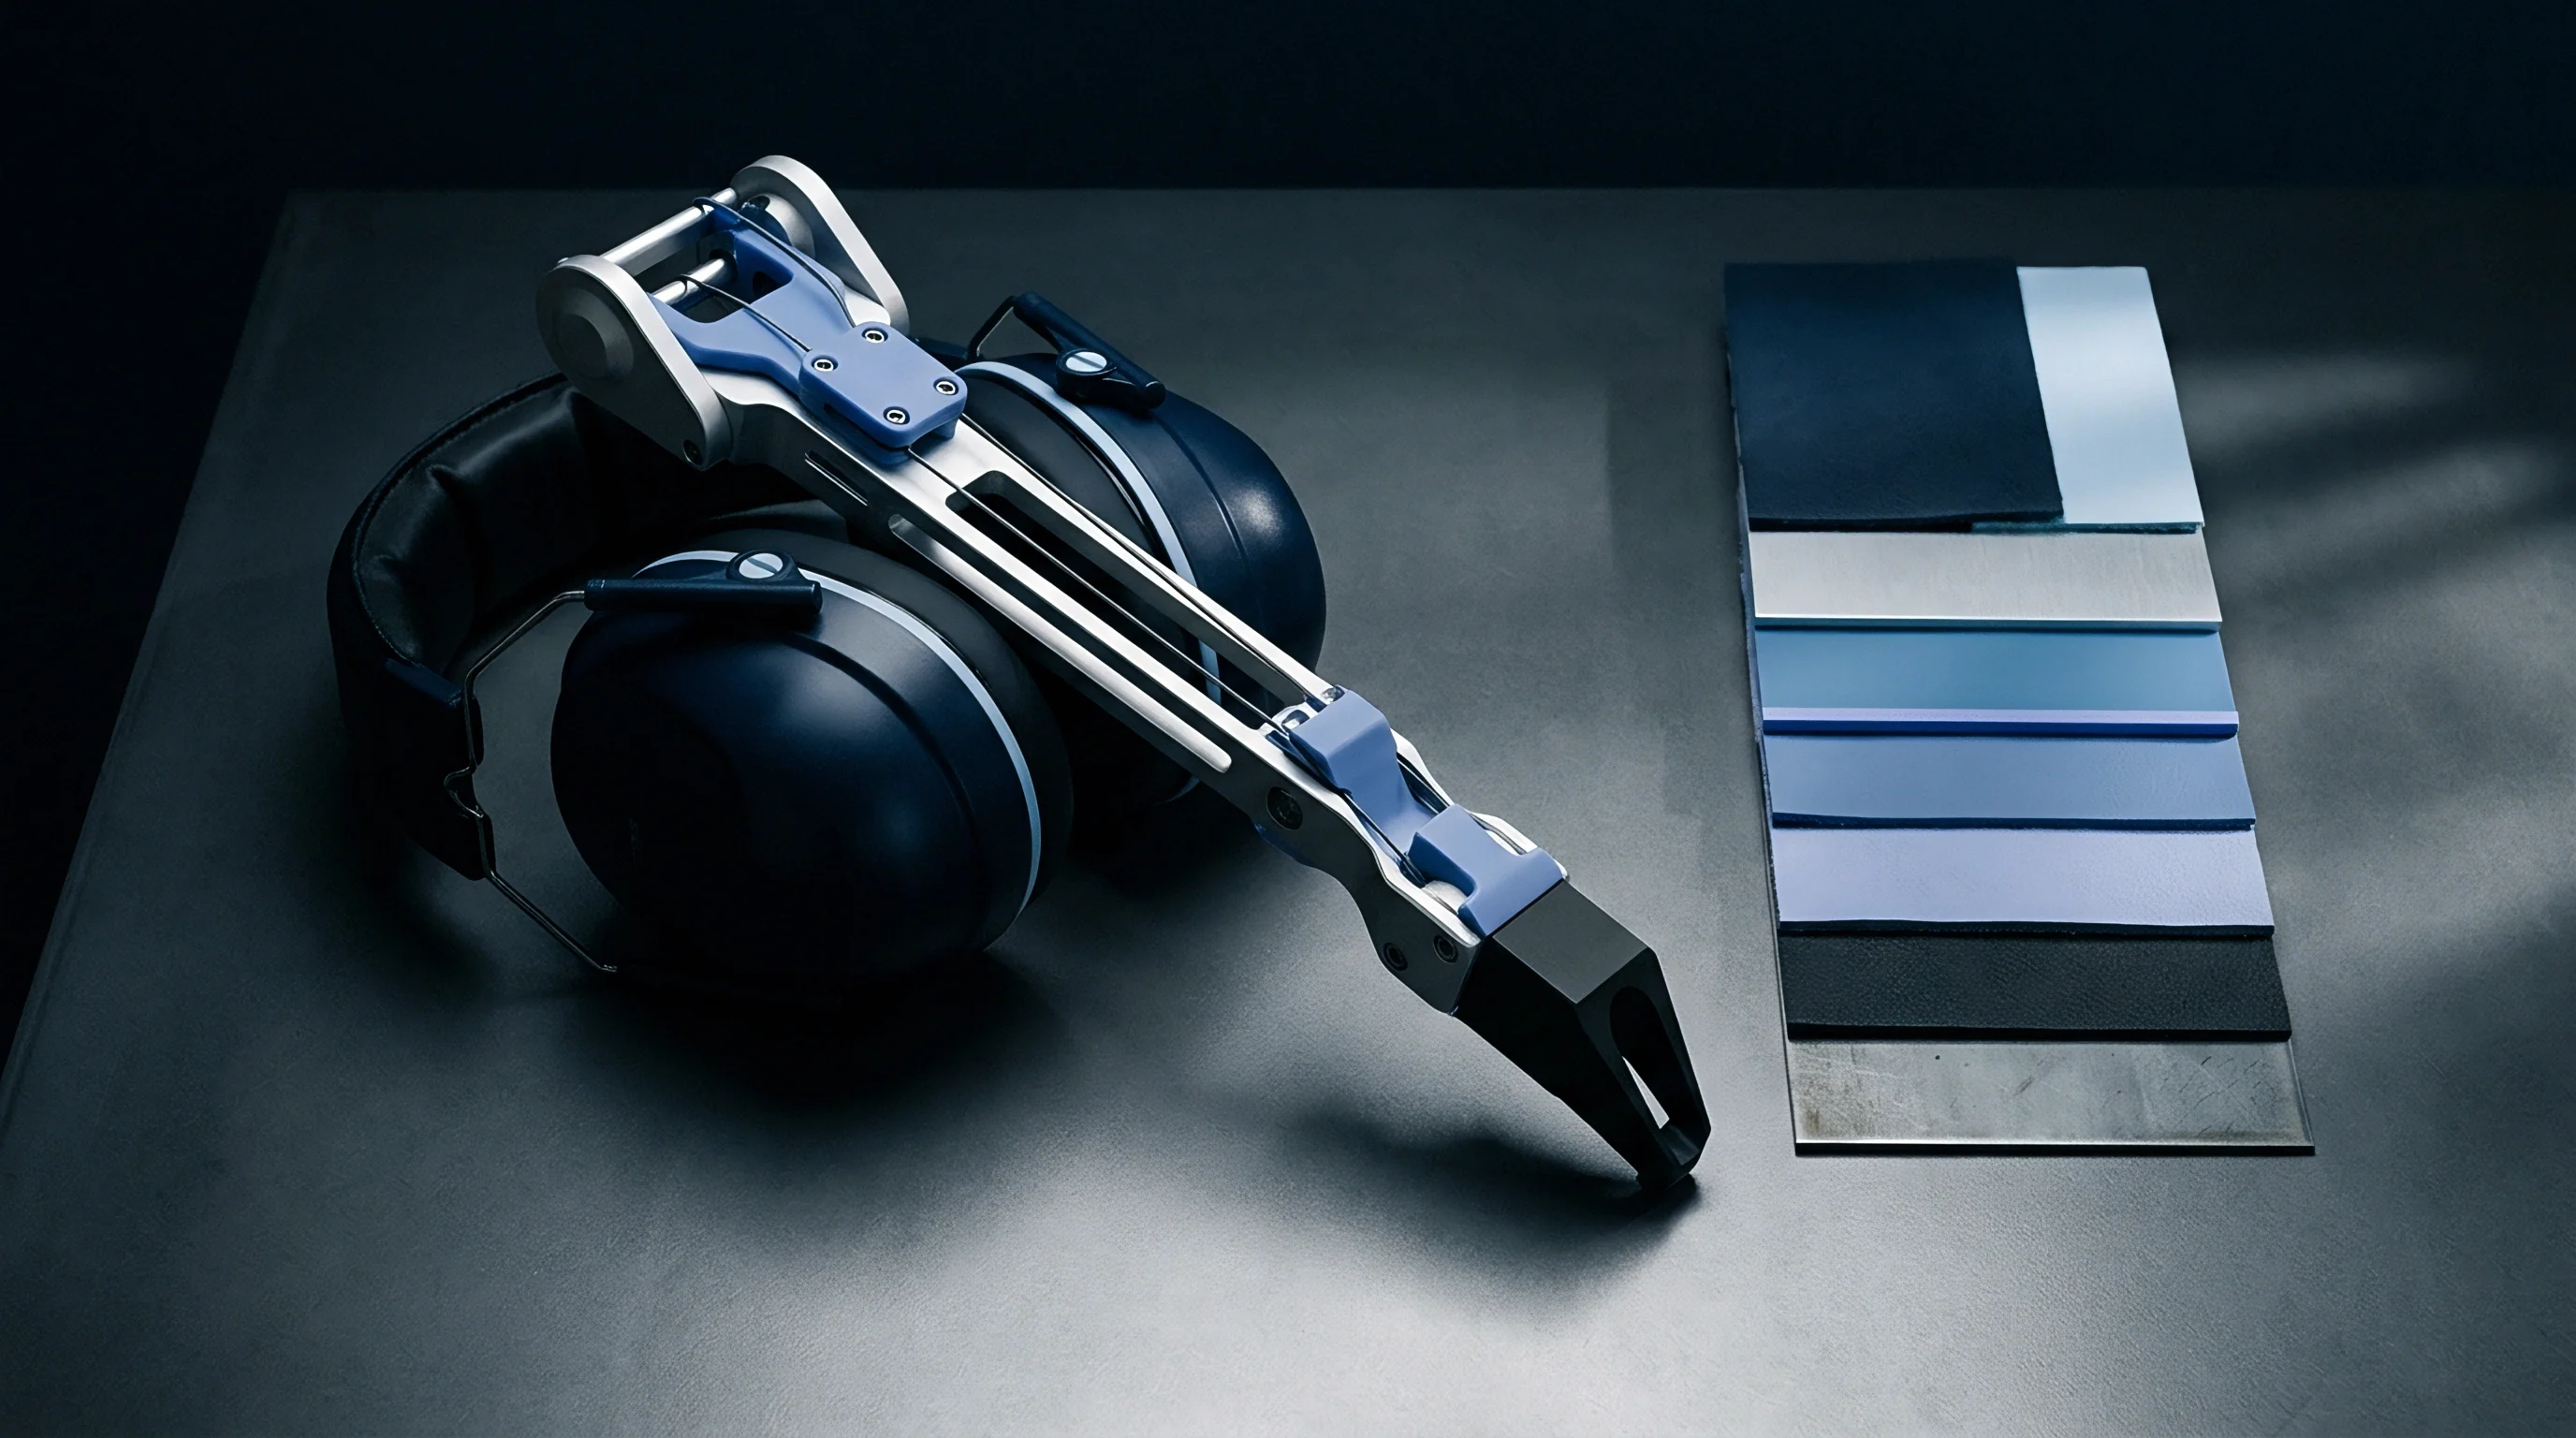
Ejection forces from pins, stripper plates, or hydraulic lifters can distort warm plastic parts as the mold opens. Stripping friction depends on true contact area between the cooling polymer skin and metal core walls, coupled with the normal force from plastic shrinking onto core features. Polished cores drawn parallel to ejector travel let part walls slide with minimal drag.
Coarser textures create micro-undercuts that interlock with shrinking walls, multiplying the force needed to push the part free.
Draft angles on vertical walls determine how fast contact breaks on initial movement. A 0.5-degree draft offers very little lateral clearance. Paired with a coarse VDI 30 finish, that 0.5 degrees forces metal peaks to scrape along the plastic wall for several millimeters of ejector travel.
Shaved material collects at part edges, leaving scuffs, stress whitening, and tapered wall sections. Adding 1.5 to 2.0 degrees of draft per 0.025 millimeters of texture depth allows tool asperities to clear the plastic immediately as ejection starts.
High ejection resistance makes pins punch into soft walls, causing localized thinning and dishing. Parts demolded above their heat deflection temperature lack structural stiffness, leaving them susceptible to permanent deformation under pin loads. Pin push-through happens when local shear under the pin face bypasses the skin’s yield strength; thin outer walls buckle when overall release force exceeds the column strength of the part profile.
The total force needed to strip a box enclosure off a textured core block follows basic friction mechanics ~ a sum of adhesive sliding and mechanical interlocking from steel asperities. Ejection force climbs non-linearly as tool temperature goes up, draft decreases, or surface roughness (Ra and Rz) increases. During T1 trials, operators trying to eliminate sink marks often raise hold pressure or extend cycle time, packing plastic tighter into core textures and causing severe ejection drag.
Ejection drag distorts sample validation by imposing permanent bending moments on flat features. A CMM scan on a T1 sample might show 0.35 millimeters of bowing across a 150-millimeter span, which quality techs usually blame on uneven cooling lines. Diagnostic push-out tests often tell a different story: mechanical drag during stripping bends warm walls over core corners, locking in flexural strain as the part cools on the bench.
Avoiding structural damage during ejection requires control over surface preparation and mechanical setup. Following a standard validation sequence keeps toolmakers from modifying steel prematurely.
- Tool Surface Inspection ~ Log baseline steel roughness (Ra, Rz) and draft angles across core and cavity surfaces with a contact profilometer before setting the tool in the press.
- Thermal Stabilization ~ Stabilize core and cavity temperatures with multi-zone controllers, checking thermal equilibrium with a calibrated infrared camera.
- Scientific Process Establishment ~ Run a viscosity study, fill-only shots, and gate seal test to establish cavity pressure without over-packing core details.
- Ejection Load Telemetry ~ Track hydraulic ejector pressure or load cell signals during demolding to spot high-drag areas before parts deform.
- Part Distortion Scanning ~ Scan sample parts within fifteen minutes of ejection using a non-contact optical scanner, comparing full-field warpage maps to as-built tool measurements.
Surface finish directly governs the force required to pull crystalline and amorphous resins off steel cores. Table 1 lists ejection forces measured across common engineering resins, showing how release forces surge when draft drops and surface roughness increases.
| Polymer Grade | Tool Finish Grade | Roughness Ra (µm) | Draft Angle (deg) | Peak Ejection Force (N) | Measured Part Wall Shear (µm) |
|---|---|---|---|---|---|
| ABS (Medium Impact) | SPI A-2 (Diamond) | 0.05 | 0.5 | 420 | 2 |
| ABS (Medium Impact) | VDI 18 (EDM) | 0.80 | 0.5 | 1150 | 14 |
| ABS (Medium Impact) | VDI 27 (EDM) | 2.24 | 0.5 | 2850 | 45 |
| PC (Unfilled) | SPI A-2 (Diamond) | 0.05 | 1.0 | 680 | 4 |
| PC (Unfilled) | VDI 24 (EDM) | 1.60 | 1.0 | 2100 | 28 |
| PBT (30% Glass Filled) | SPI B-2 (Paper) | 0.16 | 1.0 | 950 | 8 |
| PBT (30% Glass Filled) | VDI 30 (EDM) | 3.15 | 1.0 | 3400 | 62 |
Deep ribs and enclosed bosses lock up from vacuum suction during ejection if core surfaces lack venting or textured relief. As a core pulls out of a deep blind pocket, the expanding space behind the plastic wall creates a vacuum. Atmospheric pressure pushes the outer wall inward, distorting mating features.
Vapor-honing or bead-blasting the core tip prevents this suction by creating micro-channels that vent air during initial displacement.
Engineers need to separate thermal shrinkage clamping from mechanical drag caused by tool texture. Polish marks perpendicular to draw act as miniature latches, quadrupling release resistance compared to draw-aligned polishing. Drawing abrasive paper parallel to ejector stroke aligns micro-grooves with part movement, cutting peak ejection force immediately without altering core dimensions.
Pairing proper draft design with draw-aligned polishing removes mechanical ejection drag as a source of part distortion.


Cooling

Interfacial Thermal Resistance and Skin Formation Kinetics
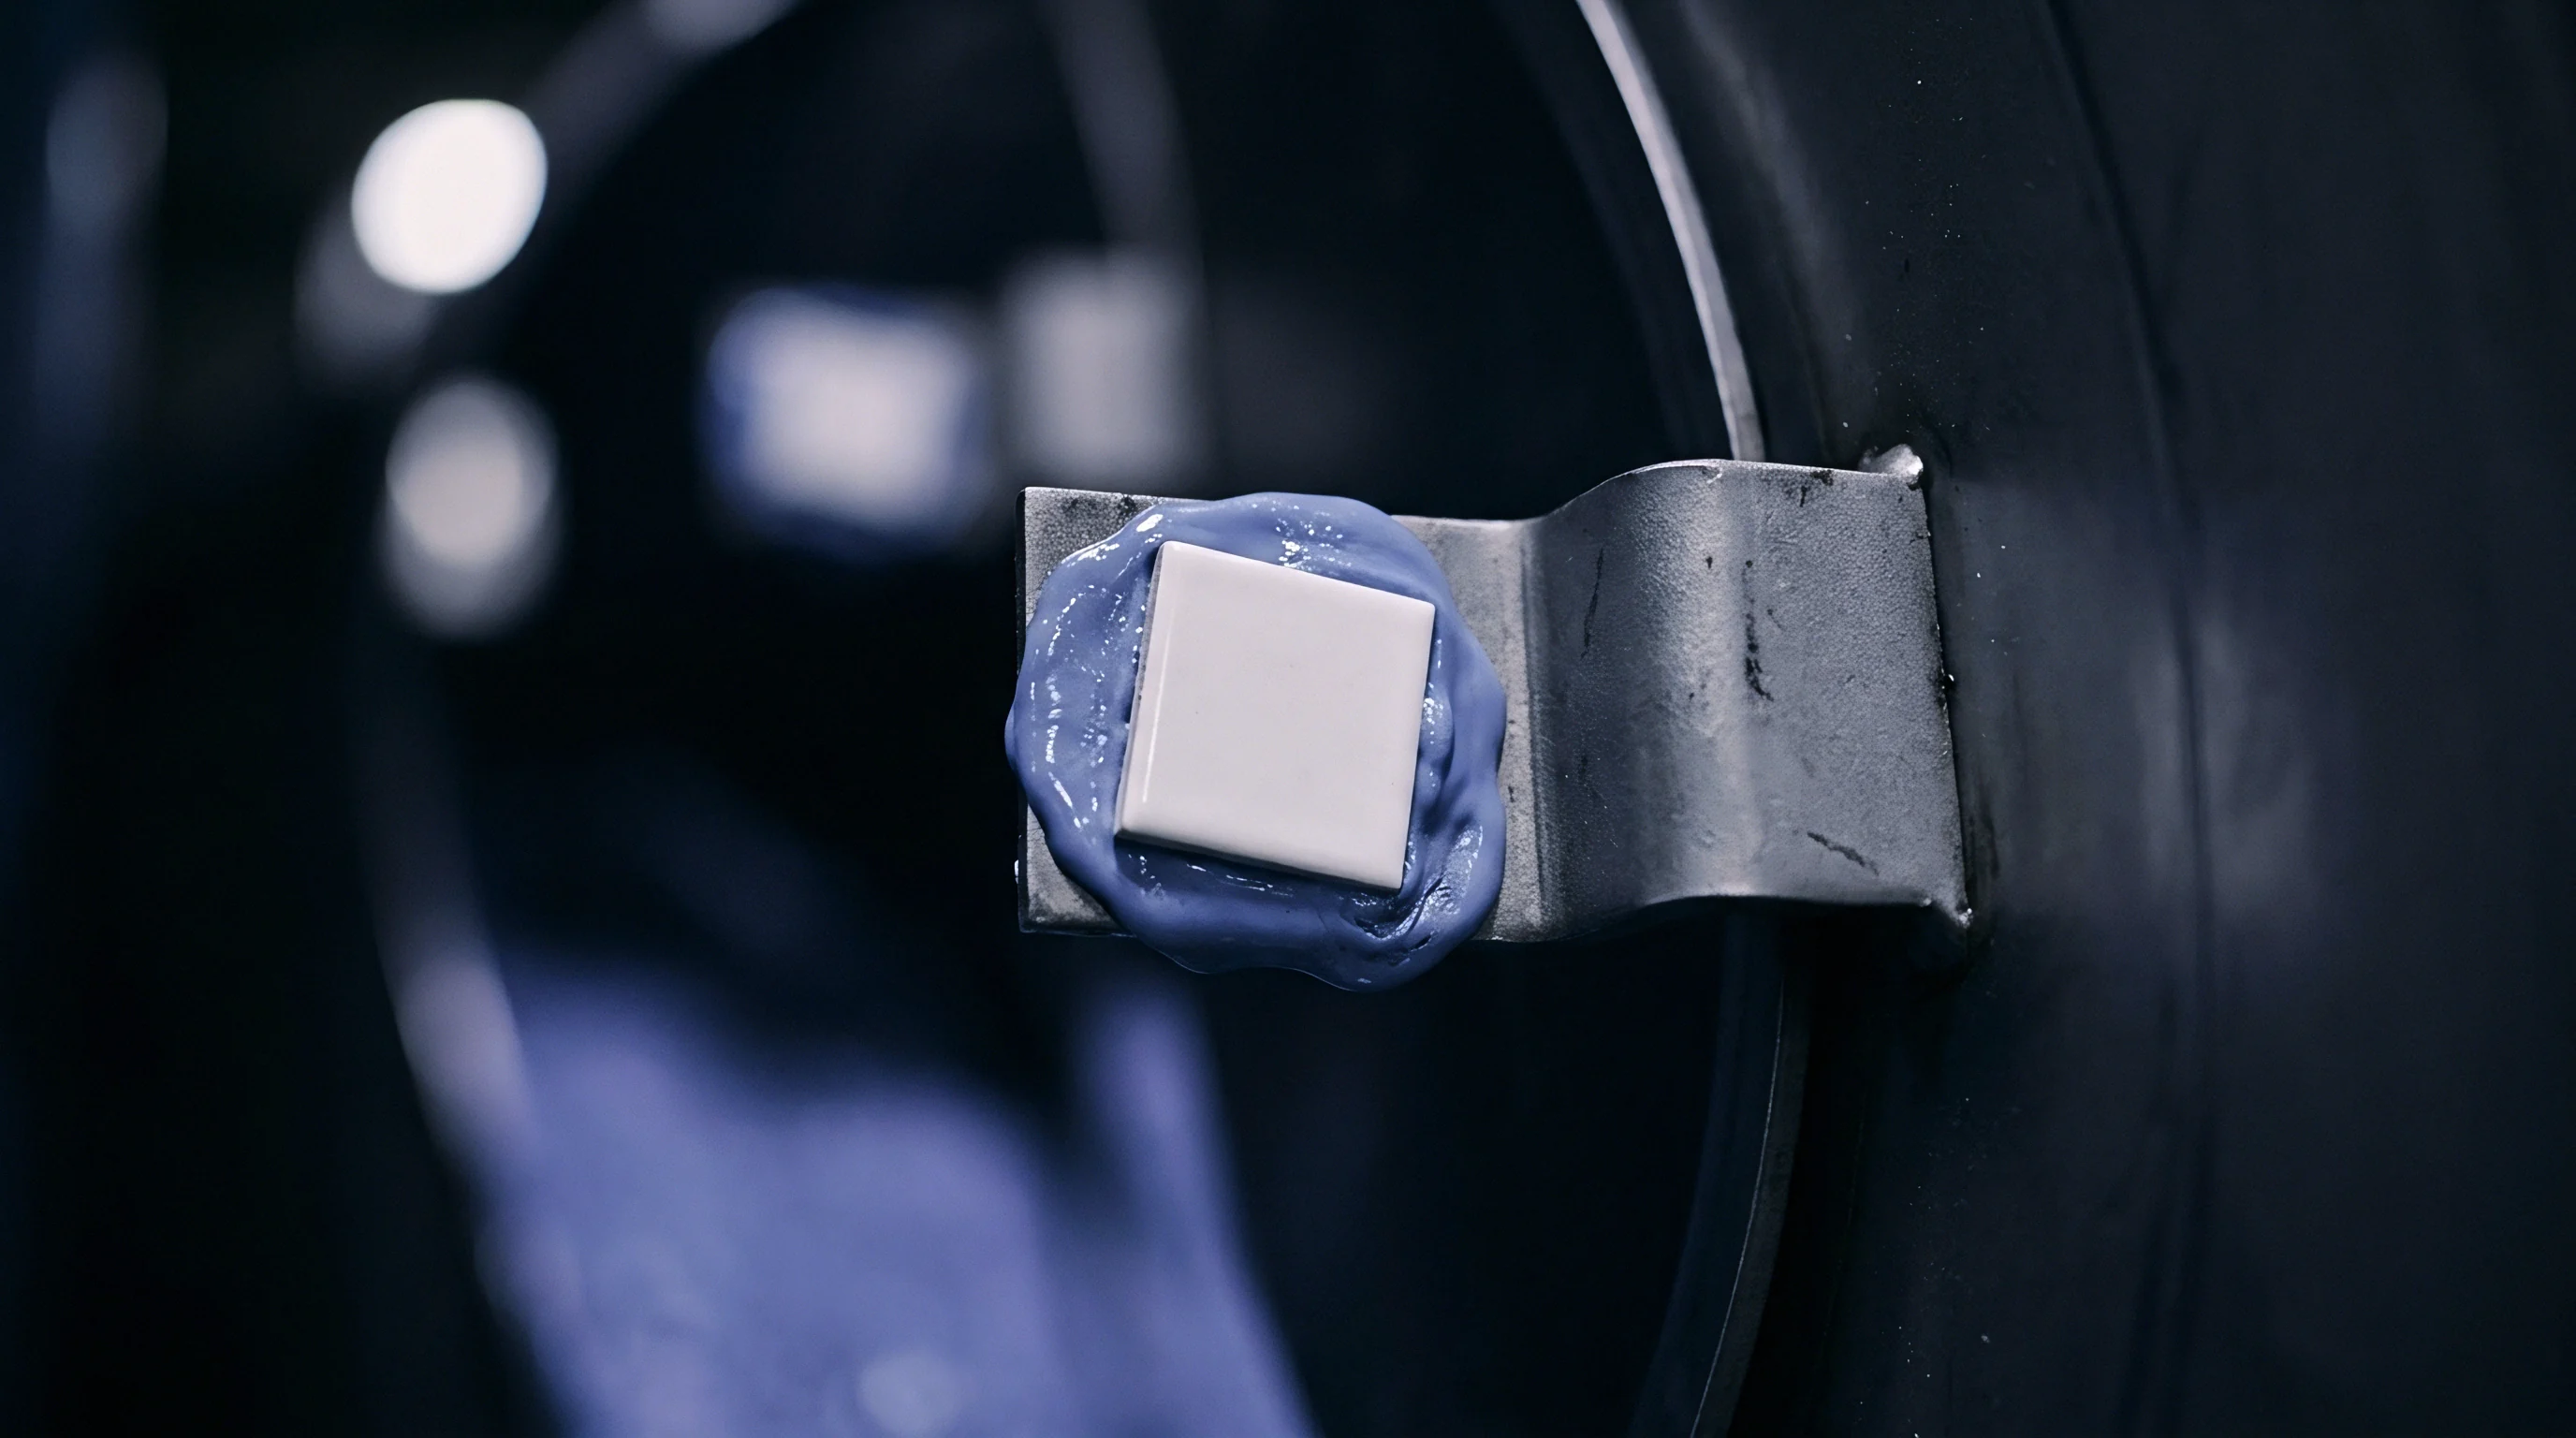
Heat transfer across the polymer-steel interface controls skin formation, cooling rates, and local volumetric shrink. Solidifying melt dumps heat into the mold steel through conduction, a process governed by interfacial thermal contact resistance. Highly polished surfaces maximize true contact area, dropping thermal resistance and freezing the skin quickly.
Micro-textured cavity surfaces trap pockets of air beneath the melt front, building an insulating barrier that slows heat transfer.
Thermal contact resistance shifts continuously throughout the molding cycle. Under high packing pressure, molten plastic is forced into micro-topography peaks, bringing thermal contact resistance to its lowest point. But as the plastic cools and shrinks, the skin pulls back from steel asperities, forming air gaps.
Trapped air has a conductivity of roughly 0.026 W/m K, compared to 25 to 45 W/m K for tool steel. Once packing pressure drops and air gaps open, heat flux across a textured cavity drops sharply.
Air trapped in micro-textures delays skin freeze-off, giving the molten core more time to pull material away from the outer boundaries and increasing total section shrinkage. Polished cavity walls chill outer skins quickly, establishing a rigid shell that holds shape against core contraction. As a result, parts molded in polished cavities often measure slightly larger on outer dimensions than identical parts from grit-blasted or rough EDM cavities run at the same packing pressure.
How fast the skin freezes shapes the stress profile through the part thickness. Fast cooling against polished steel creates high compressive stress in the outer layer balanced by core tension. Slower cooling over textured surfaces lowers skin compressive stress, allowing more uniform core contraction at the cost of higher total shrink.
When core and cavity finishes don’t match, cooling becomes lopsided, creating thermal bending moments that warp the part upon ejection.
In-mold heat flux sensors show an SPI A-1 polished cavity reaching an interfacial heat transfer coefficient above 1800 W/m² K at peak packing. Under identical resin and cooling conditions, an unpolished VDI 33 EDM surface stays below 1100 W/m² K. That 38 percent drop in thermal contact efficiency delays gate seal times, alters core crystallization in semi-crystalline resins, and shifts final part dimensions by tens of micrometers.
Interfacial thermal contact coefficients drop by over thirty percent when switching cavity steel from polished diamond finishes to coarse spark-eroded textures under identical packing pressures.
Crystallization in semi-crystalline resins ~ like polypropylene, polyamide, and polyoxymethylene ~ depends directly on local cooling rates. Rapid quenching against cold polished steel limits polymer chain mobility, yielding smaller spherulites and lower crystallinity near the surface. Slower heat dissipation against textured steel gives chains time to form dense crystalline lamellae, increasing local density and linear shrinkage.
Parts molded in textured cavities routinely shrink more than supplier datasheets predict, because ASTM test plaques are molded in polished cavities.
A dimensional discrepancy on an unfilled polyoxymethylene gear housing showed a textured cavity insert producing pitch diameters 0.12 millimeters smaller than baseline shrink calculations predicted. Thermal modeling confirmed that micro-air gaps in the VDI 27 textured core slowed cooling, raising crystalline content from 48 percent to 56 percent and driving an extra 0.6 percent volumetric shrink across the core hub.
Temperature differentials between core and cavity amplify finish-induced imbalances. Molders often run cavity steel colder than core steel to cut cycle time or ensure parts stick to the core side during opening. Pairing cold polished cavity steel with a hot textured core sets up an extreme thermal imbalance across the wall.
The skin on the polished side freezes instantly, while the skin against the textured core stays warm and elastic, pulling the part toward the warm core as it shrinks.
Engineers troubleshooting thermal warpage should evaluate surface finish alongside water line placement and flow rates. Polishing a slow-cooling core area to match cavity roughness often balances heat transfer without the expense of re-drilling cooling channels.
Unbalanced thermal contact resistance across opposing mold faces creates permanent warpage that press adjustments alone cannot fix, requiring tool modifications to equalize surface finishes.
Distortion

Localized Shrinkage Variances and Geometry Deviations
Volumetric shrinkage in molded plastics is rarely uniform across complex shapes. Local wall thickness, gate distance, molecular alignment, and cooling rates all drive uneven contraction. Tool surface finish acts as another variable, altering shrink by changing shear heating during fill and heat transfer during cooling.
When steel finish varies across a cavity, localized dimensional shifts complicate T1 sample evaluation.
Wall thickness transitions are sensitive to finish changes. Rib intersections, boss bases, and thick gussets retain heat and freeze later than adjacent thin walls. Putting a decorative matte texture on thin nominal walls while leaving thick rib bases smooth creates a sharp thermal mismatch.
Micro-textures slow cooling on the thin walls even further, while polished steel pulls heat fast from the thick bases. Shrinkage shifts toward the slow-cooling textured areas, bowing flat panels inward and creating unexpected sink marks.
Glass-filled semi-crystalline resins shrink anisotropically based on fiber alignment. Fast melt flowing over smooth polished steel aligns fibers parallel to flow, yielding low longitudinal shrink (0.2 to 0.4 percent) and higher transverse shrink (0.8 to 1.2 percent). Micro-textured surfaces disrupt boundary flow, creating shear turbulence that randomizes fiber orientation in outer skins.
That shift changes directional shrink ratios, twisting flat rectangular plates into non-planar shapes.
On a 30 percent glass-filled PBT connector housing, changing cavity finish from an SPI B-3 paper polish to a VDI 30 texture increased end-to-end twist from 0.08 millimeters to 0.42 millimeters. Fiber orientation analysis showed that micro-asperities on the VDI 30 steel disrupted surface fiber alignment, generating transverse shrink forces that pulled mating pins out of true position.
Could Microscopic Tool Finish Alter Part Shrinkage Rates?
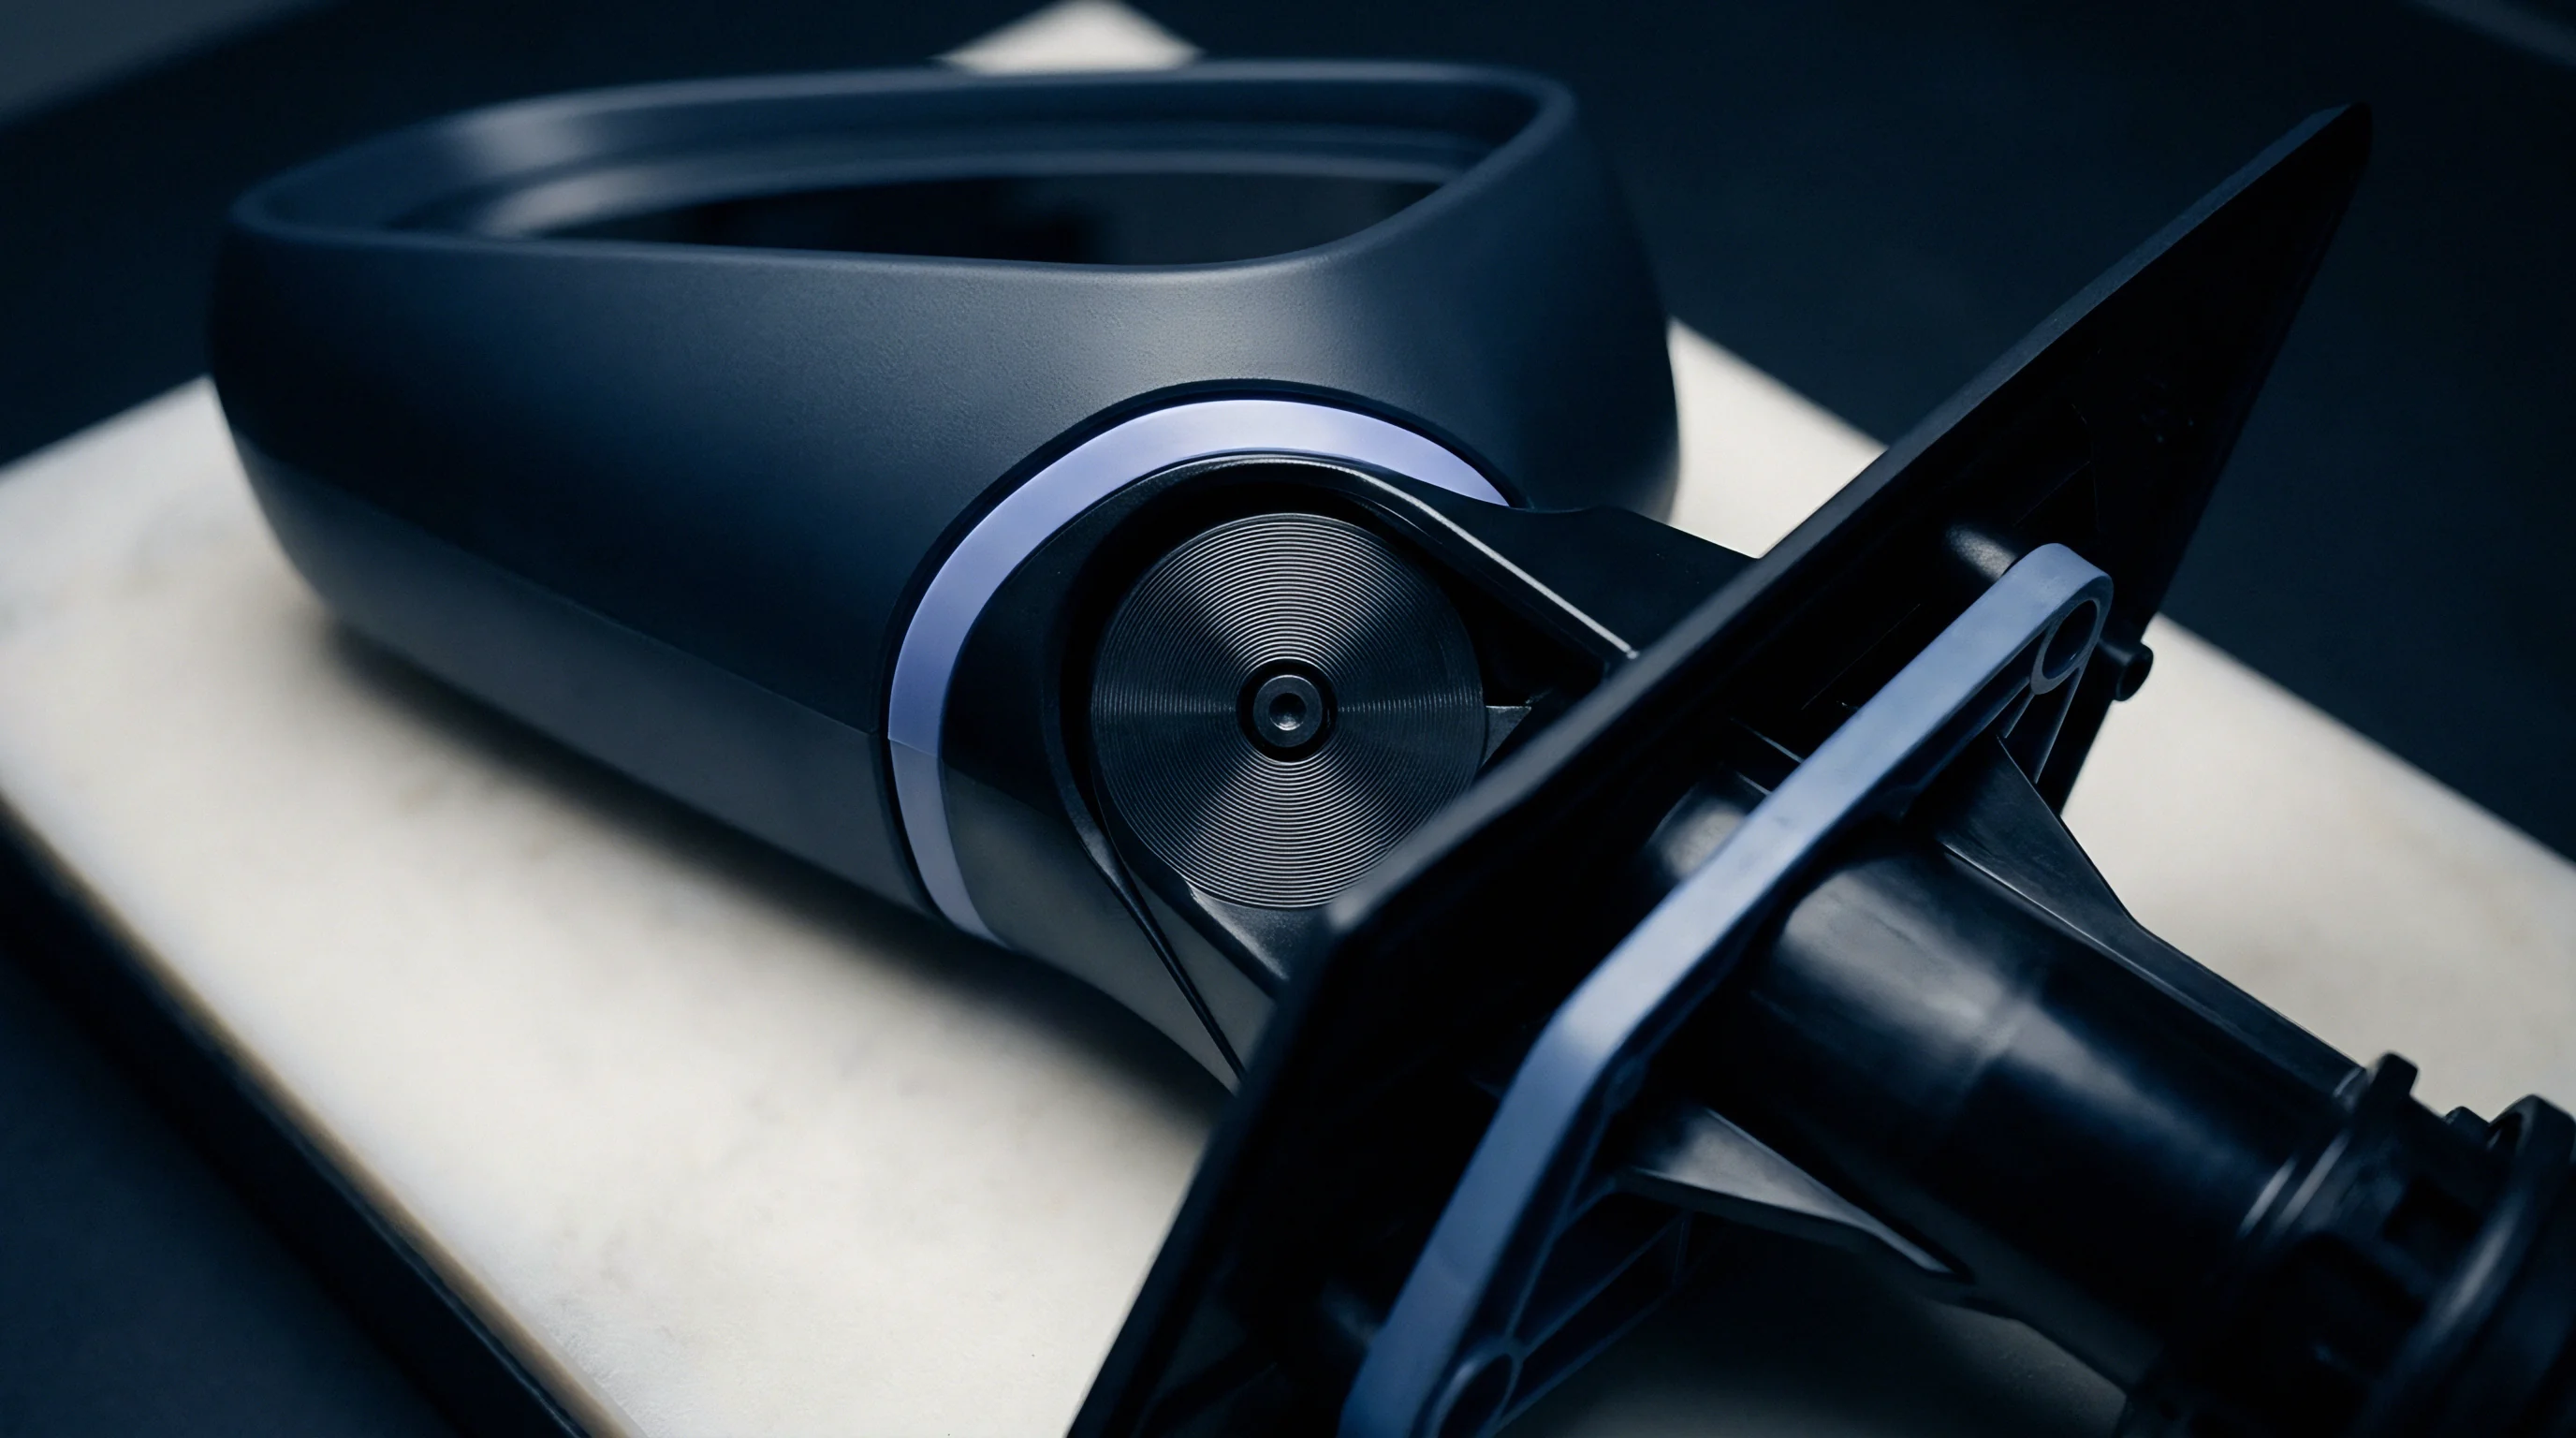
Surface micro-topography influences local shrinkage by altering friction and heat flow at the mold interface. Steel asperities restrict initial lateral contraction of the freezing skin until the plastic drops below its glass transition or heat deflection temperature. Polymer skins pinned against rough steel develop localized tensile strain during early cooling; once the mold opens and mechanical restraint drops, stored stress relaxes, driving secondary shrinkage and dimensional drift over the first twenty-four hours.
Mismatching finishes across core and cavity halves introduces geometric failure modes that distort first-article inspection reports. Recognizing these mechanisms helps pinpoint surface-driven root causes during tool bring-up.
- Differential Skin Shrinkage ~ Unequal cooling between polished cavity steel and textured core steel creates thickness-direction thermal strain, bowing flat panels.
- Anisotropic Fiber Disruption ~ Rough textures randomize surface glass fiber alignment, altering directional shrink ratios and causing out-of-plane twist.
- Boundary Shear Hesitation Marks ~ Wall friction on coarse VDI finishes causes micro-stagnation at the melt front, creating density variations and visible surface steps.
- Ejection Scuff Distortion ~ High demolding friction on low-draft textured walls causes ejector pins to bow thin structural ribs during mold opening.
- Specular Metrology Offset ~ Non-contact laser scans on high-gloss SPI A-1 parts produce optical noise spikes, reading as false out-of-tolerance surface profile errors.
Evaluating finish-induced shrink variations requires benchmark data across resin families. Table 2 compiles dimensional deviation data for amorphous and semi-crystalline polymers, comparing final shrink and planar warpage between mirror-polished and coarse textured cavities under controlled process conditions.
| Resin Type | Fill Material | Tool Surface Finish | Nominal Shrinkage (%) | Effective Shrinkage (%) | Planar Warpage (mm) |
|---|---|---|---|---|---|
| Polycarbonate (PC) | Unfilled | SPI A-1 (Mirror) | 0.60 | 0.58 | 0.06 |
| Polycarbonate (PC) | Unfilled | VDI 27 (Textured) | 0.60 | 0.64 | 0.14 |
| PC/ABS Alloy | Unfilled | SPI B-2 (Paper) | 0.50 | 0.49 | 0.08 |
| PC/ABS Alloy | Unfilled | VDI 30 (Textured) | 0.50 | 0.55 | 0.22 |
| PA66 (Nylon 66) | 30% Glass Fiber | SPI A-2 (Diamond) | 0.35 (Flow) | 0.32 (Flow) | 0.12 |
| PA66 (Nylon 66) | 30% Glass Fiber | VDI 27 (Textured) | 0.35 (Flow) | 0.48 (Flow) | 0.46 |
| PBT Polyester | 30% Glass Fiber | SPI B-3 (Paper) | 0.40 (Flow) | 0.38 (Flow) | 0.10 |
| PBT Polyester | 30% Glass Fiber | VDI 33 (Textured) | 0.40 (Flow) | 0.56 (Flow) | 0.58 |
DIN 16742 establishes tolerance groups based on material shrink stability and mold precision. Polished cavities achieve tight tolerance bands (Group 110 or 120) because thermal transfer and demolding behavior remain consistent. Coarse VDI textures widen variability, dropping parts into broader tolerance groups (Group 140 or 150) due to fluctuating skin friction and local cooling differences across production runs.
DIN 16742 tolerance classifications degrade by up to two tolerance groups when part geometries transition from smooth polished tool steel to heavy spark-eroded textures without adjusting draft angles.
Irregular shrink over textured surfaces degrades hole concentricity, pin alignment, and press-fit features. Bores molded over textured core pins contract unevenly around the diameter, springing into an oval cross-section after ejection. Bearing seats and O-ring grooves need SPI B-1 or smoother finishes on core inserts to hold roundness within 0.025 millimeters.
Before cutting metal to fix out-of-spec T1 dimensions, engineers need to confirm whether errors come from steel size or finish-driven shrink anomalies. Cutting steel to correct a dimension on an un-grained T1 part usually backfires once final texturing increases local shrink, forcing the shop to weld and re-machine.
Will sub-micron changes in tool steel polishing paths ever be predictable enough to eliminate early physical T1 sample tooling iterations entirely?

Inspection
Metrology Artefacts and Measurement Errors on Sample Parts
Validating T1 sample dimensions relies on tactile CMMs, blue-light structured scanners, micro-CT systems, and laser profilometers. Each system interacts differently with part surface finish. Optical scanners hit severe signal noise on high-gloss SPI A-1 surfaces due to specular reflection.
Tactile CMM probes face physical measurement errors on coarse VDI 33 textures, as stylus tips drop into crater valleys or slide down angled facets.
Scanning high-gloss, transparent, or black polished parts optically requires a temporary developer spray ~ like titanium dioxide or sublimating cyclododecane ~ to scatter reflection. But spraying introduces an uncalibrated coating layer. Hand-applied sprays run anywhere from 5 to 25 micrometers thick over complex features.
Checking a tight +/- 0.05 millimeter surface profile on a sprayed part risks rejecting good tool steel simply because spray accumulated in internal corners.
Tactile CMM checks on textured surfaces depend heavily on probe tip radius. A 2.0-millimeter ruby stylus cannot reach the bottom of VDI 30 micro-craters, measuring an effective surface near crater peaks. A 0.5-millimeter stylus drops deeper, reporting a mean surface location several micrometers lower.
Standardizing stylus tip sizes across inspection protocols prevents false dimensional discrepancies between toolmaker and customer labs.
Laser triangulation sensors encounter glare and secondary reflections on polished curved walls. Direct reflections saturate CCD detectors, generating point-cloud spikes that show up as false surface bumps or edge flash. Textured surfaces scatter light evenly, yielding clean alignment data but adding spatial noise that can mask true form errors.
Point-cloud software needs properly sized Gaussian spatial filters to smooth surface noise without rounding off sharp rib geometry.
Selecting metrology equipment for T1 validation depends on part gloss, material opacity, and feature tolerances. Quality teams should apply clear decision rules when setting up inspection workflows.
- Tactile CMM Probing ~ Primary choice for tight hole patterns, bearing seats, and critical features on SPI A-2 through B-2 finishes, using stylus radii matched to drawing fillet specifications.
- Sublimating Spray Optical Scanning ~ Recommended for full-field profile inspection on high-gloss SPI A-1 parts, provided spray thickness calibration blocks are scanned alongside the part.
- Uncoated Structured Light Scanning ~ Best for VDI 18 through VDI 36 textures, capturing rapid point clouds without developer spray artifacts.
- Micro-CT Tomographic Inspection ~ Necessary for internal wall thickness checks and void analysis on complex assemblies where optical line-of-sight is blocked.
ISO 21920 standards outline methods for separating micro-roughness from macro-geometric form errors during analysis. Evaluating GD&T profile tolerances requires setting spatial cutoff filters (lambda-c) to remove surface roughness from the dataset. An improper cutoff filter allows surface texture noise to corrupt flatness and position calculations, leading quality teams to mistake surface finish for steel machining errors.
ISO 1101 profile tolerance evaluation mandates setting spatial cutoff filters above peak micro-roughness wavelengths to prevent tool surface finish noise from inflating measured form errors.
Laser line probes scanning textured draft walls at oblique angles suffer optical displacement errors. Light diffusion shifts the calculated center of reflection, introducing offsets up to 0.018 millimeters on 5-degree draft walls with VDI 27 finishes. Orienting the laser sensor perpendicular to the draft face removes these optical offsets during inspection.
Inspectors checking T1 samples must record surface prep, sensor equipment model, stylus configuration, and software filter settings. Discrepancies between toolmaker reports and customer incoming inspection usually stem from measurement setup differences rather than tool steel dimensions.
Standard tooling contracts often specify that T1 dimensional signoff relies on tactile CMM measurements taken on un-textured reference pads machined directly into cavity steel for quality auditing.

Signoff

Tooling Acceptance Contracts and Refinishing Steel Allowances
Commissioning injection mold tooling requires clear contractual terms for T1 sample signoff, surface finishing milestones, and steel alteration allowances. A common trap is auditing T1 samples directly against final production prints before cavity surfaces are finished. Toolmakers routinely leave 0.010 to 0.035 millimeters of safe steel on core and cavity blocks during initial machining, reserving material for hand polishing or acid etching.
Polishing steel from a raw milled state (1.2 micrometers Ra) to an SPI A-2 diamond finish (0.05 micrometers Ra) removes roughly 0.005 to 0.012 millimeters of stock. Diamond benching also rounds sharp corners, opens shallow rib slots, and expands cavity volume. Requesting steel changes based on T1 dimensions from unpolished tools means subsequent polishing will remove even more metal, risking out-of-spec conditions.
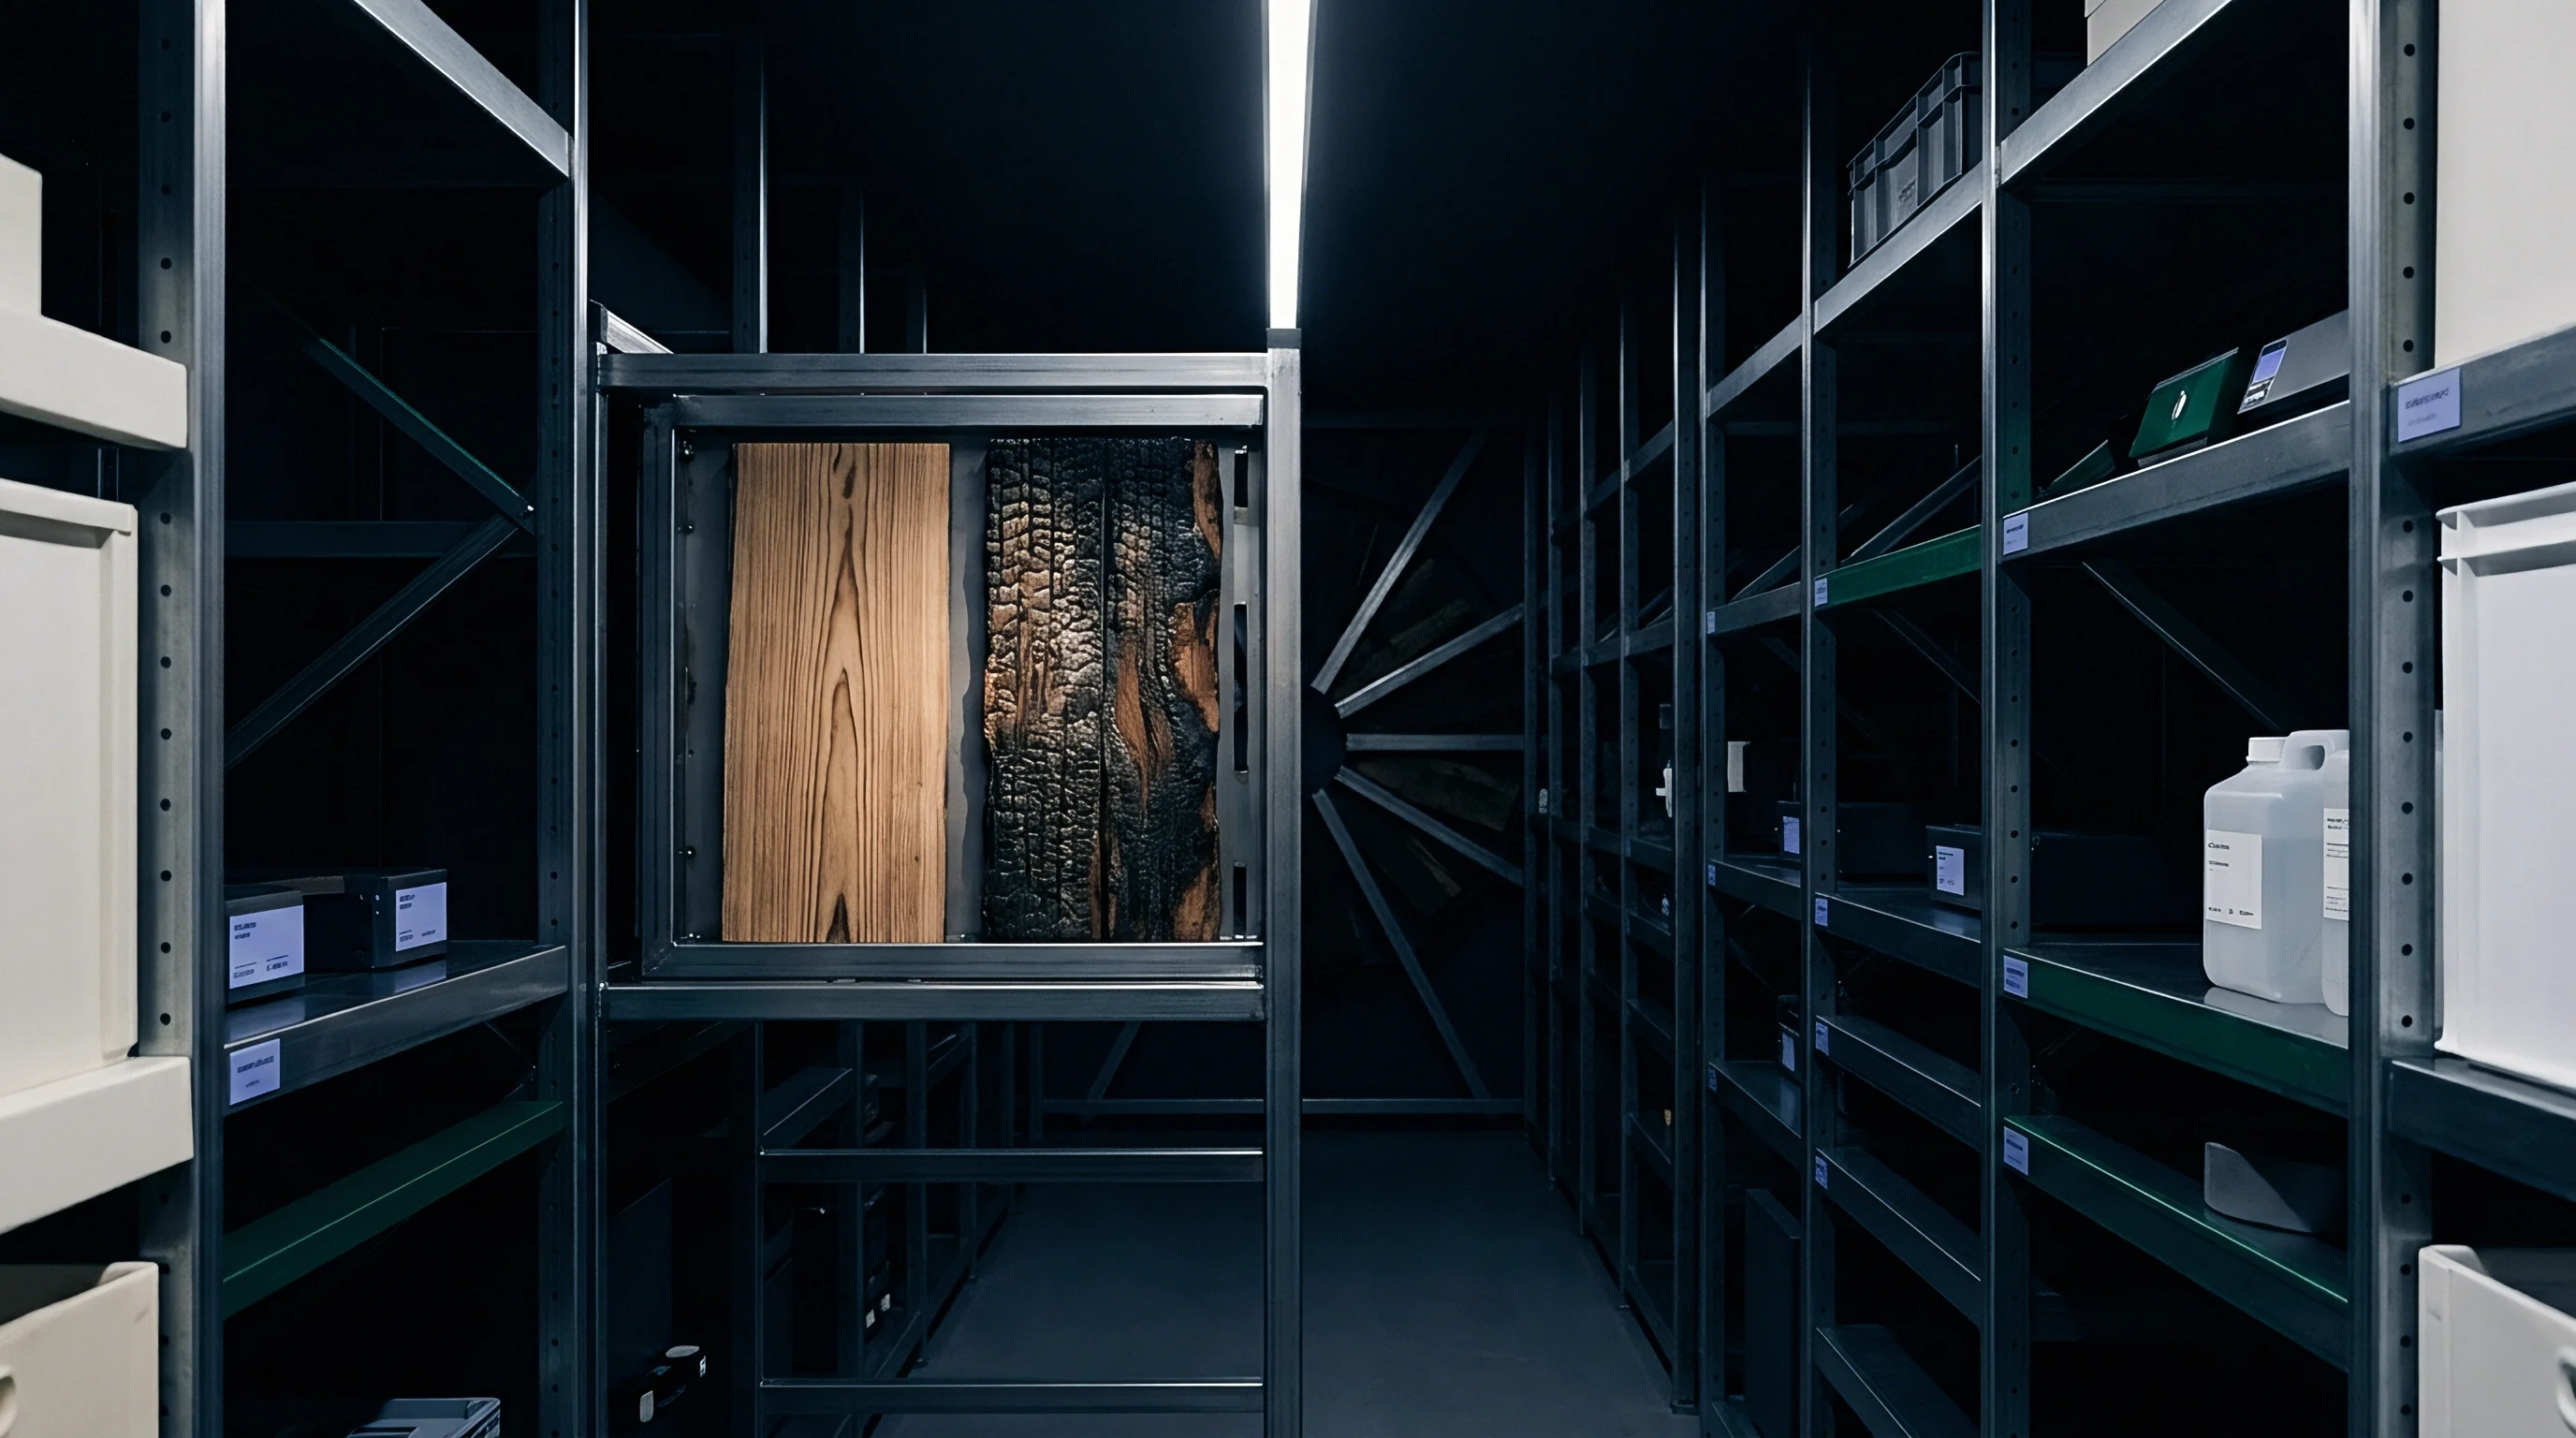
Chemical photo-etching for decorative leather or matte textures eats away steel while forming micro-undercuts. Etching a medium texture like VDI 30 (around 32 micrometers deep) requires an acid bath that expands outer cavity walls while reducing core pin diameters. Toolmakers compensate during initial machining by leaving cavity steel small and core steel large.
Evaluating un-grained T1 parts requires applying geometric offset corrections to account for this future metal removal.
Tooling qualification protocols structure validation into distinct phases. Table 3 illustrates a multi-stage tooling release matrix, defining surface finish milestones, inspection scope, and steel alteration authority across build phases.
| Tool Build Stage | Steel Surface Condition | Dimensional Validation Scope | Steel Modification Authority | Financial Release (% Tool Cost) |
|---|---|---|---|---|
| T0 (First Dry Run) | Raw CNC / EDM (Unpolished) | Action check, mechanical clearance | Toolmaker internal tuning | 50% (Deposit + Steel Arrival) |
| T1 (Initial Samples) | Pre-Finish (Safe Steel +0.02mm) | Critical GD&T, overall shrink trend | Controlled engineering change order | 30% (T1 Sample Delivery) |
| T2 (Refined Samples) | Polished (SPI B-2 / A-3) | Full CMM FAIR (100% Dimensions) | Buyer quality signoff required | 10% (Dimensional Signoff) |
| T3 (Texture Release) | Final Etched / SPI A-1 Polish | Fit, form, function, visual finish | Final production lock-out | 10% (Final Tool Acceptance) |
Managing financial risk requires tying tooling progress payments to physical signoff gates. Buyers who release final funds upon T1 sample delivery surrender leverage if post-grain texturing introduces ejection drag or warpage. Withholding the final 10 to 20 percent until parts from fully textured steel pass complete First Article Inspection Report checks protects against unbudgeted rework.
Tooling contracts should explicitly assign maintenance and re-polishing responsibilities over the production lifecycle. Resins with 50 percent glass fiber erode cavity surfaces, wearing an SPI A-2 polish down to a matte finish within fifty thousand shots. That surface erosion alters heat transfer and increases ejection drag, driving dimensional drift over time.
Contracts need to establish who pays for re-polishing and re-graining to preserve part dimensions over high-volume runs.
Tooling procurement agreements must retain final capital release until parts produced from fully textured steel clear complete First Article Inspection Report checks.
Modifying hardened steel after final texturing is costly. Correcting a sink mark or dimensional defect on an etched cavity wall means benching or laser-welding off the texture, re-machining, re-polishing, and spot-etching the repair zone. Spot-etched repairs rarely blend perfectly, leaving visible gloss seams and minor dimensional steps.
Tooling buyers should require un-textured T1 samples along with steel verification dossiers that include white-light profilometer scans of cavity surfaces. Comparing initial steel topography to final textured scans clarifies whether dimensional shifts stem from shrink physics, ejection mechanics, or unbudgeted metal removal during polishing.
A toolmaker accepting a purchase order that ties final tooling payment to T1 dimensional approval on raw steel accepts the commercial risk of re-machining cavities once post-grain polishing alters part geometry.