Process Window Optimization and Viscosity Control in Scientific Molding
Scientific molding decouples fill, pack, and hold phases to stabilize viscosity windows, cutting cycle times and securing repeatable part tolerances.

Shear
During high-velocity injection, thermoplastic polymers demonstrate non-Newtonian flow through the machine barrel and runner network. Driven forward by hydraulic or electric servo systems, the polymer chains align along the velocity gradient, lowering internal friction and dropping flow resistance as speed rises. Standard resin datasheets report melt flow rate tested under static capillary conditions under ISO 1133 or ASTM D1238, but these static numbers fail to describe how the polymer behaves inside an active mold cavity.
In production, wall shear rates inside runners and gates routinely reach 10,000 to 100,000 reciprocal seconds.
Melt viscosity drops rapidly under high shear conditions.

Rheological Behavior across Variable Velocity Windows
At higher fill rates, polymer melts deform and flow more easily through thin mold channels. Establishing a repeatable injection process requires mapping this non-Newtonian response on the exact press assigned to the production tool. The technician runs a series of air shots or filled parts across a controlled velocity ladder while keeping melt temperature and back pressure constant.
Recording peak hydraulic injection pressure and actual fill time at each velocity step provides the dataset needed to plot rheological performance.
At low injection speeds, polymer viscosity stays high and reacts sharply to small changes in velocity, so minor process fluctuations produce wide swings in part mass and cavity filling. Faster injection pushes the curve onto a non-Newtonian plateau where incremental speed increases barely affect melt viscosity. Setting the first-stage injection speed within this stable plateau isolates the process from raw material lot-to-lot viscosity shifts and barrel temperature drift across shifts.
| Injection Velocity (mm/s) | Fill Time (s) | Peak Injection Pressure (bar) | Apparent Shear Rate (1/s) | Apparent Viscosity (Pa·s) |
|---|---|---|---|---|
| 10 | 2.45 | 42 | 1,250 | 336.0 |
| 25 | 0.98 | 68 | 3,125 | 217.6 |
| 50 | 0.49 | 91 | 6,250 | 145.6 |
| 75 | 0.33 | 104 | 9,375 | 110.9 |
| 100 | 0.25 | 112 | 12,500 | 89.6 |
| 125 | 0.20 | 118 | 15,625 | 75.5 |
| 150 | 0.17 | 122 | 18,750 | 65.1 |

Calculated In-Mould Apparent Viscosity Determination
Press-side testing relies on measuring stroke time and peak hydraulic pressure across incremental injection speeds. The mathematical calculation converts hydraulic pressure and volumetric flow rate into apparent stress and shear strain values using geometric cavity parameters. Gate dimensions establish the apparent shear rate equation, while total pressure drop across the runner system defines apparent shear stress.
Plotting apparent viscosity against shear rate identifies where viscosity stabilization occurs.
Operating just beyond the knee of the rheological curve prevents cosmetic defects like jetting or sink marks without introducing excess flash. Processing at extreme velocities generates localized shear heating that degrades molecular weight, causing structural embrittlement in semi-crystalline resins. Identifying the upper and lower boundaries of the shear rate plateau sets the foundation for first-stage velocity selection.
Viscosity values drop by over sixty percent when shear rates increase from one thousand to ten thousand reciprocal seconds during first-stage fill.
Melt temperature management directly limits polymer thermal decay.
- Shear Rate Plateau Limit defines the minimum injection speed where viscosity variation stays below five percent across batch shifts.
- Melt Degradation Velocity marks the upper flow rate boundary where viscous heating breaks polymer backbone chains.
- Hydraulic Pressure Cap establishes the upper machine force limit required to maintain linear screw velocity without pressure response limiting.
- Apparent Viscosity Stability measures the consistency of melt resistance across raw resin lot variation.
- Volumetric Velocity Output matches the machine displacement rate to gate wall shear thresholds.
Whether localized shear heating at gate restrictions creates thermal degradation that escapes standard barrel temperature sensors remains a point of debate on the shop floor.


Cushion
Separating volumetric cavity fill from hold pressure helps protect part dimensions against material lot variations. Traditional single-stage molding relies on machine pressure caps to pack the cavity during the primary stroke. Scientific molding uses a multi-stage process where stage-one velocity fills ninety-five to ninety-eight percent of the cavity volume before transitioning instantly to stage-two pressure control.
Transfer to holding pressure occurs at a precise screw position.

Decoupled Moulding Architecture and Transfer Mechanics
In multi-stage processing, stage-one fill drives the screw forward rapidly until roughly ninety-five percent of part volume is filled. Transfer from velocity control to pressure control occurs strictly based on screw position rather than hydraulic pressure or elapsed time. Position-based transfer isolates volumetric filling from shifts in melt viscosity, preventing cavity over-packing or flash when resin flowability shifts mid-run.
The transition point must leave a precise volume of molten material in front of the screw tip to act as a hydraulic transfer buffer. This remaining material forms the screw cushion. A stable cushion transfers packing pressure continuously into the cavity through the gate seal phase.
If the cushion depletes to zero before hold time completes, pressure transfer breaks down, resulting in sink marks, short shots, and uncontrolled dimensional shrinkage.
- Establish Unpacked Part Weight by filling the mold cavity to ninety-five percent of total volume using stage-one velocity control only without applying hold pressure.
- Set Position Transfer Point at the exact stroke location where the short shot exhibits uniform flow front advancement without flash.
- Apply Low Packing Pressure to stage-two controls to fill the remaining five percent of cavity volume without introducing high internal stress.
- Optimize Cushion Size by adjusting the total shot size until a remnant buffer of three to six millimeters remains at screw bottom-out.
- Verify Cushion Repeatability across fifty consecutive press cycles to confirm variance stays within plus or minus 0.5 millimeters.
Check Valve Performance and Shot Volume Stability
Non-return ring assemblies experience brief mechanical slip during the initial transition to forward pressure. When the screw accelerates forward, melt pressure behind the non-return valve pushes the valve ring backward against the thrust seat to seal the barrel. Any delay or inconsistency in valve seating allows molten material to flow backward into the screw flights, reducing the effective stroke volume delivered to the cavity.
Gradual mechanical wear causes non-return check valves to leak and fail.
Monitoring cushion stability provides direct insight into check valve integrity. Dynamic cushion variation exceeding one millimeter across a standard shift indicates non-return valve leakage, barrel tip wear, or unstable back pressure during screw recovery. Processing engineers track the final cushion position on every cycle using machine transducer outputs to verify process repeatability before authorizing part release.
A remnant screw cushion between three and six millimeters prevents mechanical bottom-out while ensuring pressure transfer through gate freeze.
Excessive hold pressure applied to an unstable cushion distorts critical wall dimensions.


Freeze
Liquid polymer within the gate channel solidifies under sustained packing pressure to seal the mold cavity volume completely. Hold pressure forces additional melt into the cavity to offset volumetric shrinkage as the polymer cools from processing temperature to a solid state. Once the gate solidifies, applying further holding pressure provides no dimensional benefit and only adds residual stress or increases cycle time.

Which Pressure Variables Determine Actual Volumetric Shrinkage?
Holding force packs additional melt into the cooling cavity to offset density increases during phase change. Semi-crystalline resins such as polypropylene and polyamide experience volumetric shrinkage between one and two point five percent during crystallization. Amorphous polymers like polycarbonate exhibit lower shrinkage, typically between zero point four and zero point eight percent.
Packing pressure magnitude directly dictates final part density and outer dimensions.
Cut steel cavity dimensions determine the absolute physical limits of the part.
Applying insufficient pack pressure results in internal voids, surface sink marks, and undersized part dimensions. Over-packing forces excess material into the gate area, creating localized stress concentrations, gate blush, and post-ejection warpage. The process window for packing pressure requires balancing dimensional target nominals against tool deflection limits and ejection force thresholds.
Gate Seal Study Mechanics and Weight Progression
Measuring part mass across incremental holding time intervals reveals the precise transition point to complete solidification. The technician conducts a gate seal study by increasing second-stage hold time in one-second increments while keeping injection speed, pack pressure, and mold temperature fixed. Weighing parts from each time step on a precision laboratory scale yields a curve where part mass increases linearly until the gate solidifies.
| Hold Time (s) | Mean Part Mass (g) | Mass Deviation (g) | Peak Cavity Pressure (bar) | Gate Seal State |
|---|---|---|---|---|
| 1.0 | 44.12 | 0.18 | 180 | Open |
| 2.0 | 44.85 | 0.12 | 310 | Open |
| 3.0 | 45.41 | 0.08 | 420 | Open |
| 4.0 | 45.82 | 0.04 | 450 | Open |
| 5.0 | 46.05 | 0.02 | 460 | Sealed |
| 6.0 | 46.06 | 0.02 | 460 | Sealed |
| 7.0 | 46.04 | 0.03 | 458 | Sealed |
Part mass levels off once the gate seals.
Once the gate seals, part mass reaches a constant value. Adding further holding time extends overall cycle time without changing part weight or geometry. The optimal process hold time setpoint equals the gate freeze time plus one second to establish a safety margin against environmental cooling variations.
ISO 294-1 outlines standard conditioning requirements for test specimens produced under controlled gate seal timing.
ISO 294-1 specifies test specimen molding conditions where hold time must exceed gate freeze time to prevent internal density gradients.
Operating below true gate freeze time yields erratic part weights, severe sink marks, and dimensional variance that breaches engineering drawing tolerances.

Circuit
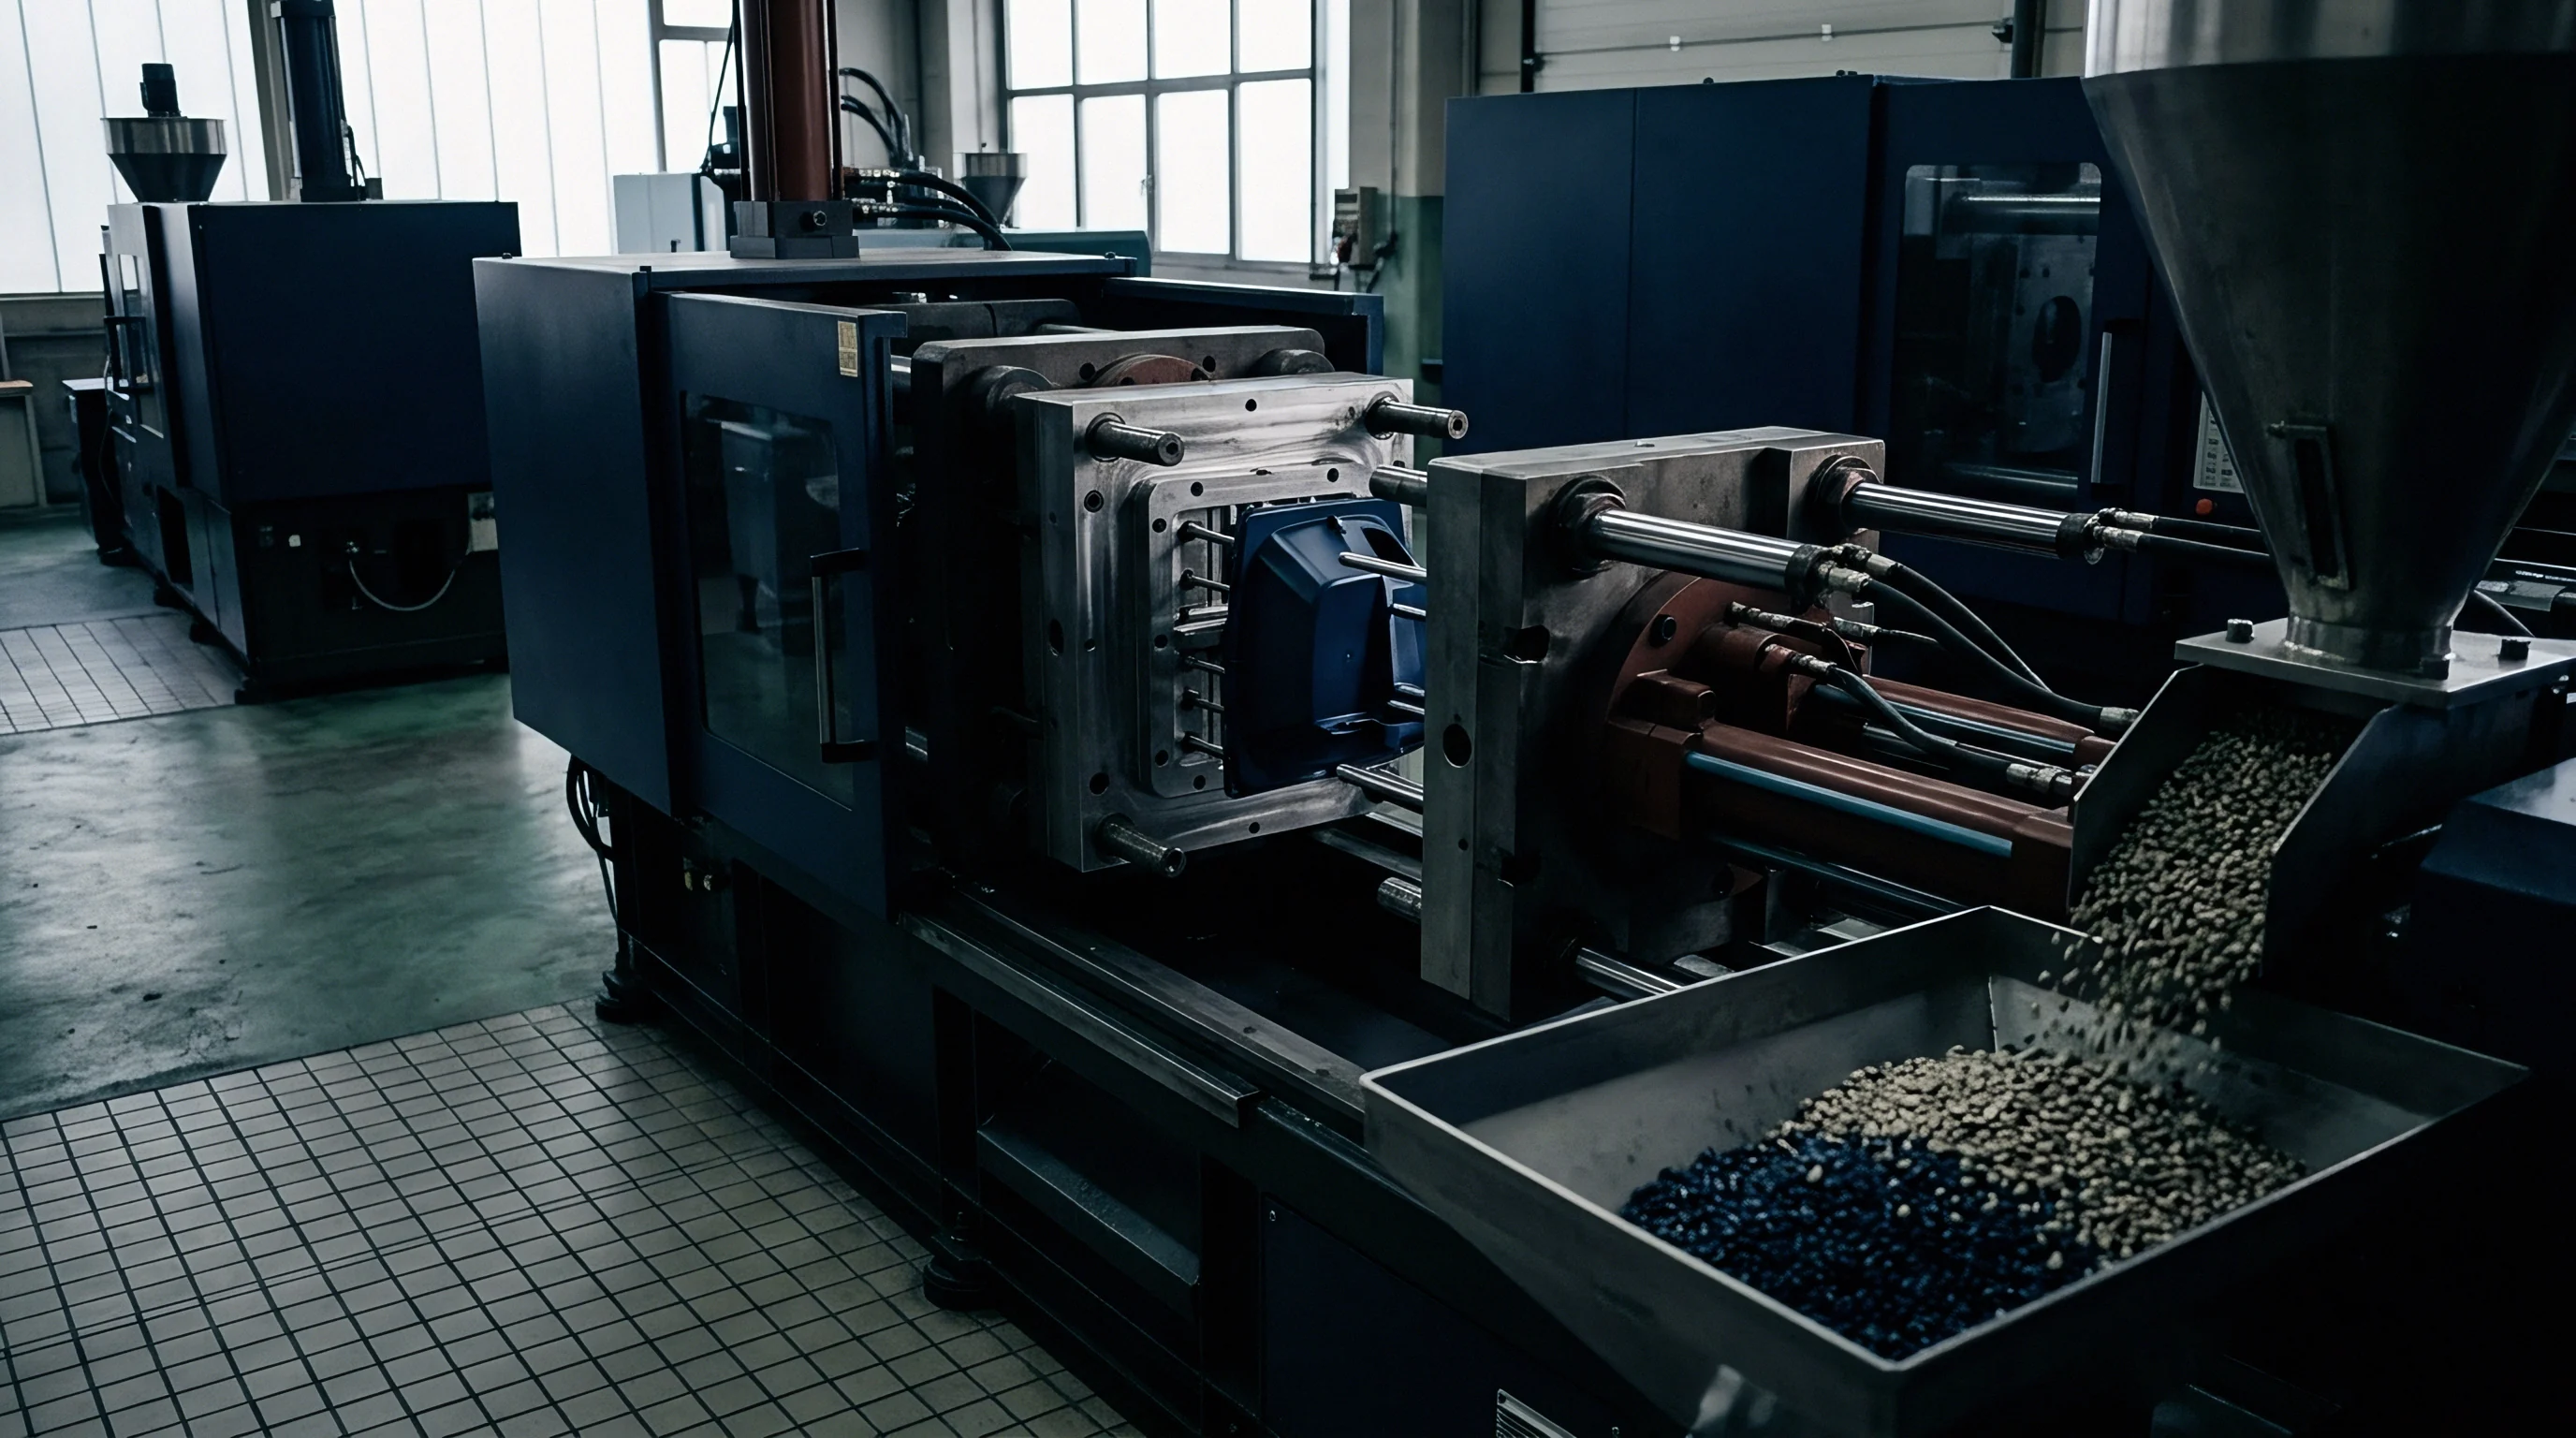
Mold cooling systems extract thermal energy continuously to solidify molten resin before mold opening and part ejection. Cooling accounts for up to seventy percent of total molding cycle time. Optimizing heat transfer efficiency requires precise management of coolant flow rate, fluid turbulence, and circuit geometry inside the tool steel.
Coolant flow rates directly govern overall mold cycle time.

Thermal Extraction Mechanics and Coolant Dynamics
Fluid flow through internal tool passages must remain turbulent to maintain uniform heat transfer across cavity faces. Laminar flow creates a boundary layer of warm fluid along channel walls, insulating the bulk coolant and severely reducing heat removal rates. Achieving turbulent flow requires reaching a Reynolds number greater than 4,000 within every cooling loop.
Calculating Reynolds number involves fluid velocity, channel hydraulic diameter, and kinematic viscosity at operating temperature. Water flowing at low temperatures exhibits higher viscosity, demanding higher pumping pressure to achieve turbulence. Adding glycol to water coolant increases fluid viscosity, requiring higher flow rates to maintain turbulent conditions than pure water systems.
Defect Modes Driven by Cavity Temperature Gradients
Non-uniform wall surface cooling induces differential shrinkage vectors across opposite faces of a molded part. Temperature variations across core and cavity steel cause uneven cooling rates, leading to post-molding thermal warpage and dimensional distortion. Keeping the temperature differential below 2°C between coolant inlet and outlet lines ensures uniform heat extraction across the tool steel surface.
- Coolant Flow Rate Verification confirms each individual tool circuit receives sufficient volumetric flow to exceed the turbulent threshold.
- Delta T Measurement tracks fluid temperature rise from supply manifold to return collector to prevent thermal gradients across cavity faces.
- Pressure Drop Monitoring identifies internal channel restriction, scale buildup, or kinked supply lines before cooling efficiency drops.
- Mold Surface Mapping utilizes infrared thermography to detect localized thermal hot spots near thick part geometry.
Audit steps for verifying viscosity control on production floor follow strict sequence:
- Measure supply manifold coolant pressure and temperature to verify utility delivery baseline.
- Check flow meter readings on each individual return line to confirm Reynolds numbers exceed 4,000.
- Record core and cavity steel temperatures using a calibrated contact probe across six surface locations per cavity.
- Verify total temperature drop across return manifolds remains under the maximum 2°C engineering limit.
Maintaining turbulent coolant flow with Reynolds numbers above four thousand minimizes mold surface thermal gradients and cuts overall cycle time.
Cavity-to-cavity dimensional variation is often blamed on raw material instability when restricted cooling circuits are the true root cause.

Ledger
Commercial viability relies on maintaining process capability indexes above standard threshold values throughout multi-shift production runs. A wide process window accommodates raw resin lot variations, ambient shop-floor temperature shifts, and minor machine hydraulic fluctuations without producing non-conforming parts. Defining process window limits relies on statistical analysis of critical dimensional features mapped against process variable bounds.

Process Capability Mapping against Dimensional Tolerances
Statistical process control measures part variance under normal production drift using ISO 22514 calculations. Process capability index Cpk measures how close a process operates to its specification limits relative to natural process variability. A process holding a Cpk greater than 1.33 produces fewer than 64 non-conforming parts per million, establishing standard commercial acceptance.
Narrow processing windows significantly increase long-term scrap costs.
Process window centering identifies the intersection where key variables such as melt temperature, injection speed, and pack pressure yield maximum Cpk values. Operating near the edge of a process window increases scrap rates during shift changes or raw material lot transitions. Broadening the process window requires modifying tool steel dimensions, enlarging gates, or improving thermal management circuit design.
Worked Landed Cost Analysis for Shift Drift
Operational arithmetic balances tooling investment against cycle time reductions and scrap elimination over full production volumes. Consider a multi-cavity automotive electrical connector tool operating on a 100,000-unit production run. An unoptimized standard injection molding process operates with a 22-second cycle time and experiences a 4.5 percent scrap rate due to dimensional drift and visual sink marks.
The machine hour rate for the 150-tonne press equals 45.00 USD per hour, and raw resin cost equals 3.80 USD per kilogram at a part mass of 35 grams.
Excess scrap rapidly erodes the return on tooling investment.
Applying scientific molding methodology centers the process window, reducing cycle time to 18.5 seconds through optimized gate seal and cooling performance while lowering the scrap rate to 0.8 percent. The cycle time reduction of 3.5 seconds saves 97.2 machine hours across the production run, reducing press machine cost by 4,374.00 USD. Scrap reduction saves 3,700 non-conforming parts, recovering 129.5 kilograms of raw resin valued at 492.10 USD and saving an additional 22.6 machine hours valued at 1,017.00 USD.
Net direct savings from process centering total 5,883.10 USD per 100,000 units produced.
| Process Metric | Standard Uncentered Setup | Centered Scientific Window | Variance Unit Delta |
|---|---|---|---|
| Cycle Time (s) | 22.0 | 18.5 | -3.5 s |
| Scrap Rate (%) | 4.5% | 0.8% | -3.7% |
| Total Machine Hours (per 100k) | 611.1 | 514.1 | -97.0 hrs |
| Scrap Cost Loss (USD) | 2,110.50 | 375.20 | -1,735.30 USD |
| Total Production Cost (USD) | 40,800.00 | 34,916.90 | -5,883.10 USD |
| Net Landed Unit Cost (USD/part) | 0.408 | 0.349 | -0.059 USD |
Trimming seconds from cycle times directly governs press operating margins.
Maintaining high process capability requires strict thermal management across circuits.
Standard purchase contract terms under DIN 16742 Grade TG4 mandate process qualification documentation demonstrating Cpk values above 1.33 prior to tool signoff and serial production authorization.