Determining Optimal Injection Molding Cavitation Counts and Processing Parameters
Optimal cavitation balances machine hourly rates, clamp tonnage, and shot capacity against thermal cooling limits and cross-cavity dimensional distribution.

Volume
Tooling commitments fix production economics before the press ever cycles a charge of resin. Arriving at the target cavitation count means balancing capital allocation against machine-hour rates, part surface area, and barrel shot capacity. A buyer planning annual deliveries weighs amortisation schedules directly against press availability.
Clamping tonnage demands scale with projected area, and whenever clamp force cannot resist peak cavity pressure, parting line flash triggers unplanned downtime and rapid tool wear.
Cavitation layout starts with clamp tonnage. Total projected area covers both the part impressions and the runner system feeding them. That area, multiplied by the cavity pressure required to pack the chosen resin grade, defines the minimum press rating.
A polycarbonate housing calling for 60 MPa in-cavity pressure across an individual surface of 45 square centimeters demands 27 metric tons of clamp force per impression. With a cold runner adding roughly fifteen percent to that footprint, a four-cavity tool requires 124 metric tons. Stepping up to eight cavities pushes the threshold past 248 metric tons, bumping the job out of mid-sized hydraulic presses onto costlier large-platen machines.
Clamping force calculations that omit the projected runner network underestimate required press tonnage by twelve to eighteen percent under cold runner configurations.
Injection barrel sizing sets the other firm boundary on cavitation. Running below twenty percent of barrel capacity risks thermal degradation from melt sitting too long at temperature. Running above eighty percent leaves too little screw recovery time for uniform plasticizing, producing un-melted pellets and shot-to-shot weight swings.
The target window places total shot weight between thirty-five and sixty-five percent of barrel capacity.
- Target Annual Throughput establishes the baseline production hours required across the machine life cycle.
- Machine Hour Rates dictate whether higher cavitation on a large press yields lower landed costs than lower cavitation on a nimble press.
- Barrel Volumetric Swept Range restricts mold cavitation by maintaining screw recovery strokes within two to four screw diameters.
- Maximum Platen Tie Bar Clearance governs physical mold base dimensions and slide action strokes.
Take a 24-gram part in glass-filled polyamide with an annual requirement of 250,000 units. A two-cavity tool runs an estimated 28-second cycle, consuming 972 production hours across three shifts. Moving to four cavities drops machine time to 486 hours, trimming press-time billing by thirty-eight percent against a twenty-five percent bump in upfront tooling cost.
But pushing cavitation past the machine’s sweet spot invites platen deflection, driving dimensional spread across outer cavities until scrap costs eat the tooling savings.
Runner
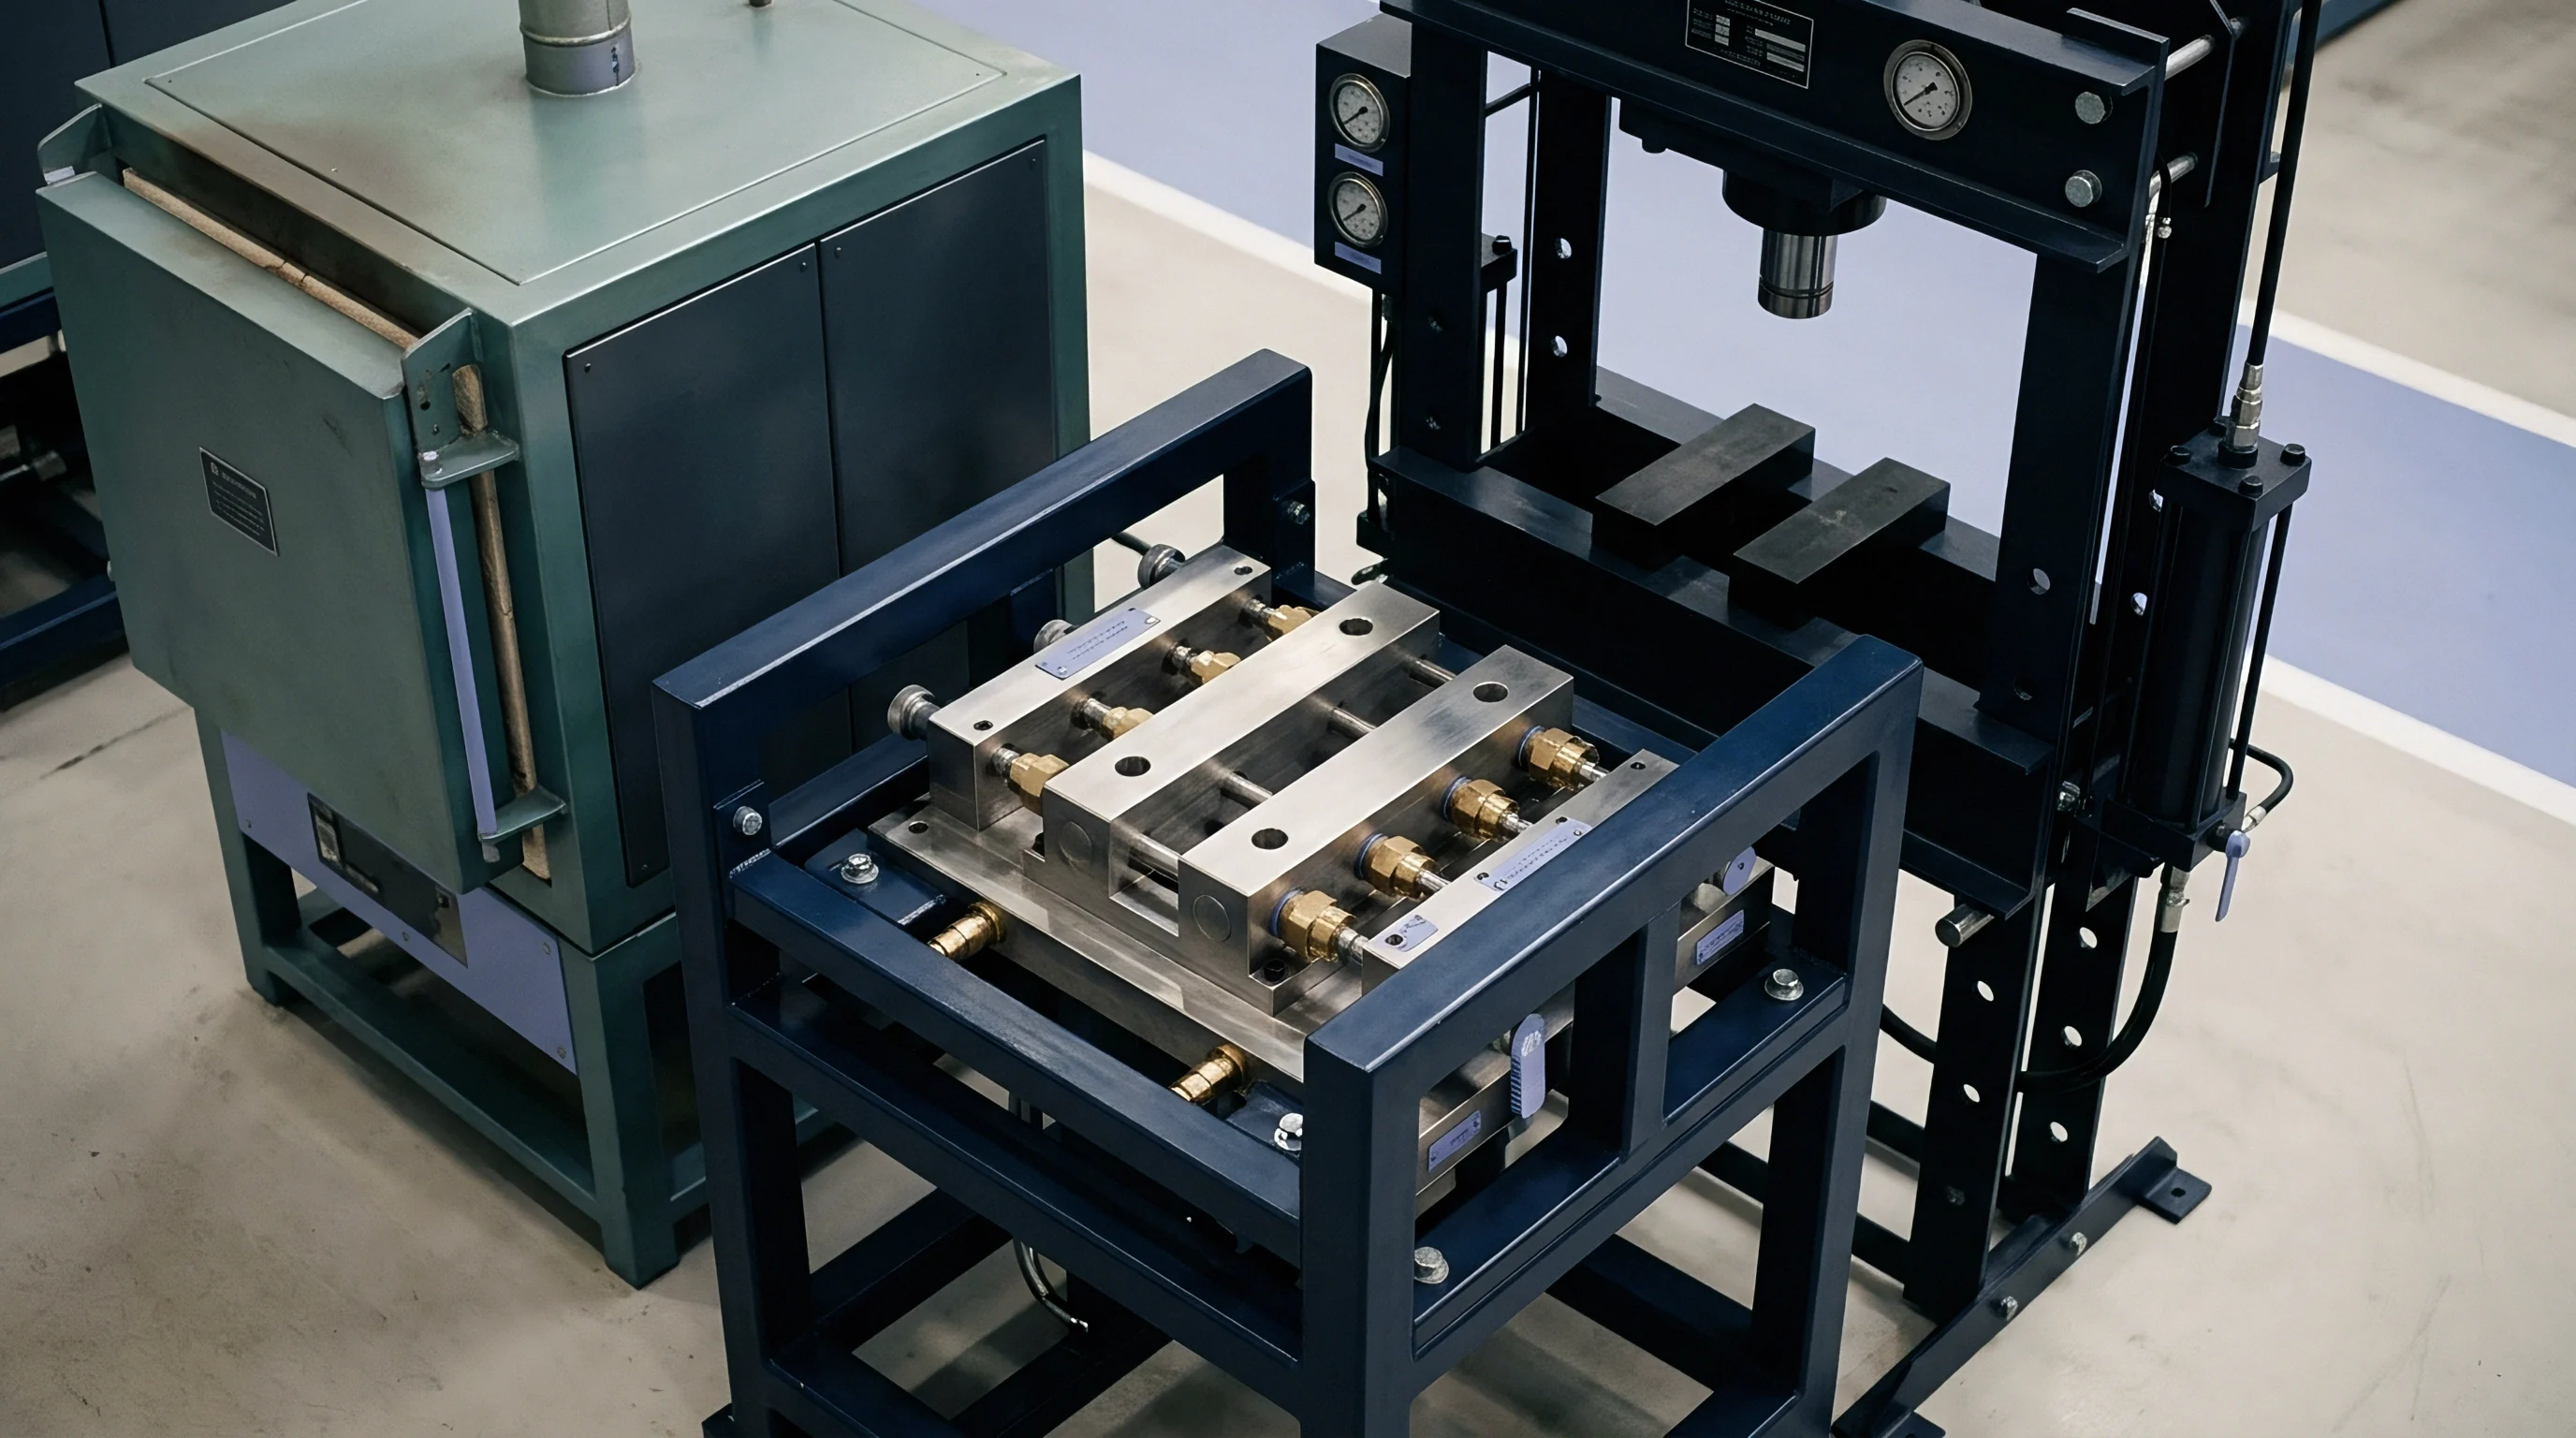
Runner architecture governs thermodynamic and rheological uniformity across multi-cavity tools. The feed system has to move melt from the nozzle to individual gates without cooking the resin or producing unbalanced fill paths. Cold runners keep steel tooling simple, but they bring regrind handling and longer cycles.
Hot runner manifolds eliminate runner scrap and save clamp force, shifting the capital into manifold heaters, valve-gate actuators, and nozzle tips.
Multi-cavity layouts demand geometric balance. Natural balancing keeps flow lengths, runner diameters, and gate dimensions identical from sprue to every cavity gate. Artificial balancing tries to throttle uneven layouts by adjusting runner diameters and gate lands, which rarely holds up in production.
Molten polymers thin under shear; shifting the injection speed alters viscosity unevenly across artificial branches, so inner cavities fill ahead of outer ones whenever the process drifts. Geometric balance maintains fill symmetry across varying injection speeds, keeping packing density uniform.
Geometrically balanced runner networks preserve cavity fill symmetry across broad injection velocity ranges.
Shear heating inside runner branches creates noticeable dimensional drift. High shear along channel walls raises melt temperature while the core remains cooler. When a runner splits in a standard H-pattern, that hotter outer layer shears along one side of the downstream branch while the cooler core tracks to the other.
Cavities fed by the hotter resin run at lower viscosity and higher speed, yielding different volumetric shrinkage than sister cavities taking cooler core material.
| Cavitation Count | Manifold Architecture | Runner Volume Fraction (%) | Pressure Loss (MPa) | Filling Imbalance Spread (%) |
|---|---|---|---|---|
| 4 Cavity | Naturally Balanced Cold Runner | 22 to 30 | 18 to 24 | 1.5 to 3.0 |
| 8 Cavity | Naturally Balanced Cold Runner | 35 to 48 | 28 to 36 | 4.0 to 8.5 |
| 8 Cavity | Balanced Hot Manifold to Sub-gates | 0 | 12 to 16 | 2.0 to 4.0 |
| 16 Cavity | Shear-Controlled Hot Runner | 0 | 15 to 22 | 1.8 to 3.5 |
| 32 Cavity | Standard Hot Manifold System | 0 | 24 to 34 | 6.0 to 14.0 |
Hot runners do away with physical runner scrap, but they complicate heat management through the mold base. Manifolds expand during heat-up, requiring nozzle tip centerlines calculated precisely for operating temperature. An expansion mismatch leads to gate leakage, tip wear, and localized plate softening.
Valve gates shut off cleanly, leaving minimal vestige on cosmetic faces and permitting sequential gating on large parts. Outer-cavity short shots often trace to thermal drops along extended manifold arms rather than resin lot variations.
Heat
Thermal extraction dictates molding cycle time, taking up more than seventy percent of the total press cycle. Steel conduction determines when a part is stiff enough to clear the ejector pins without distortion. Because cooling duration scales with the square of nominal wall thickness, stepping up from 1.5 millimeters to 3.0 millimeters quadruples conduction time before the part reaches safe ejection temperature.
Coolant circuits need turbulent flow. Laminar flow leaves a stagnant boundary layer of warm water clinging to the channel walls, choking heat transfer. Establishing turbulence means pushing Reynolds numbers above 4,000, with production systems typically tuned between 8,000 and 10,000.
Fluid velocity, bore diameter, operating temperature, and glycol concentration all figure into the calculation. Pushing flow far beyond that turbulent threshold offers little cooling benefit while driving up pump wear and line erosion.
Cooling circuit efficiency requires coolant flow rates that maintain fluid turbulence without generating excessive back-pressure.
Mold cooling lines suffer from the same mineral scale found in boiler piping. A scale buildup of just 0.2 millimeters insulates as much as several millimeters of tool steel. When scaling cuts heat transfer, setters often dial chillers lower to compensate, causing ambient humidity to condense on cavity faces and rusting sliding actions.
| Resin Grade | Thermal Diffusivity (mm²/s) | Melt Temp (°C) | Mold Temp (°C) | Eject Temp (°C) | Calculated Cooling Time (s) |
|---|---|---|---|---|---|
| PP Homopolymer | 0.078 | 230 | 40 | 90 | 9.8 |
| HDPE Injection Grade | 0.085 | 220 | 30 | 80 | 10.4 |
| ABS Medium Impact | 0.112 | 240 | 60 | 95 | 7.2 |
| PC Unfilled | 0.124 | 295 | 85 | 130 | 8.6 |
| PA66 30% Glass Filled | 0.135 | 285 | 80 | 145 | 6.4 |
| PBT Unfilled | 0.095 | 255 | 65 | 110 | 8.1 |
Conformal cooling channels built by laser powder bed fusion pull heat evenly around intricate part details. Standard drilled lines cannot follow contoured profiles, leaving deep cores hot and driving differential shrinkage that warps parts. Where channels cannot run, high-conductivity copper alloy inserts pull heat out of isolated ribs and bosses.
Matching heat extraction across core and cavity sides keeps parts flat as they release.


Stroke
Scientific molding isolates process variables into discrete, repeatable machine actions. Decoupled processing splits the injection stroke into filling, packing, and holding stages. Primary fill pushes polymer forward under velocity control until cavities reach ninety-five to ninety-eight percent volumetric completion, switching over to pack pressure at a fixed screw position.
Maintaining a stable melt cushion of three to six millimeters prevents the screw tip from bottoming against the nozzle seat, avoiding cushion loss and the sink marks that follow when hydraulic transfer drops off during pack.

How Injection Speed Governs In-Mold Viscosity?
Viscosity drops as injection velocity rises because polymer chains align under shear. Generating an in-mold rheology curve locates the stable operating window: the setter increases injection speed incrementally, logging peak injection pressure and fill time at every step. Plotting relative viscosity against shear rate shows a steep drop that eventually levels out.
Operating on that flat plateau keeps minor press variations from causing drastic shifts in fill behavior.
- First Stage Fill brings the molten polymer to ninety-five percent volume under pure velocity control, preventing gate blush and sink marks.
- Transfer Position Calibration shifts the machine from velocity to pressure control based on screw position, isolating volumetric fill from machine hydraulic variations.
- Second Stage Pack introduces hydrostatic pressure to compress polymer molecules, compensating for volumetric shrinkage during initial phase change.
- Hold Phase Gate Seal maintains continuous pressure until the gate freezes solid, preventing molten material from siphoning backward into the runner.
- Plasticizing and Screw Recovery rotates the screw under proportional back pressure to prepare a thermally homogeneous melt pool for the subsequent cycle.
Nailing down hold duration takes a gate seal study. The technician steps up hold time across consecutive shots, weighing parts after each run. Part weight climbs until the gate freezes solid, after which it levels out.
Adding one to two seconds to that freeze point ensures density and dimensional stability without bleeding cycle time.
ISO 294-1 specifies precise injection velocity and pressure profiles to ensure test specimens reflect true polymer baseline properties rather than processing artifacts.
Cavity pressure sensors show what actually happens inside the steel. Hydraulic gauges on the press manifold register machine resistance, obscuring pressure drops across the machine nozzle, runners, and gates. Piezoelectric quartz transducers seated behind ejector pins read direct packing force on the melt.
Tracking peak cavity pressure and pressure integrals across multi-cavity tools makes it possible to divert off-spec parts automatically the moment dynamic holding drifts out of tolerance.

Spread
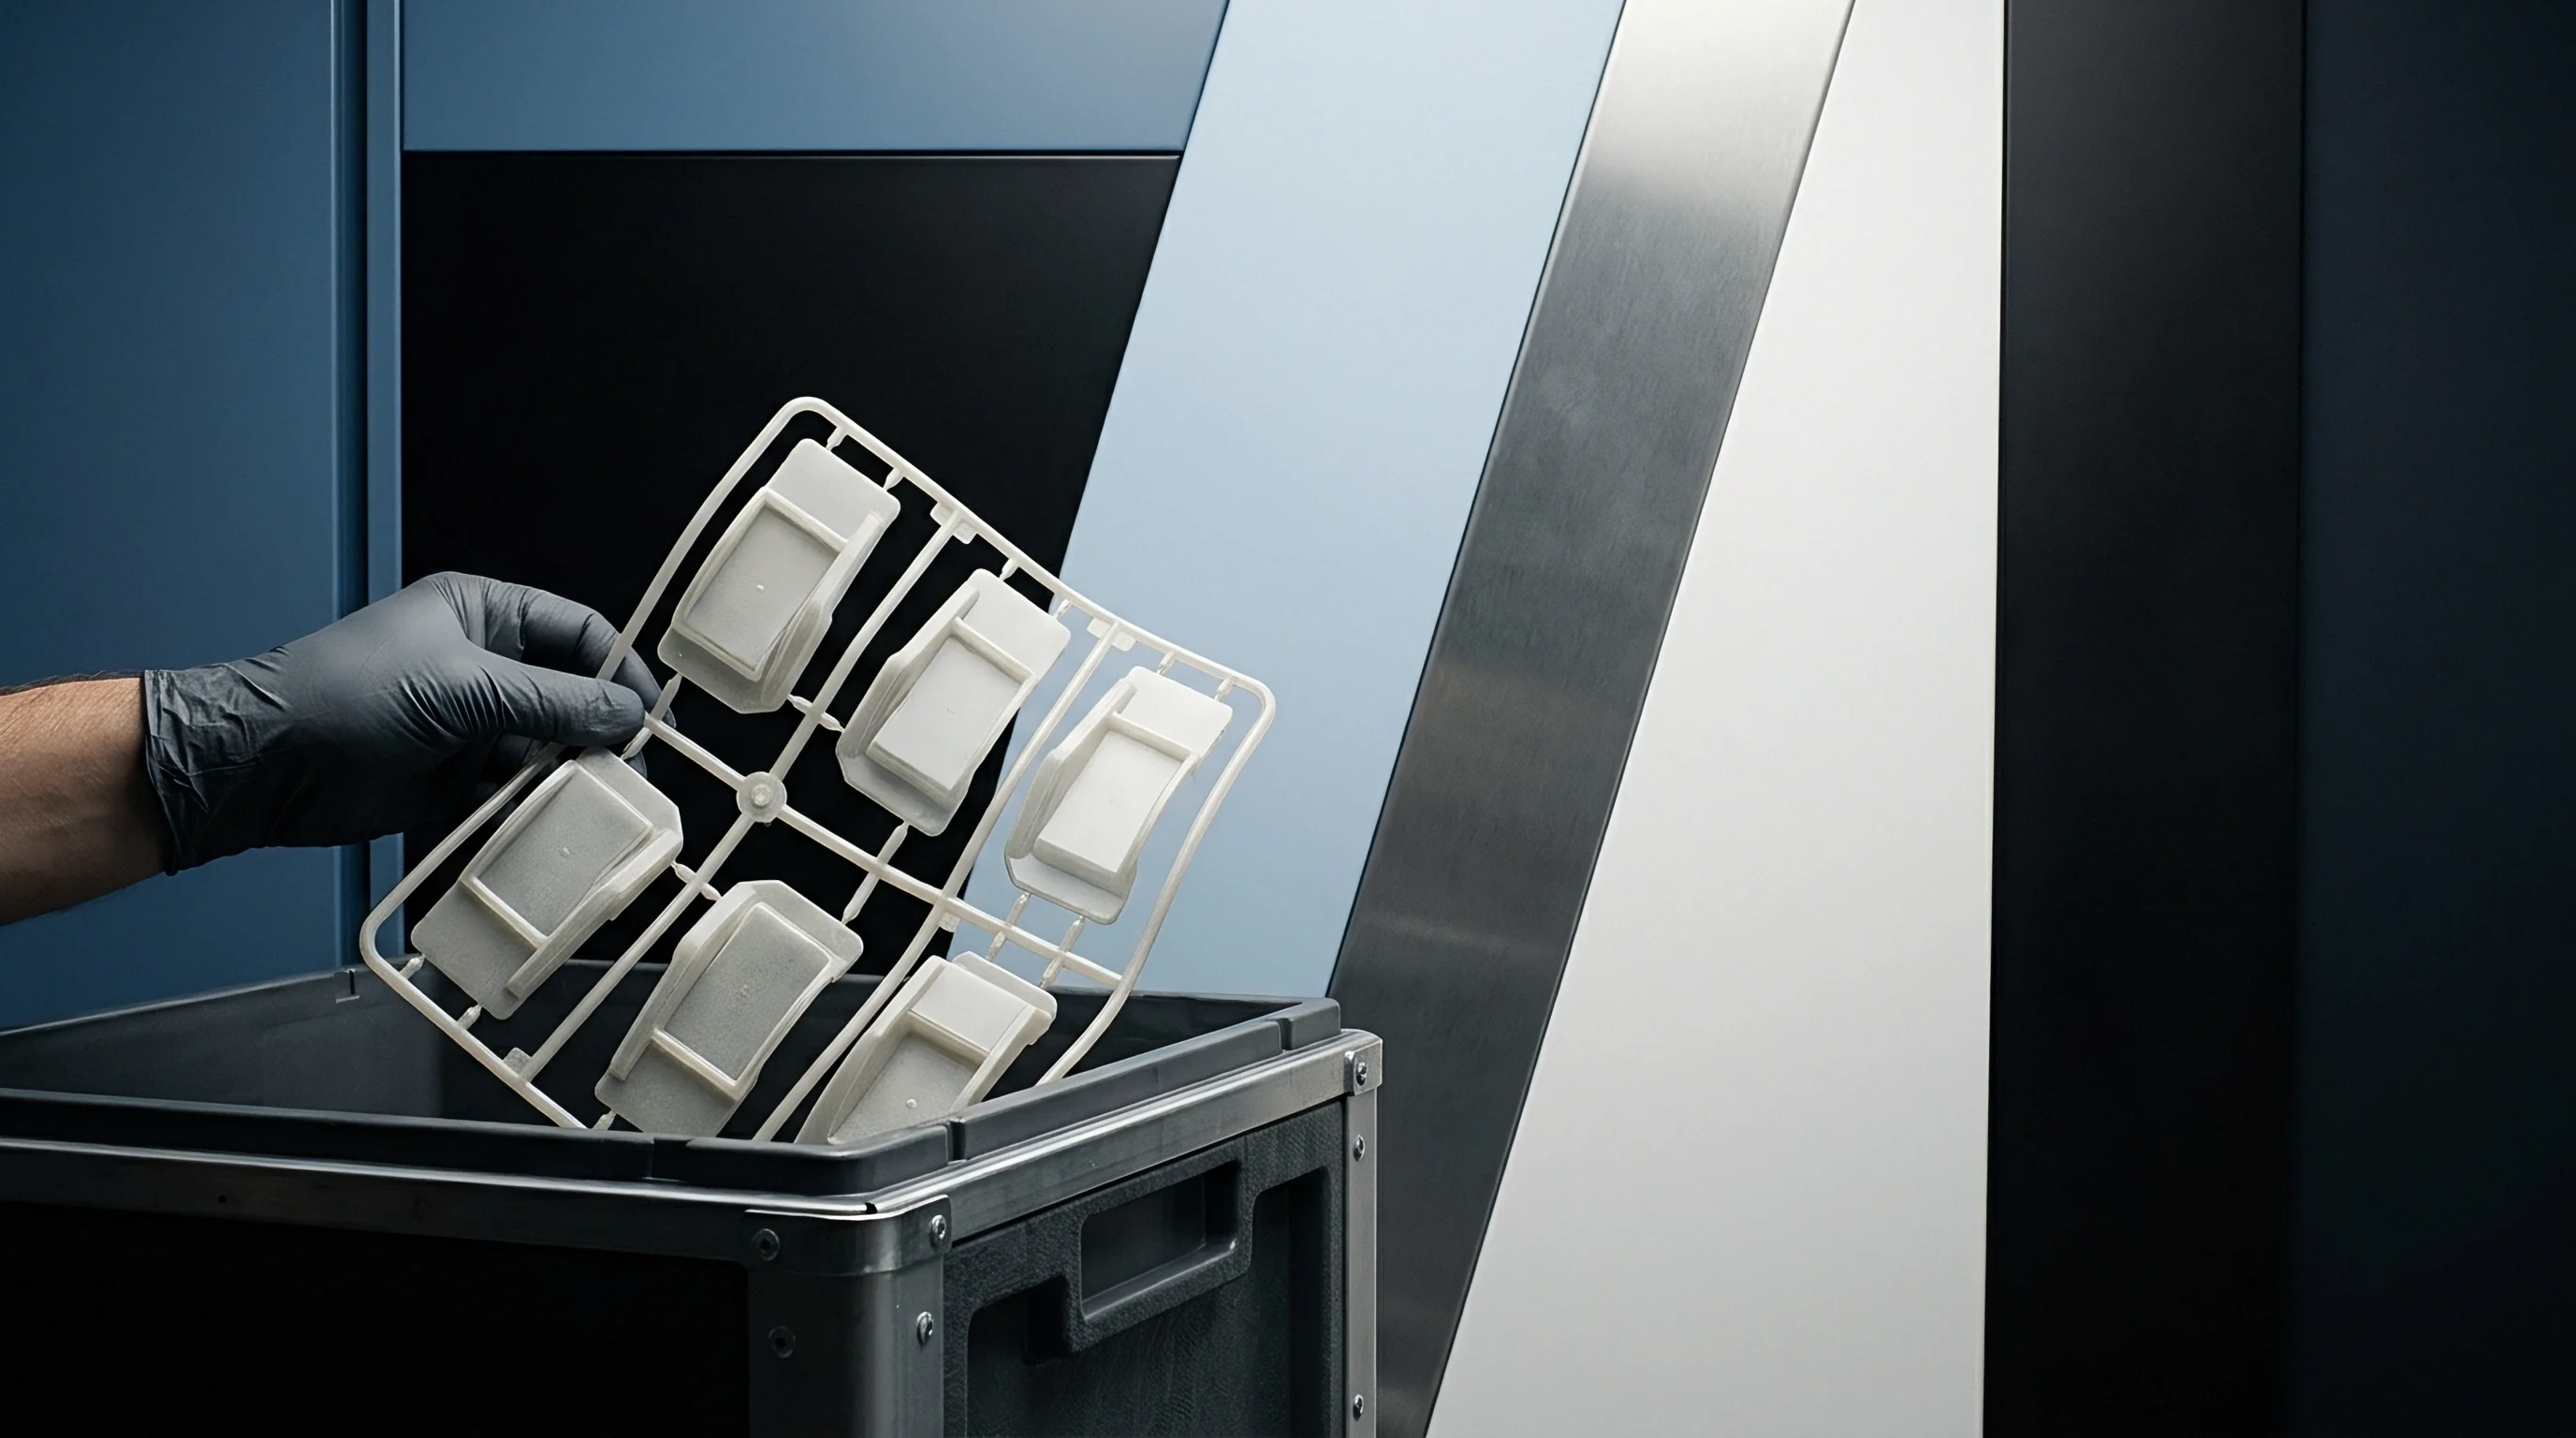
Cavity-to-cavity variation sets the real yield ceiling on high-cavitation tooling. A single-cavity prototype tool holds tight tolerances with little trouble, but jumping to sixteen or thirty-two cavities multiplies the sources of error. Toolroom steel machining tolerances stack with temperature gradients across platens and uneven pressure drops down the runner system; because corrective steel adjustments require pulling impressions offline, each added cavity broadens the dimensional spread.
DIN 16742 groups molding tolerances into grades from TG1 to TG9. Meeting tight brackets like TG3 takes high toolmaker precision, balanced cooling, and low-shrinkage amorphous resins. Semi-crystalline materials like polyoxymethylene and polypropylene show pronounced post-mold shrinkage that magnifies cavity-to-cavity differences.
Measuring twenty consecutive shots on a 16-cavity mold separates machine drift over time from physical offsets between impressions.
| Cavitation Level | Polymer Morphology | DIN 16742 Grade | Nominal Dimension Tolerance (mm) | Achieved Process Capability (Cpk) |
|---|---|---|---|---|
| 1 to 2 Cavities | Amorphous (PC, ABS) | TG3 | ±0.04 to ±0.07 | 1.67 to 2.10 |
| 4 to 8 Cavities | Amorphous (PC, ABS) | TG4 | ±0.08 to ±0.12 | 1.45 to 1.72 |
| 4 to 8 Cavities | Semi-Crystalline (PA66, POM) | TG5 | ±0.13 to ±0.19 | 1.33 to 1.55 |
| 16 to 32 Cavities | Amorphous (PC, ABS) | TG5 | ±0.14 to ±0.20 | 1.30 to 1.48 |
| 16 to 32 Cavities | Semi-Crystalline (PP, PE) | TG6 | ±0.21 to ±0.32 | 1.10 to 1.35 |
Tool qualification calls for evaluating process capability by individual impression rather than pooling all parts into one dataset. A pooled calculation masks cavity-level drift: cavity four can run on the high limit while cavity twelve sits on the low limit, yielding an apparently capable bell curve even though both produce rejects as soon as ambient plant temperatures swing during a night shift.
Separating physical steel offsets from uneven cooling remains the hardest part of tool sign-off. Toolmakers often polish steel to pull an outlier cavity into spec, permanently altering its geometry to offset what is actually a transient thermal or flow issue. As soon as cooling lines foul or chiller supply temperatures drift with the seasons, that altered steel puts parts right back out of tolerance.