Tensile Creep Testing Parameters for Short Fiber Thermoplastics
Tensile creep parameters for short fiber thermoplastics require testing excised part coupons along and across melt flows under controlled moisture and temperature.
Specimen
Tensile creep compliance in fiber-filled thermoplastic parts reflects anisotropic orientation patterns established during cavity filling rather than resin properties alone. Standard injection-moulded test bars processed under ISO 527-2 Type 1A or ASTM D638 Type I geometries yield high skin orientation along the flow path. Fiber orientation tensors within a standard ISO tensile dogbone routinely exhibit a principal orientation component (a11) exceeding 0.75 near the surface layers.
The core layer retains a transverse or planar random distribution where a11 falls below 0.35. Engineers sizing load-bearing structural bosses, pressurized fluid housings, or snap-fit assemblies discover that raw creep data taken from aligned test coupons overestimates component life by orders of magnitude when sustained service stress acts perpendicular to the local melt stream.
Test piece extraction protocols dictate the predictive validity of long-term mechanical qualification dossiers. Extracting specimens from actual mouldings through secondary machining exposes the spatial heterogeneity that standard dogbones mask. ISO 899-1 establishes the framework for determining tensile creep behavior under static load, prescribing specimen geometries conforming to ISO 20753.
Applying these standard dimensions to short glass fiber reinforced polyamide (PA66-GF30) or polybutylene terephthalate (PBT-GF30) parts requires extraction along both principal melt flow directions and transverse axes. A coupon milled across the weld line of an end-gated housing reveals the structural baseline of the component. The transverse orientation lowers instantaneous tensile modulus by 40 to 60 percent relative to flow-aligned samples, while secondary creep strain rates escalate by factors of three to ten under equivalent load.
Tensile creep coupon orientation relative to local melt streamlines decides whether compliance data captures structural capacity or overstates component longevity.
Machining geometry introduces severe edge effects in fiber-reinforced matrices. Micro-milling or waterjet cutting coupons from flat part sections shears glass fibers at the boundary. These damaged fibers create peripheral stress concentrations and localized debonding sites.
Machined specimens require edge polishing down to a surface roughness (Ra) below 0.8 micrometers to prevent premature tertiary rupture. Injection tool design for dedicated creep plaques eliminates boundary damage. Toolmakers deploy multi-cavity end-gated strip tools or center-gated plaque tools with film gates to generate controllable orientation fields.
DIN 16742 tolerance grades apply to tool steel dimensions, but cavity shrinkage across anisotropic fibers remains non-linear. Longitudinal shrinkage in 30 percent glass-filled nylon holds between 0.2 and 0.5 percent. Transverse shrinkage expands to 0.7 through 1.2 percent, warping standard test geometries if cooling circuit placement leaves thermal differentials across the cavity face.
Specimen thickness alters the core-to-skin thickness ratio. Injection velocity, melt temperature, and mold wall thermal conductivity govern skin formation. In a 2.0 mm wall section, high shear stresses orient fibers parallel to the wall, leaving a thin core.
At a 4.0 mm wall section, the lower shear rate in the central flow stream allows fibers to tumble into planar or transverse orientations, swelling the isotropic or transverse core to half the cross section. Sourcing teams paying for high-cavitation tooling based on 4.0 mm material data sheets encounter out-of-spec deflection when the production part runs at a 1.8 mm nominal wall.
Specimens conditioned under ISO 1110 undergo accelerated moisture conditioning to equilibrium before creep frames accept their gauge lengths. Polyamides reach equilibrium at 50 percent relative humidity and 23 degrees Celsius with approximately 2.0 percent water absorption by weight, dropping the matrix glass transition temperature (Tg) into room-temperature operating envelopes. Unconditioned dry-as-moulded test samples conceal this vulnerability entirely.
An overlooked variable remains whether clamping pressure from mechanical grips induces lateral micro-cracking inside the tab sections prior to load initiation.
Rig
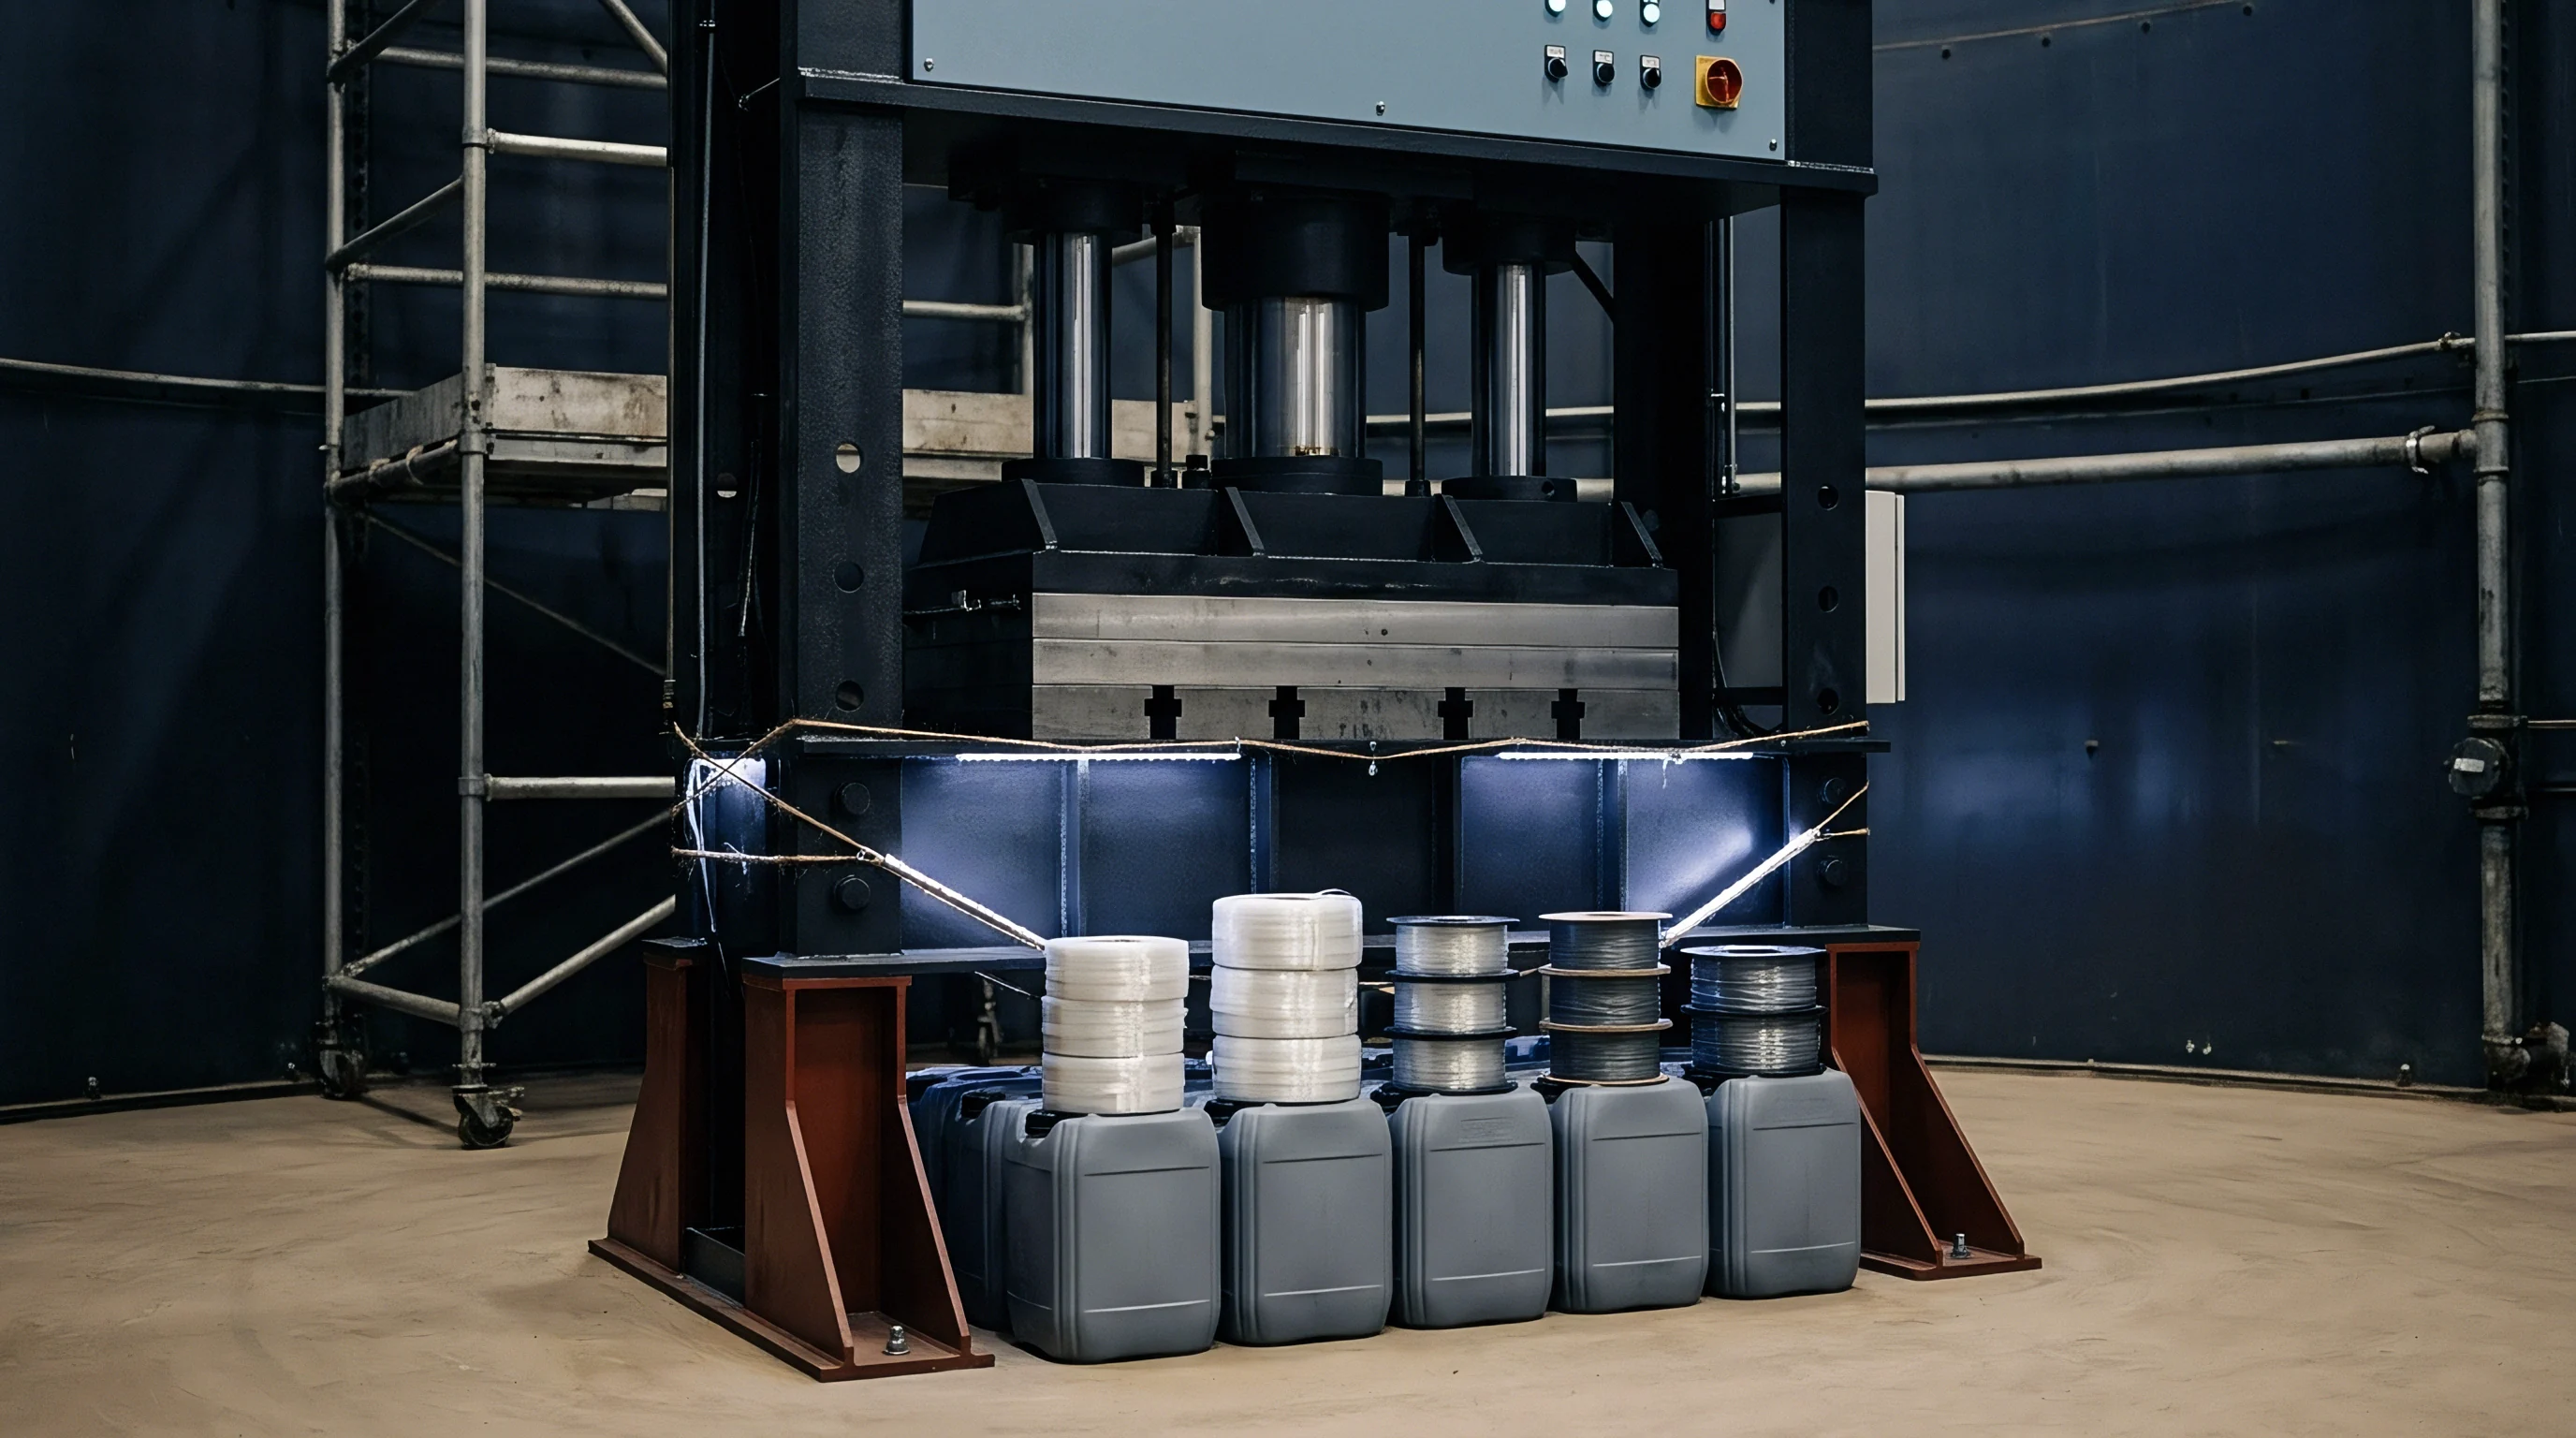
Tensile creep testing instrumentation demands absolute load stability and thermal isolation over thousands of hours. Universal testing frames operating in crosshead displacement control cannot perform ISO 899-1 creep evaluation because machine compliance, motor thermal drift, and lead-screw wear introduce force fluctuations. Creep frames use dead-weight cantilever loading or closed-loop electromechanical lever-arm systems fitted with class 0.5 load cells conforming to ISO 7500-1.
Dead-weight lever systems provide constant mechanical force independent of electrical utility drops, utilizing precision knife-edge pivots with mechanical advantage ratios of 10:1 or 20:1. The mechanical lever eliminates load drift over a 10,000-hour test run. Closed-loop servo-electric actuators maintain identical load precision, correcting for specimen elongation dynamically within 0.2 percent of the specified test force.
Grip Mechanics and Biaxial Alignment
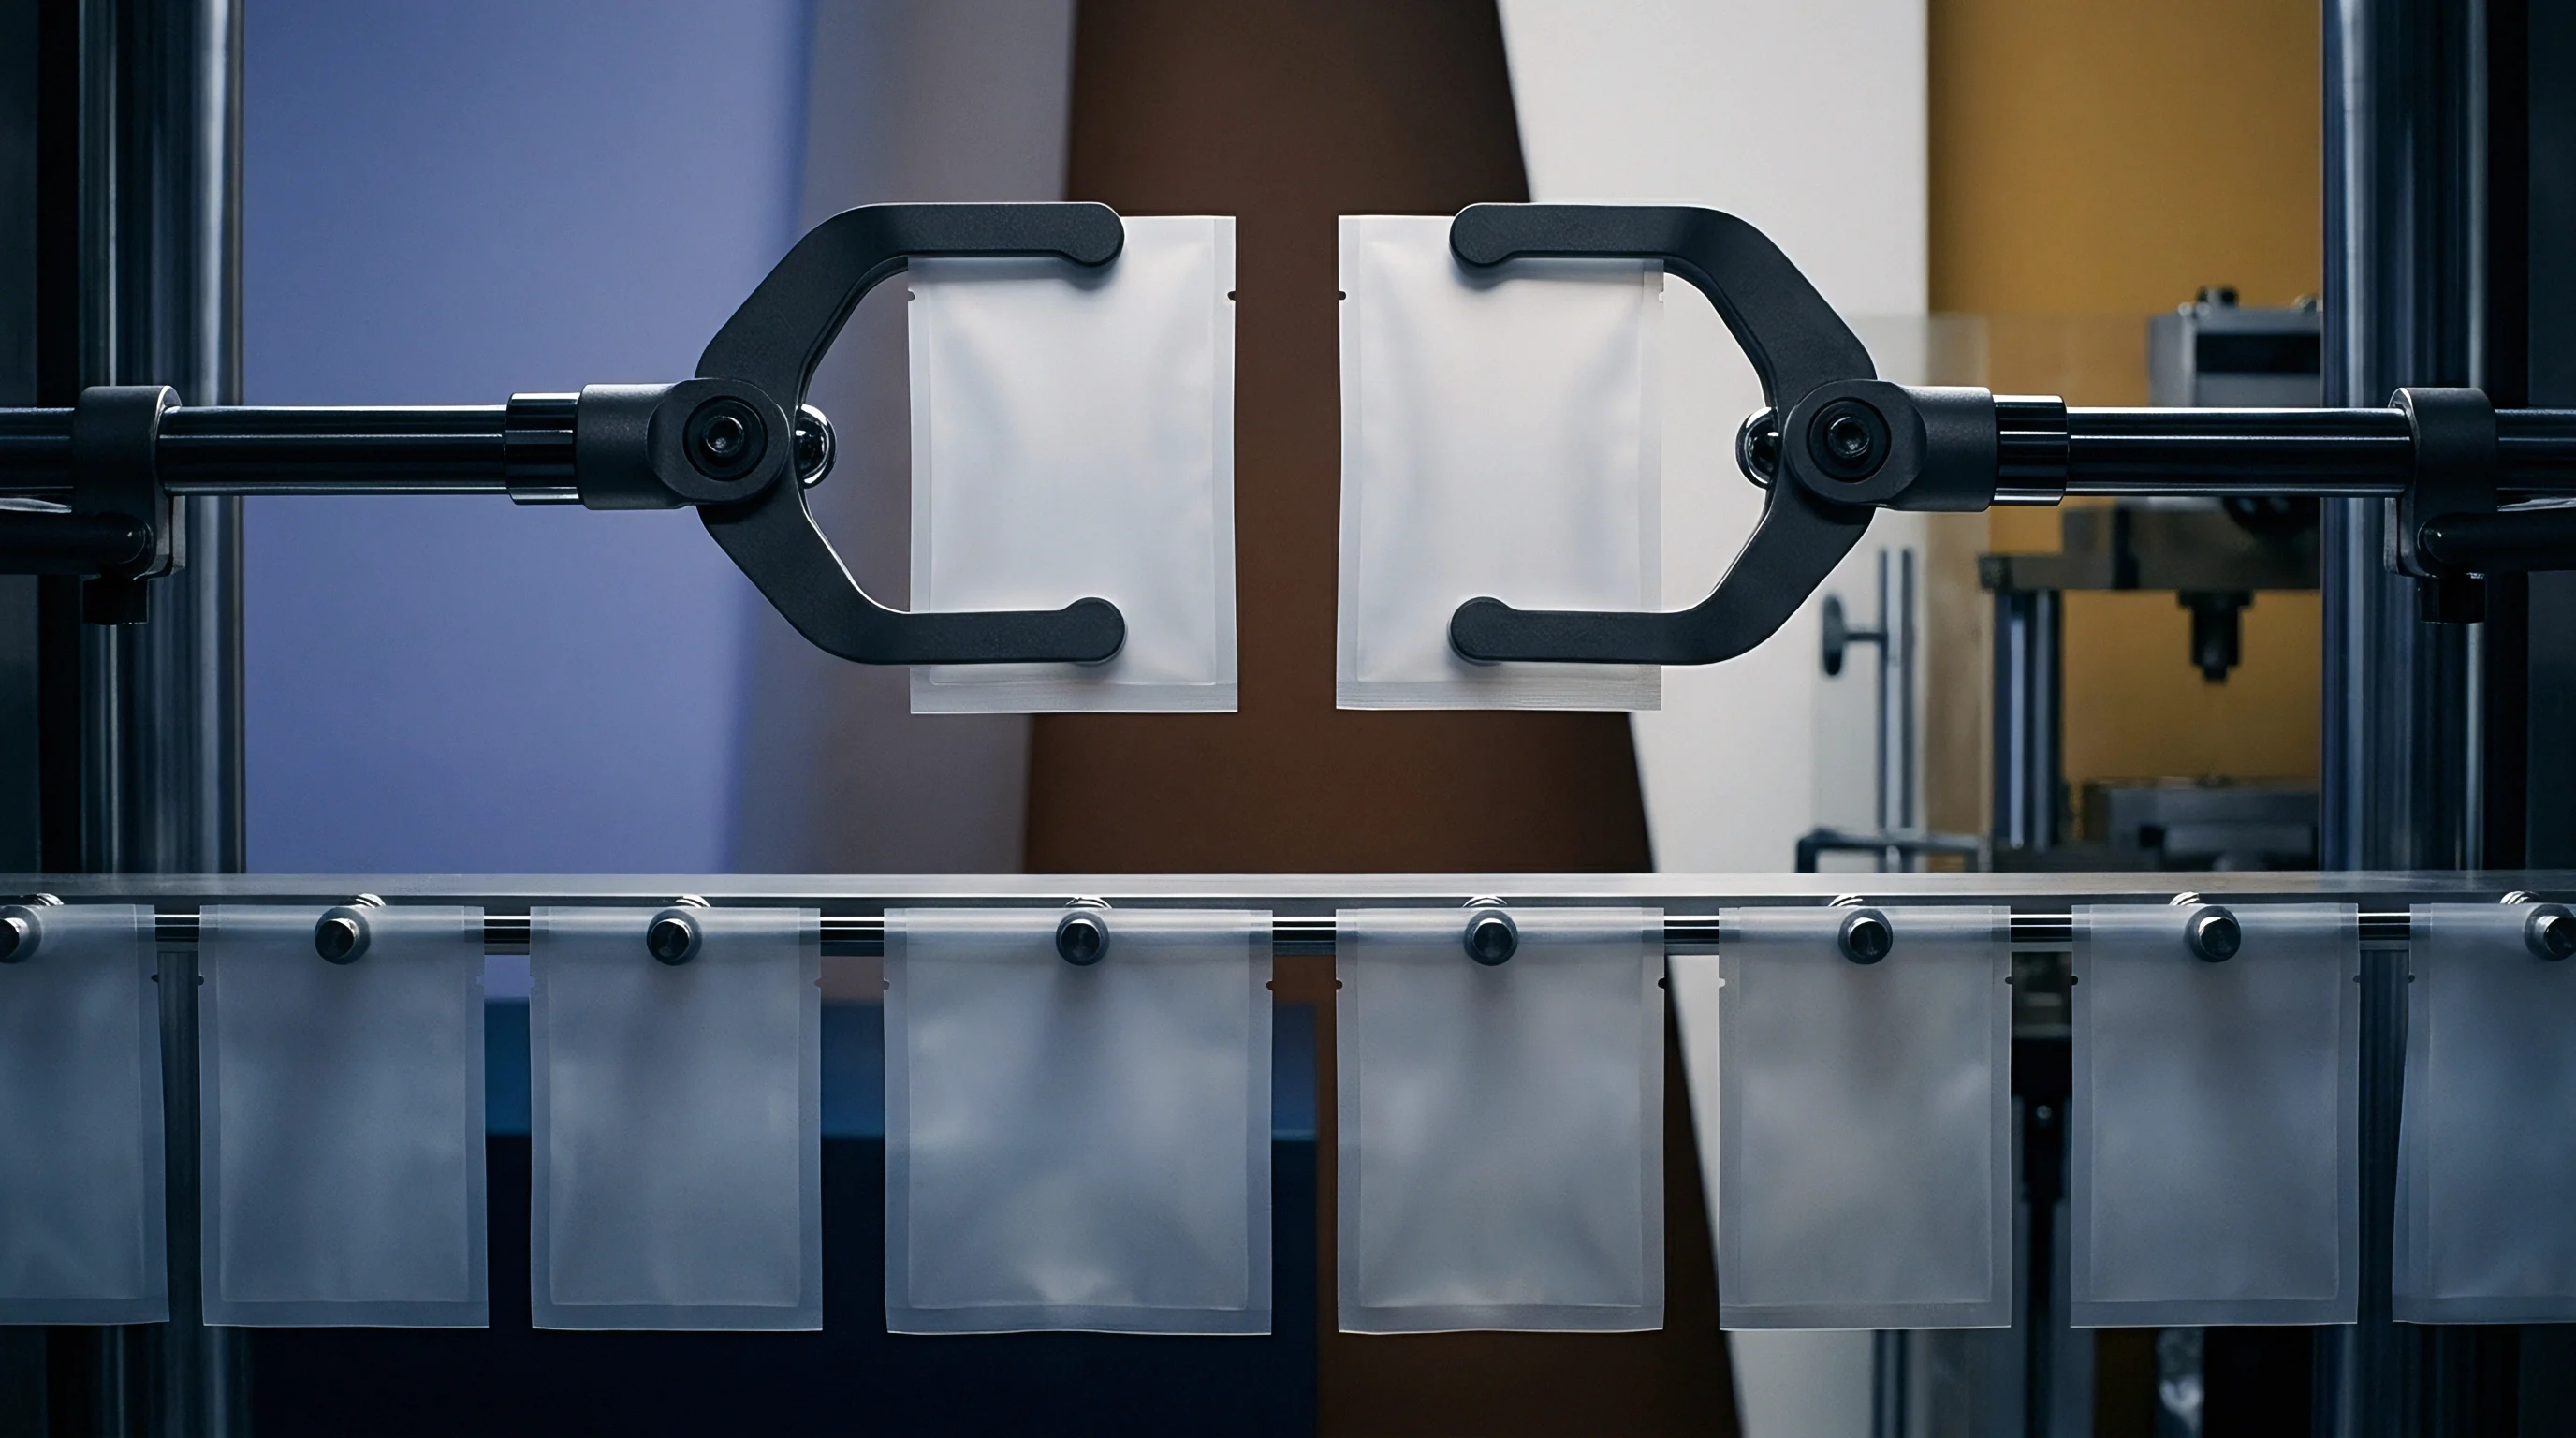
Clamping short fiber thermoplastics requires self-aligning wedge grips to neutralize bending moments. Axial alignment must comply with ISO 23788 and ASTM E1012 class 5 limits. Bending strains exceeding 3 percent of the axial creep strain invalidate viscoelastic measurements, inducing premature micro-buckling on the compressive specimen face and accelerating tensile cavitation on the opposing surface.
Serrated grip faces bite into polymer surfaces, initiating localized shear cracks in notch-sensitive resins like polyphthalamide (PPA-GF40) or polyphenylene sulfide (PPS-GF40). Toolmakers fabricate specimen tabs with generous transition radii conforming to ISO 20753 Type A1 geometry, while lab technicians employ hydraulic parallel-closing grips lined with fine-grit abrasive surfaces to spread clamp forces evenly over 1,200 square millimeters of tab area.
Strain Measurement Technologies
Strain detection relies on direct mechanical contact or non-contact optical tracking across the designated gauge length. Knife-edge clip-on extensometers must exhibit counterbalanced suspensions. A heavy extensometer clamped directly to a 2 mm thick polyketone or nylon coupon induces a static bending moment that distorts long-term creep curves.
Contact extensometers require dual-sided averaging sensors using linear variable differential transformers (LVDTs) operating to ISO 9513 Class 0.2 precision. Optical extensometry and digital image correlation (DIC) mitigate physical mass effects entirely. DIC cameras track high-contrast stochastic speckle patterns applied to the gauge section, recording axial and transverse strain fields simultaneously.
DIC tracking extracts Poisson ratio evolution as viscoelastic dilatation develops inside the matrix under sustained tension.
| Measurement Subsystem | Transducer Mechanism | Calibration Standard | Permissible Drift Envelope | Impact on Creep Modulus |
|---|---|---|---|---|
| Axial Force Generation | Dead-weight 10:1 lever arm | ISO 7500-1 Class 0.5 | Plus or minus 0.5 percent load | Linear stress level shift |
| Gauge Axial Strain | Dual-sided averaging LVDT | ISO 9513 Class 0.2 | Plus or minus 1.0 micrometer | Distorts primary creep knee |
| Full-field Strain Field | Stereo DIC optical cameras | ISO 9513 Class 0.5 | Plus or minus 0.005 percent strain | Resolves localized necking |
| Chamber Temperature | Pt100 resistance thermometer | IEC 60751 Class A | Plus or minus 0.5 deg C | Shifts polymer relaxation time |
| Atmospheric Moisture | Capacitive thin-film sensor | ISO 18453 calibration | Plus or minus 2.5 percent RH | Alters polyamide plasticization |
Thermal chambers enclose the test piece to maintain environmental stability across exposures reaching 150 degrees Celsius. Chamber air circulation must prevent thermal stratification; vertical gradients along the 50 mm gauge length cannot exceed 0.5 degrees Celsius under ISO 899-1. Convective airflow velocities inside the enclosure must remain low to prevent uneven surface cooling of the specimen.
Thermal drift shifting the Pt100 sensor by 2 degrees Celsius alters polyarylamide (PARA-GF50) creep strain rates by 18 percent due to Arrhenius-type activation of molecular chain mobility.
Failure to isolate the frame from floor-borne punch press vibrations introduces mechanical cyclic rattling that accelerates interfacial debonding between fiber and resin.

Stress
Selecting applied creep stress levels demands rigorous mapping against the short-term ultimate tensile strength (UTS) of the specific short-fiber grade. Short fiber thermoplastics exhibit non-linear viscoelastic behavior at elevated stress states. Applying 60 percent of short-term UTS to a 30 percent glass-filled polyetherimide (PEI-GF30) coupon initiates non-linear strain acceleration within minutes of loading.
ISO 899-1 stipulates testing at multiple stress steps to isolate linear viscoelastic boundaries from non-linear damage domains. The linear limit typically caps between 0.2 percent and 0.5 percent total strain. Operating below this linear threshold, tensile creep modulus remains independent of applied stress.
Above this threshold, internal crazing, matrix yielding, and fiber-end void nucleations accelerate creep rates.
Stress Selection Protocol
- Baseline characterization measures quasi-static ultimate tensile strength and tensile modulus on identical specimen geometries under ISO 527 rates of 1 mm or 5 mm per minute.
- Linear boundary determination executes isochronous stress-strain evaluations across five distinct stress levels, verifying whether creep modulus curves superimpose up to 0.4 percent strain.
- Service envelope assignment distributes sustained creep stress levels across 15, 30, 45, and 60 percent of room-temperature ultimate tensile strength.
- High-temperature scaling derates chosen static stress targets to match tensile yield drops recorded at 60, 90, and 120 degrees Celsius.
Load application speed constitutes a critical control parameter. Shock loading induces inertia spikes that produce plastic damage inside the initial strain recording. The load application mechanism must apply total force smoothly without bounce within a period between 1 and 5 seconds, conforming to ISO 899-1 rules.
The clock measuring creep duration starts precisely at the moment the full dead weight engages the load train. Initial strain reading happens exactly at the 60-second mark to define the baseline reference modulus. Straining that occurs inside the initial 60 seconds captures both elastic deflection and immediate viscoelastic retardation.
Applying static loads faster than one second introduces inertial stress overshoots that prematurely micro-crack fiber ends within the polymer core.
Engineering designers often utilize the isochronous stress-strain diagram to calculate long-term load support. Plotting stress against strain at fixed time snapshots (1 hour, 10 hours, 100 hours, 1,000 hours, and 10,000 hours) produces secant modulus lines across varying loads. When isochronous lines curve toward the strain axis, the material operates in non-linear creep.
Glass-filled semi-crystalline polymers exhibit high resistance to non-linear transitions below their glass transition temperature. Once ambient temperatures cross Tg, non-linear deformation occurs at stress values as low as 20 percent of instantaneous yield strength.
A supplier will claim that a glass-fiber material handles 50 Megapascals continuously because the room-temperature yield point sits at 170 Megapascals on a fresh datasheet.


Environment
Thermomechanical performance cannot decouple from chemical and thermal exposure during long-term static loading. Elevated temperature accelerates both secondary creep elongation and chemical degradation mechanisms. In aliphatic polyamides (PA6, PA66), continuous exposure to 80 degrees Celsius in ambient air initiates thermo-oxidative chain scission along molecular backbones, embrittling the skin layer and facilitating micro-crack progression along fiber interfaces.
A testing program running 5,000 hours at elevated thermal conditions without controlled inert gas or oxygen tracking conflates viscoelastic creep flow with irreversible macromolecular degradation.
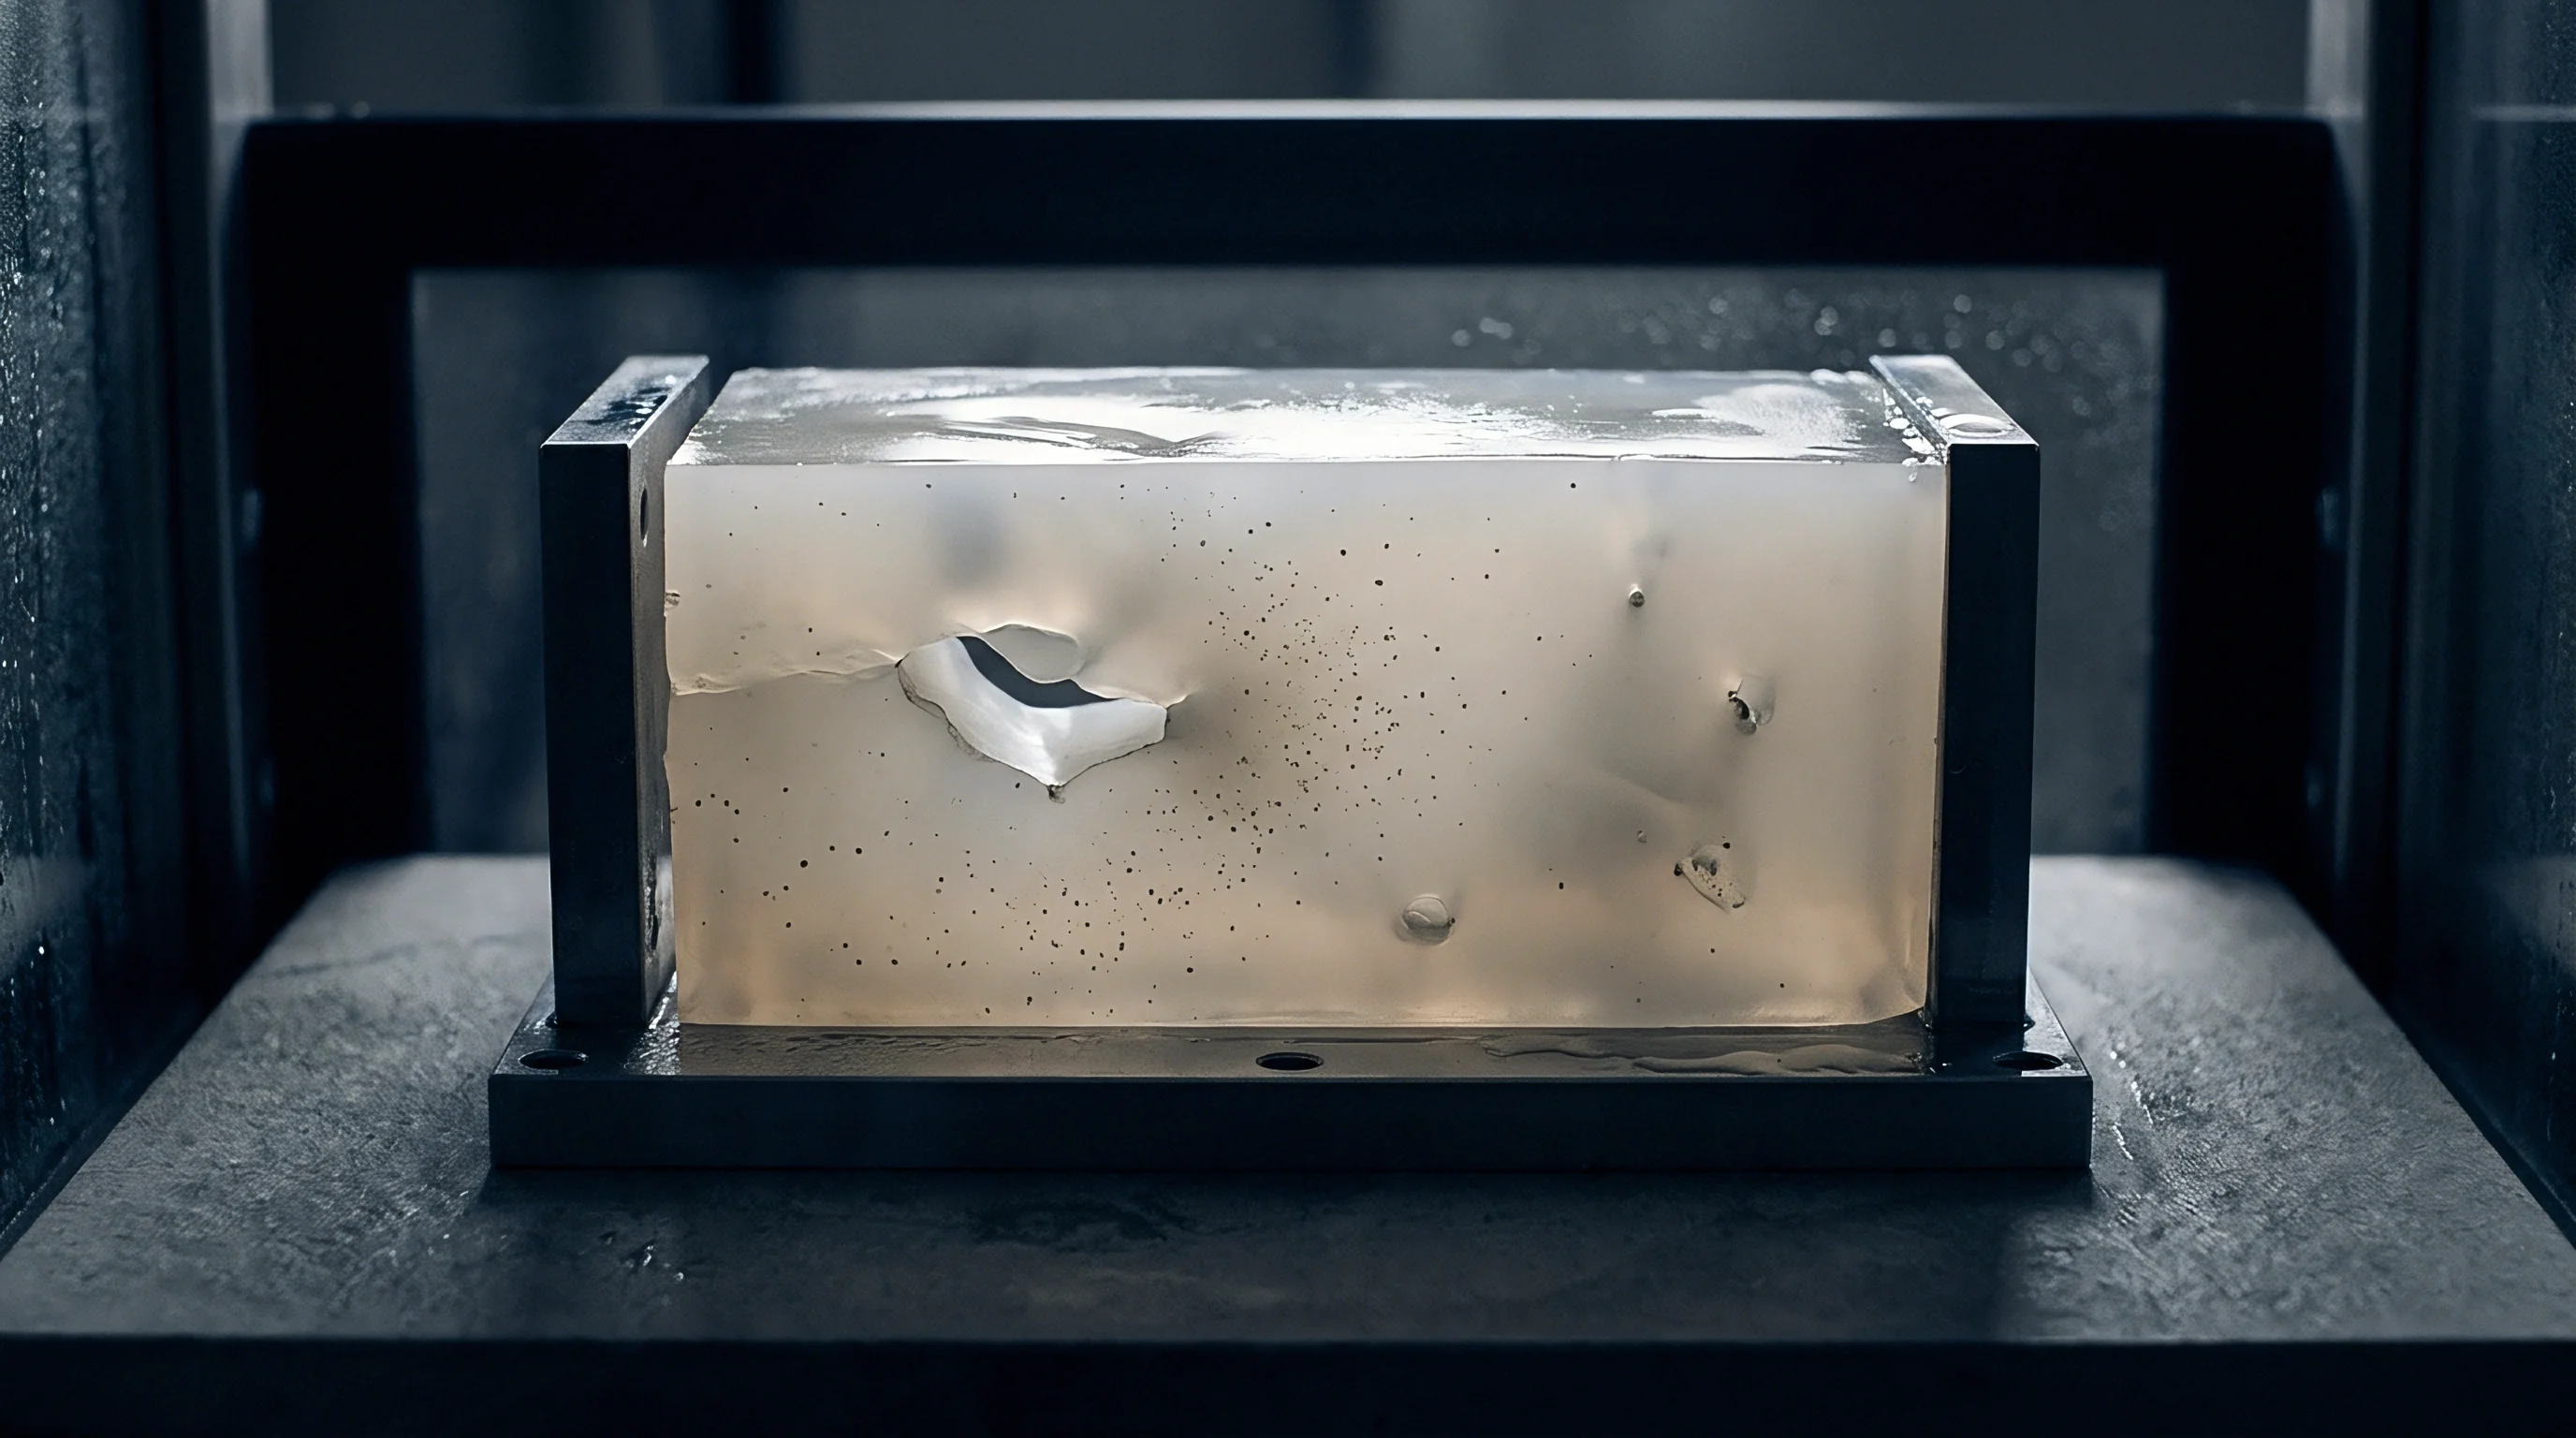
Moisture Equilibrium Dynamics in Polyamides
Moisture acts as an aggressive plasticizer within hydrophilic matrices like PA6, PA66, and polyphthalamide copolymers. Water molecules break interchain hydrogen bonds between amide groups, shifting the polymer glass transition temperature downward by up to 50 degrees Celsius. Dry-as-moulded PA66-GF30 exhibits a Tg near 65 degrees Celsius.
Saturated at 50 percent relative humidity, the effective Tg collapses to minus 5 degrees Celsius. Testing moisture-conditioned coupons at 23 degrees Celsius evaluates the polymer in its rubbery plateau state, accelerating creep strain accumulation by 400 percent relative to dry parts.
| Polymer Matrix and Glass Loading | Equilibrium Moisture at 50% RH | Dry Tg Value | Conditioned Tg Value | 1,000-Hour Creep Modulus at 23 C | 1,000-Hour Creep Modulus at 80 C |
|---|---|---|---|---|---|
| PA66-GF30 | 2.1 to 2.4 wt% | 68 deg C | -2 to 4 deg C | 4,100 MPa | 1,850 MPa |
| PBT-GF30 | 0.15 to 0.20 wt% | 45 deg C | 42 deg C | 7,200 MPa | 3,900 MPa |
| PPS-GF40 | 0.02 to 0.05 wt% | 90 deg C | 90 deg C | 11,400 MPa | 7,800 MPa |
| PPA-GF35 | 0.80 to 1.10 wt% | 125 deg C | 85 deg C | 8,900 MPa | 5,200 MPa |
| PEI-GF30 | 0.45 to 0.55 wt% | 215 deg C | 210 deg C | 8,100 MPa | 7,400 MPa |
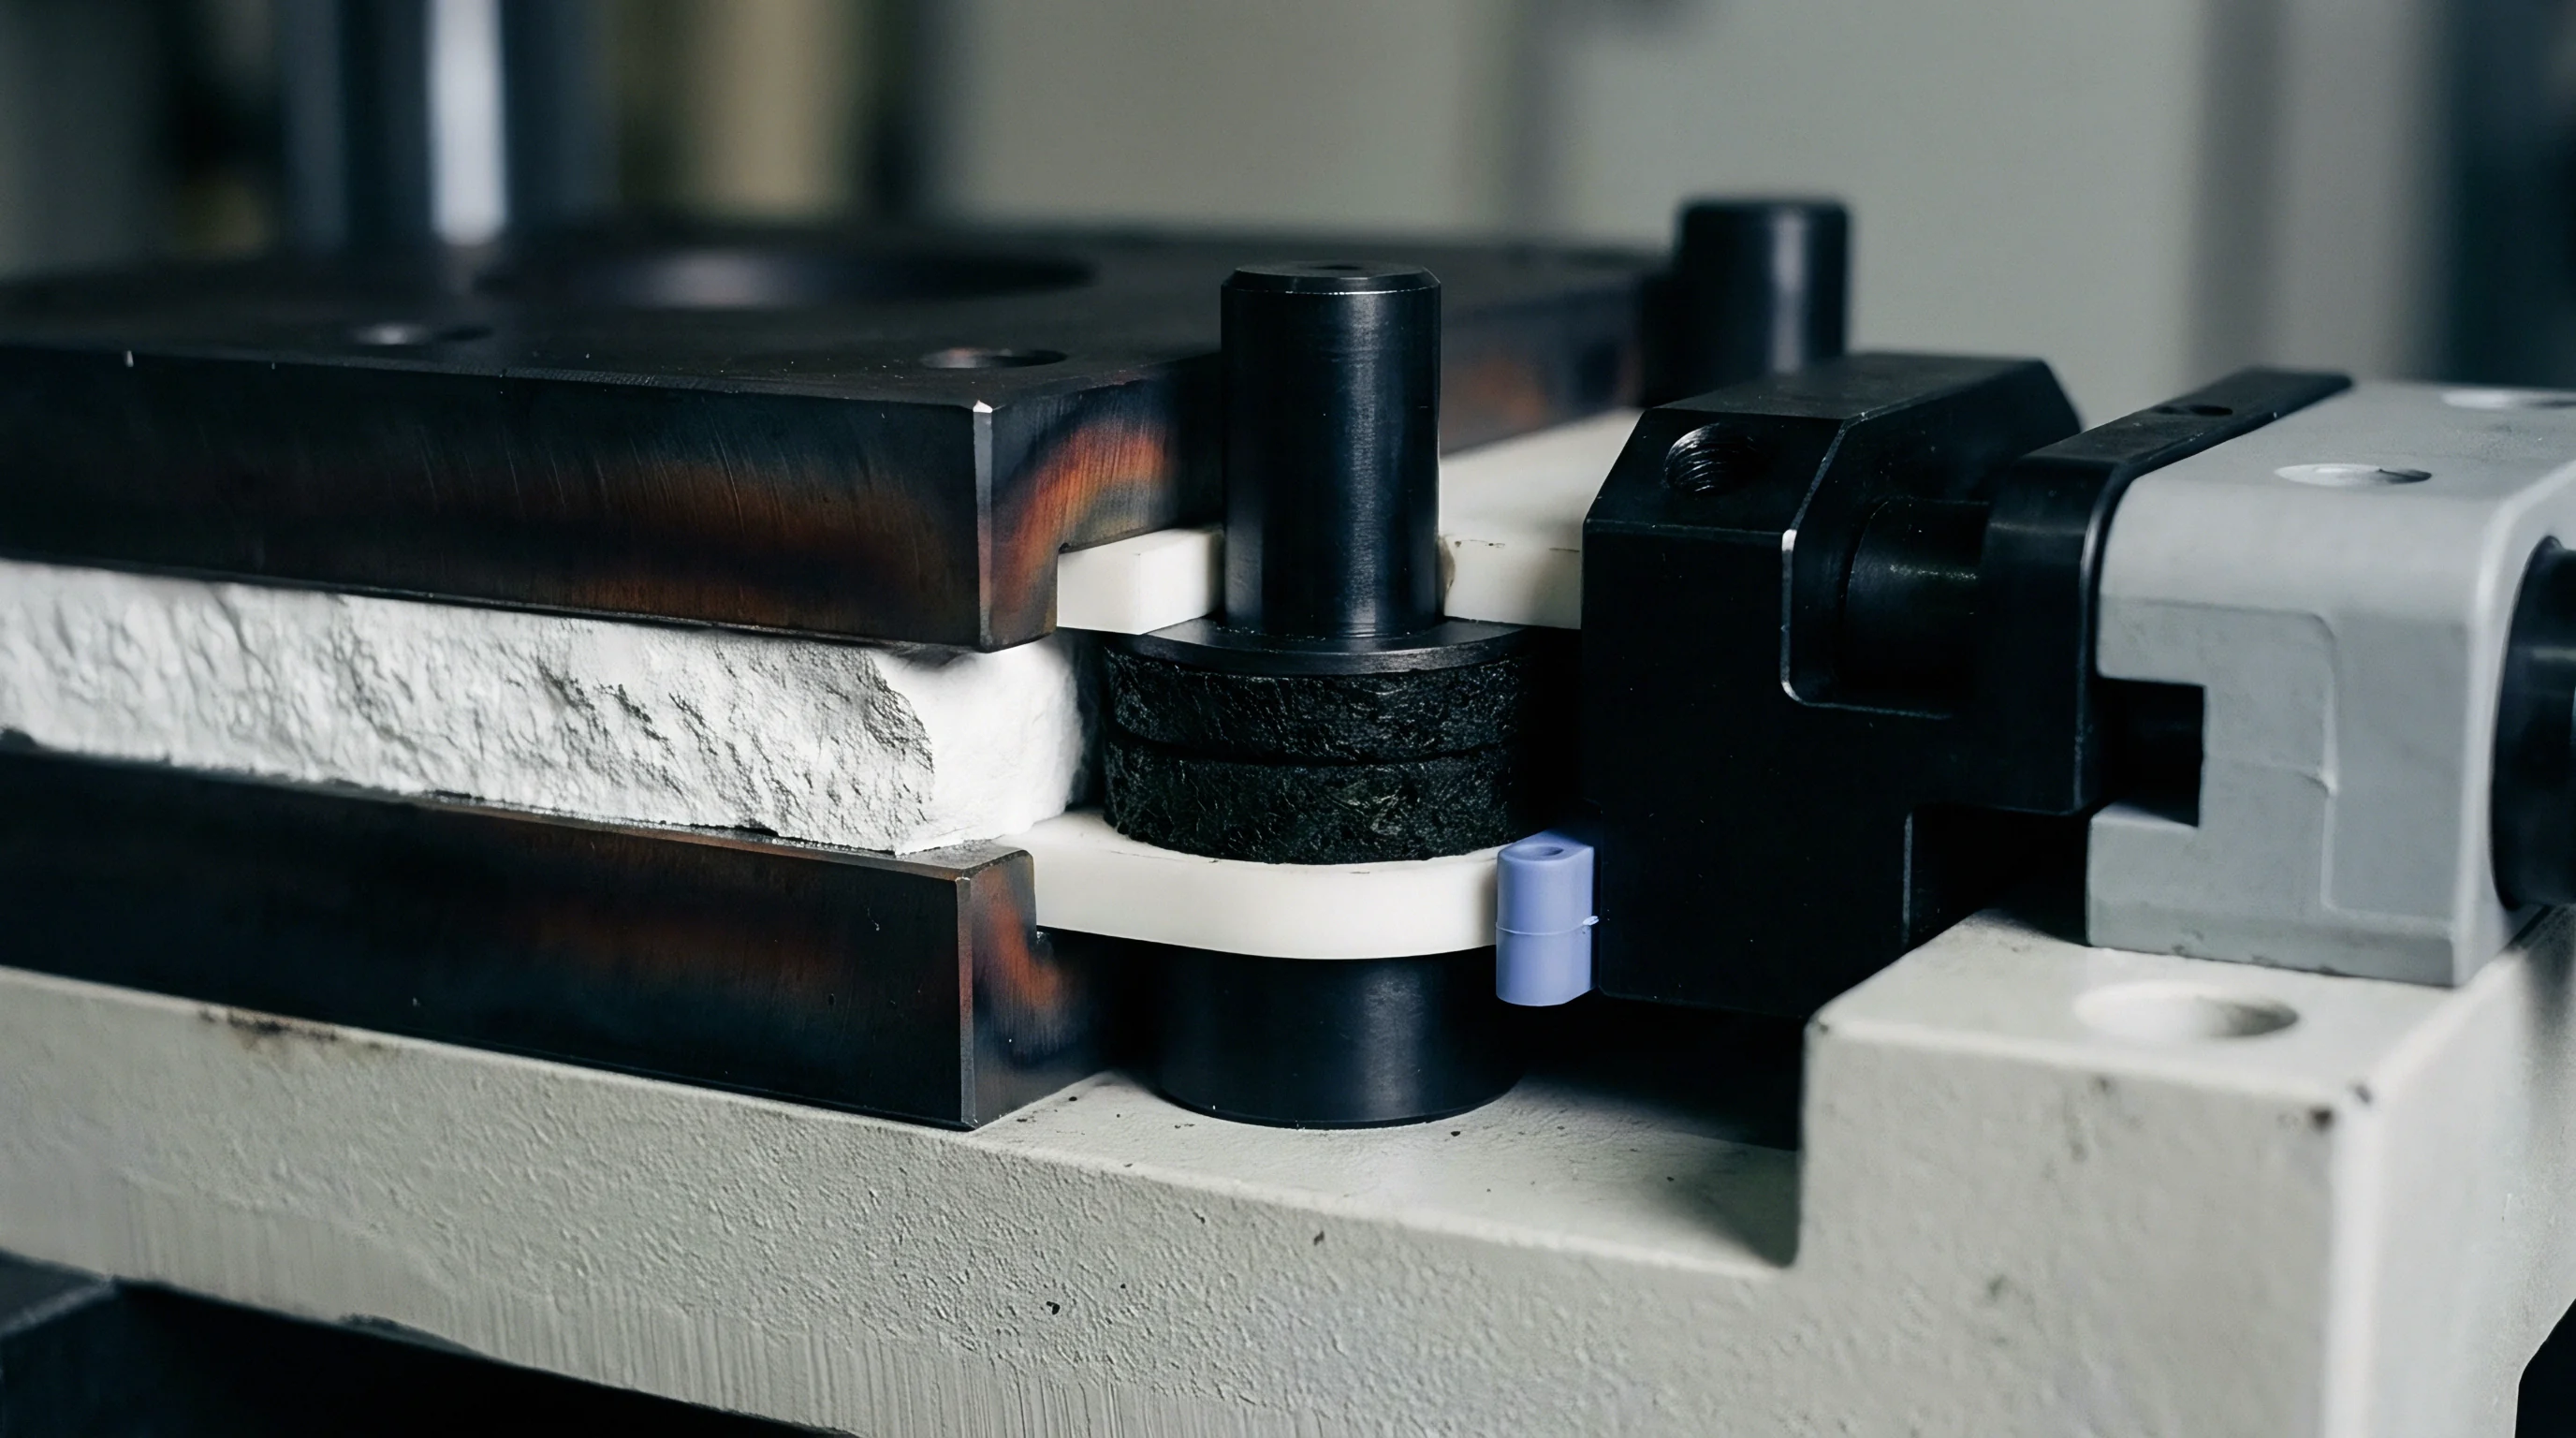
Chemical Exposure and Stress Crack Acceleration
Tensile stress fields accelerate environmental stress cracking (ESC) when short fiber thermoplastics contact chemical fluids like glycols, fuels, brake fluids, or cleaning agents. Under zero mechanical strain, engineering thermoplastics resist swelling and fluid dissolution. Under sustained tensile loads above critical thresholds (typically 0.3 to 0.6 percent strain), chemical agents penetrate voids opening at fiber termination ends.
The fluid lowers the surface energy of polymer chain segments, promoting craze propagation between adjacent glass filaments. Creep rigs evaluating automotive cooling components employ sealed fluid circulation cups mounted around the gauge section. These systems pump 50/50 water-glycol mixtures maintained at 105 degrees Celsius directly across the stressed specimen, capturing the combined interaction of hydrolysis, thermal plasticization, and mechanical stress relaxation.
Submitting parts to long-term service without mapping environmental moisture profiles produces field cracking within months of product delivery.
Decay
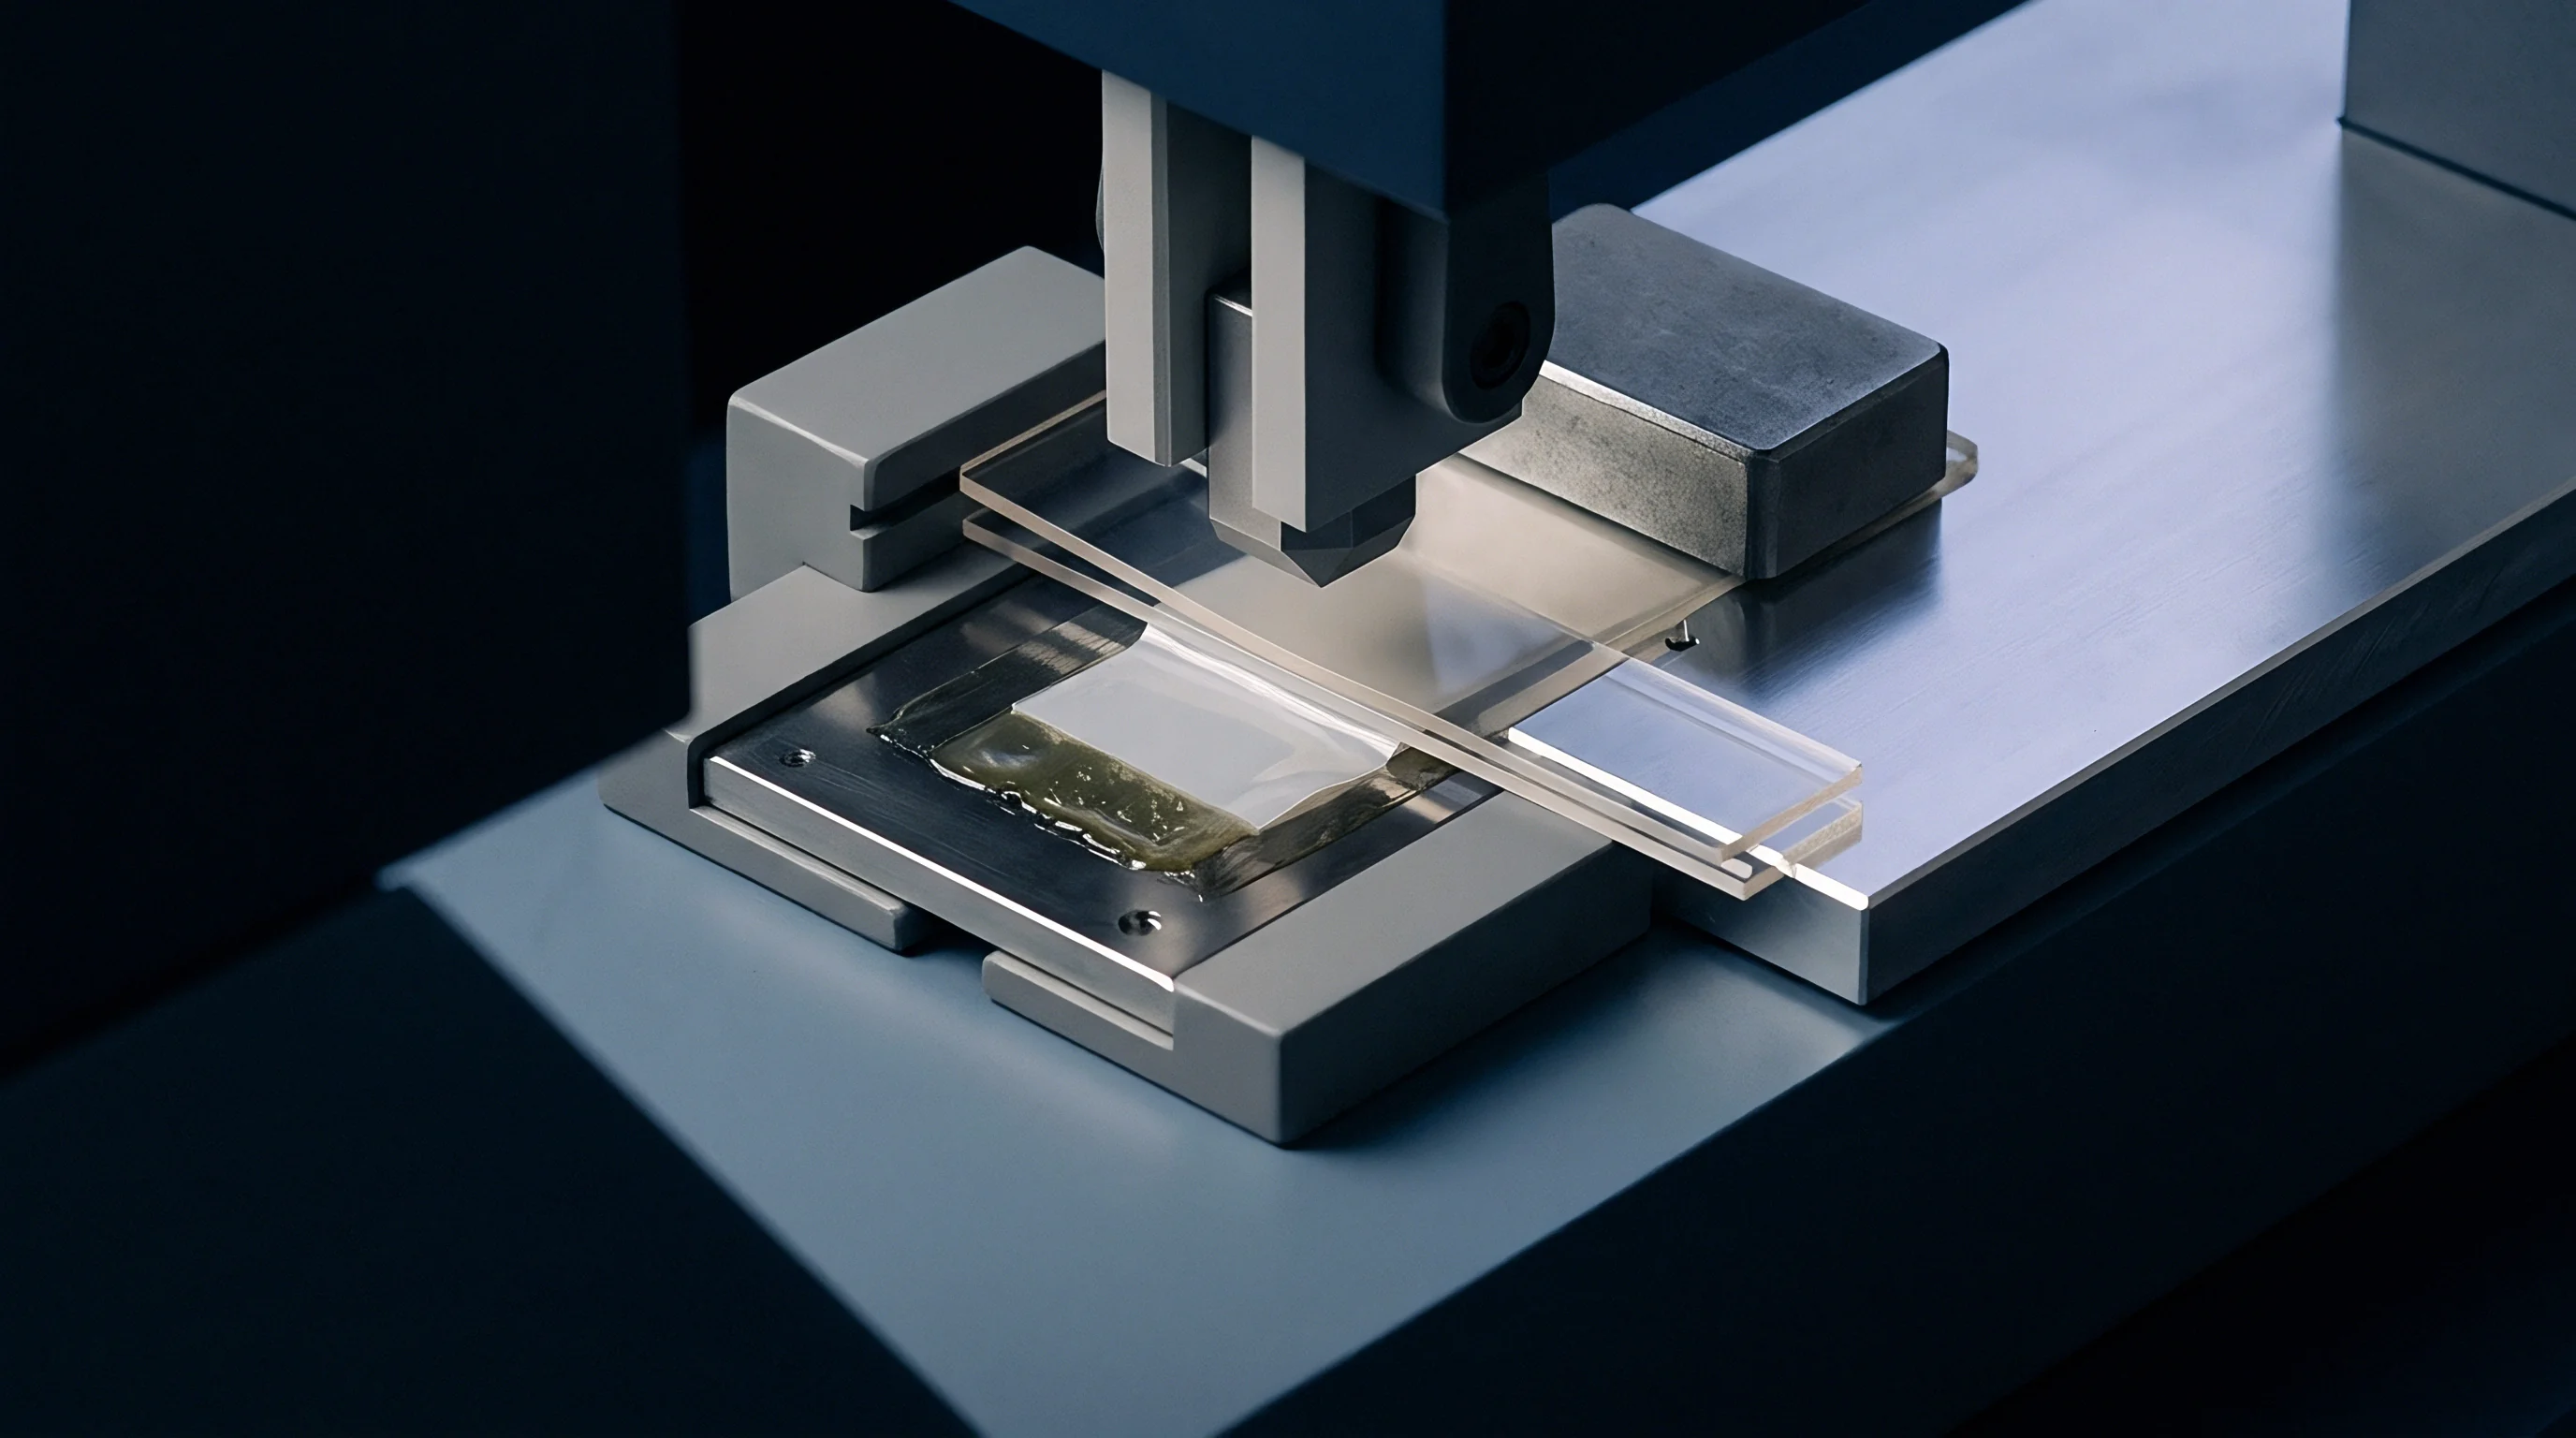
Deformation under sustained uniaxial stress traces three classical stages: primary creep, secondary creep, and tertiary creep terminating in rupture. Primary creep involves transient deceleration of strain accumulation as polymer chains disentangle, align, and pack against rigid fiber surfaces. Secondary creep represents a steady-state equilibrium where chain slippage matches internal rate-dependent resistance, establishing a linear slope on strain-versus-time plots.
Tertiary creep marks rapid strain acceleration, driven by internal cavitation, fiber-matrix interface delamination, and macro-crack coalescing that exhausts structural cross section.

Fiber Orientation Dependent Rupture Mechanisms
Failure mechanisms diverge radically based on local fiber alignment relative to the loading vector. When fibers align parallel to the tensile load, the stiff, elastic inorganic glass (modulus 72 GPa) carries the primary mechanical force through shear transfer across the fiber-matrix interface. Shear lag models demonstrate that load transfer concentrates at fiber ends.
The shear stress (tau) at the interface peaks near fiber tips, governed by fiber aspect ratio (length divided by diameter, L/D) and the shear modulus of the resin:
tau =
In this relationship, E_f and E_m designate fiber and matrix tensile moduli, sigma_m represents matrix strain, and beta denotes the shear-lag transfer coefficient derived from fiber packing volume. Breakage occurs when shear stress exceeds interfacial shear strength (IFSS), or when the matrix accumulates sufficient plastic cavitation around fiber tips to coalesce into transverse cracks. When fibers lie perpendicular to the loading direction, the load path traverses the soft polymer matrix and the vulnerable interface alone.
Interfacial debonding initiates at lower global strains (0.4 to 0.8 percent), generating planar micro-cracks that propagate around fiber circumferences and trigger brittle rupture without fiber breakage.

Weld Line Vulnerabilities under Sustained Loads
Mould cavities with multiple gates, internal shutoffs, or core pins create weld lines where advancing melt fronts meet. At a cold butt weld, short glass fibers align strictly parallel to the meeting interface, which places them 90 degrees perpendicular to the tensile flow path. No fibers bridge across the junction plane.
The local short-term tensile strength drops by 30 to 50 percent compared to homogenous flow-aligned material. Under static creep loading, this reduction worsens. Weld line interfaces lack fiber shear reinforcement, leaving bare uncrosslinked polymer resin to resist sustained loads.
Micro-voids nucleate along the interface under 20 percent of nominal material yield strength, driving tertiary creep failure at life fractions below 5 percent of parent-material expectations.
A weld line positioned perpendicular to sustained tensile loads drops creep rupture life by over 80 percent due to complete absence of reinforcing fiber bridge architecture.
Weld line mechanics dictate conservative gate positioning in structural tool designs. Shifting gate locations using overflow wells or sequential valve gating pushes weld lines into low-stress regions of the part geometry. Moulders attempting to optimize cycle times by dropping melt or mold temperatures freeze the weld line boundary before molecular diffusion occurs across the interface.
This practice yields components that pass quick first-shot dimensional inspection but rupture prematurely during sustained pressure testing.
Under ISO 899-1 section 6.3, creep rupture data must be logged on logarithmic time scales, tracking time-to-failure points across multiple stresses to identify the steep downward slope change that signals mechanical embrittlement.
Shift
Generating 10,000-hour creep data sets takes 14 months of physical testing per stress-temperature combination, delaying tooling sign-offs and production commitments. Engineers apply the Time-Temperature Superposition (TTS) principle to accelerate testing timelines, constructing master curves that project long-term compliance from short-term data gathered at elevated temperatures. TTS assumes the polymer behaves as a thermorheologically simple material, where elevated temperature compresses the time required for molecular relaxation processes without altering the underlying physical deformation mechanism.
Can Superposition Accurately Model Fiber Composites?
Applying TTS to short-fiber-reinforced thermoplastics introduces complexity absent in neat resins. Time-temperature shifting models neat matrix viscoelasticity via the Williams-Landel-Ferry (WLF) equation near Tg, or Arrhenius relationships well below and above Tg:
log(a_T) = -C1 (T – T_ref) / (C2 + (T – T_ref))
Here, a_T represents the horizontal shift factor, T_ref denotes the chosen reference temperature, and C1 and C2 serve as empirical constants calibrated to matrix free-volume expansion. Glass fibers do not accelerate their physical response with temperature. The inorganic fiber modulus remains unchanged across standard automotive operating ranges (-40 to 150 degrees Celsius).
As elevated test temperatures soften the polymer matrix, the fiber-to-matrix modulus ratio (E_f / E_m) shifts dramatically. This modulus divergence alters shear-lag stress distribution within the composite. High temperatures also activate interfacial debonding mechanisms that remain dormant at lower ambient temperatures.
Shifting raw elevated-temperature creep curves along the time axis overpredicts long-term modulus unless shift factors account for fiber volume fraction and orientation tensors.

Findley Power Law and Numerical Modeling
To capture empirical creep curves without thermodynamic assumptions, practitioners fit test data to Findley’s power law model:
epsilon(t) = epsilon_0 + epsilon_t (t / t_0)^n
In Findley’s equation, epsilon_0 represents instantaneous stress-dependent elastic strain, epsilon_t denotes a time-dependent strain coefficient, t is continuous elapsed time, t_0 serves as unit time (typically 1 hour), and n designates a material-specific stress-independent time exponent. For short glass fiber reinforced thermoplastics, exponent n falls between 0.10 and 0.25, contrasting with values above 0.35 observed in unfilled polymers. When stress levels drive n upward, the composite leaves the stable secondary regime and enters damage-driven creep.
| Material Designation | Fiber Weight Fraction | Instantaneous Strain (epsilon_0) | Creep Coefficient (epsilon_t) | Time Exponent (n) | Projected 10,000-Hour Total Strain |
|---|---|---|---|---|---|
| PA66-GF30 (Dry) | 30 percent | 0.0035 mm/mm | 0.0008 mm/mm | 0.14 | 0.0064 mm/mm |
| PA66-GF30 (Cond) | 30 percent | 0.0071 mm/mm | 0.0028 mm/mm | 0.22 | 0.0282 mm/mm |
| PBT-GF30 | 30 percent | 0.0031 mm/mm | 0.0006 mm/mm | 0.12 | 0.0049 mm/mm |
| PPS-GF40 | 40 percent | 0.0021 mm/mm | 0.0003 mm/mm | 0.09 | 0.0028 mm/mm |
| PP-GF30 (Chem Coupled) | 30 percent | 0.0048 mm/mm | 0.0019 mm/mm | 0.18 | 0.0147 mm/mm |
Finite element analysis (FEA) software ingests these Findley coefficients or Prony series expansions to predict stress relaxation and geometric distortion over years of simulated assembly life. Structural FEA meshes that omit mapped fiber orientation tensors from injection moulding simulation programs (such as Moldflow or Moldex3D) apply isotropic Findley parameters globally across the component geometry. These simplified FEA calculations underestimate deflection in areas of transverse orientation and overestimate stiffness near gating regions, invalidating downstream tool sign-offs.
Relying on accelerated test data without validating the master curve against actual 1,000-hour physical benchmarks allows unaccounted interfacial degradation to cause late field fractures.

Qualification
Procuring production tooling and securing component sign-off requires translating viscoelastic laboratory parameters into definitive contractual requirements. Sourcing agreements for critical automotive and industrial plastics frequently fail because purchase orders specify resin grade names without linking them to required tensile creep compliance thresholds under designated process conditions. A moulder shifting process parameters to trim cycle time alters the part’s long-term mechanical survival without triggering immediate non-conformance flags on basic visual or dimensional inspections.

Process Controls Affecting Fiber Architecture
Injection moulding process parameters dictate the physical fiber morphology inside the final component. The screw recovery phase can fracture delicate glass filaments. Excessive back pressure, aggressive screw rotation speeds, and undersized runner gates shear 3.0 mm chopped glass strands down to lengths below the critical load-transfer threshold (Lc), which measures approximately 0.2 to 0.4 mm for PA66.
When average fiber lengths fall below Lc, the matrix cannot transfer mechanical stress to the fiber core via shear lag, and creep compliance spikes. Tooling engineers must inspect the following five variables during initial tool qualification trials (T1 through T3):
- Gate geometry and land length must avoid narrow pin gates that generate localized shear heating and break glass fibers during cavity fill.
- Barrel temperature profile requires precise calibration to prevent unmelts that grind fibers in the transition zone, while avoiding thermal matrix degradation.
- Injection velocity profiling dictates the ratio of oriented skin to transverse core thickness across every nominal wall section.
- Cavity pressure transducer tracking verifies that peak packing pressure holds across all cavities until the gate freezes, preventing backflow that pulls fibers out of alignment.
- Regrind inclusion ratios must stay under 15 percent, as thermal reprocessing cuts fiber length distributions and accelerates secondary creep deformation.
Commercial Verification Dossier
Procurement contracts must stipulate an explicit qualification protocol before authorizing production tooling release and piece-part payment. Production parts pulled from multi-cavity tooling must undergo creep compliance verification via coupons excised directly from high-stress structural regions. The supplier qualification dossier requires:
- Isochronous stress-strain test data conducted at maximum operational temperatures for a minimum duration of 1,000 hours per ISO 899-1.
- Ash content burn-off tests conforming to ISO 3451-1 to confirm nominal fiber weight percentage within plus or minus 1.5 percent of nominal raw material specifications.
- Fiber length distribution measurements using optical matrix-burn extraction, confirming that weight-average fiber length (Lw) exceeds 0.35 mm in the finished part.
- Full-field orientation mapping across the part using micro-computed tomography (micro-CT) scanning or mapped injection fill simulations aligned to physical cross-sectional polishing.
A rigorous tool procurement contract incorporates specific language defining long-term deformation acceptance thresholds:
Total tensile strain across the primary structural axis shall not exceed 1.2 percent after 3,000 hours of continuous static exposure to 25 Megapascals at 80 degrees Celsius and 50 percent relative humidity, with test specimens excised directly from production mouldings according to ISO 20753.
Incorporating this explicit contractual clause prevents suppliers from passing off standard raw material supplier datasheets as proof of component capability, anchoring financial release directly to proven physical performance.