Predicting Tensile Creep Modulus Drop in Reinforced Structural Thermoplastics under Elevated Thermal Exposure
Predicting long-term tensile creep modulus drop requires combining ISO 899-1 creep data with time-temperature superposition and fiber orientation tensor modeling.

Kinetics
Viscoelastic Relaxation in Short Fiber Matrices
When reinforced structural thermoplastics face sustained tensile stress at elevated temperatures, the polymer backbone begins rearranging over time, transferring more of the stress burden onto the solid fibers. The tensile creep modulus ~ written as E_c(t) or E(t) ~ tracks this ratio of applied uniaxial stress to total time-dependent strain at any given moment. At room temperature, high-performance resins such as polyphthalamide (PPA), polyphenylene sulfide (PPS), and polyetheretherketone (PEEK) with 30% to 50% glass or carbon fibers deform mostly linearly under moderate stress.
But near or above the glass transition temperature (T_g), expanding free volume in the amorphous regions changes how the material responds. As polymer chains gain segmental mobility, physical aging, chain disentanglement, and local secondary bond rupture all speed up under constant load.
Stress transfer between matrix and fiber depends heavily on interfacial shear strength, carrying load along the fiber length as modeled by Cox shear-lag theory. Heat softens the matrix and lowers its shear modulus, which lengthens the critical fiber span needed for full stress transfer. In injection-moulded parts where short fibers usually have aspect ratios between 20 and 100, this matrix softening weakens load transfer.
As a result, the elastic modulus drops quickly during initial heating before settling into a pseudo-steady rate of creep strain. Predicting long-term performance means measuring this modulus decay over the component’s operational life.
The mechanisms behind this modulus drop break down into linear viscoelastic creep, non-linear creep, and thermo-oxidative degradation. At low stress, response stays linear, meaning the compliance tensor depends only on time and temperature. Non-linear creep takes over when higher stress alters molecular free volume or starts micro-cracking along the fiber-matrix interface.
Once stress pushes molecular mobility past what linear models predict, structural stiffness drops rapidly. Extended heat exposure in air also brings in chemical aging, where chain scission, cross-linking, and oxidation shift the matrix’s molecular weight distribution and permanently lower structural capacity.
Matrix shear modulus degradation at 130°C widens critical fiber load-transfer length by 42% in 50% glass-reinforced polyamide 66 after 1,000 hours under 40 MPa continuous tension.
Thermodynamic Activation and Shift Mechanics
Creep compliance follows different activation laws depending on whether the temperature is above or below T_g. Below T_g, main-chain segments are essentially frozen, leaving only side-group rotations and bond angle bending. Arrhenius models capture thermal activation in this glassy regime, using the shift factor a_T to convert temperature differences into equivalent time scales.
Here, activation energy for physical creep relaxation runs between 80 kJ/mol and 200 kJ/mol depending on polymer chemistry and moisture levels. Semi-crystalline materials like PPS and PEEK keep much of their stiffness past T_g thanks to crystalline lamellae, but relaxation in their amorphous regions still drives up long-term creep rates.
Crossing T_g changes activation kinetics fundamentally, shifting the main relaxation mechanism from local bond movements to cooperative chain segment motion. The Williams-Landel-Ferry (WLF) equation describes shift factors through this transition up to roughly 50°C above T_g. In this range, free volume grows non-linearly with temperature, lowering internal matrix friction.
When evaluating reinforced aliphatic polyamides, moisture plasticization must be factored in, as absorbed water can lower effective T_g by up to 60°C in fully conditioned parts and push the onset of non-linear creep down to lower temperatures and stresses.
Because reinforcing fibers do not creep, local stress accumulates around fiber ends inside the matrix. In fact, shear stress at these tips often exceeds bulk matrix yield strength under quite modest overall loads. Over time, localized micro-yield zones grow, leading to debonding along fibers and micro-cracking in the matrix.
This accumulated damage alters macro-scale compliance, accelerating creep strain in ways pure viscoelastic constitutive equations cannot capture without adding continuum damage terms.
| Polymer Matrix | Fiber Loading (wt%) | Dry T_g (°C) | Conditioned T_g (°C) | Glassy Activation Energy (kJ/mol) | Maximum Continuous Service Temperature (°C) |
|---|---|---|---|---|---|
| PA66 | 30% GF | 70 | 15 | 115 | 120 |
| PPA (Polyphthalamide) | 50% GF | 135 | 85 | 145 | 165 |
| PPS | 40% GF | 90 | 88 | 170 | 200 |
| PEEK | 30% CF | 143 | 142 | 210 | 250 |
| PBT | 30% GF | 55 | 45 | 95 | 130 |
Microstructural damage also competes with physical aging during extended heat exposure. Amorphous polymers quenched during moulding start in a non-equilibrium state with excess free volume. Given time at temperatures below T_g, polymer chains slowly densify toward thermodynamic equilibrium.
This densification reduces free volume and increases instantaneous stiffness, temporarily counteracting creep. Applied mechanical loading acts against this structural recovery, producing complex compliance curves that make long-term extrapolation trickier.
Finding the boundary between stable viscoelastic creep and tertiary creep rupture requires mapping behavior across stress and temperature levels. Heavy continuous loads at high temperatures produce steady creep strain until micro-voids coalesce and accelerate failure. In predictive modeling, the main hurdle is determining whether a given load remains inside the linear viscoelastic envelope across ten thousand hours of service.
Crossing that line invalidates linear superposition, leading to premature structural failures in high-temperature parts.
It remains unclear how local matrix degradation at fiber ends interacts with macro-scale thermal stress fields over twenty-year service lives.

Strain
Standardized Creep Testing Protocols under Heat
Reliable long-term modulus projections depend on precise strain measurements taken in controlled environments. ISO 899-1 sets standard protocols for tensile creep testing, specifying specimen geometries, loading methods, and sampling schedules. ISO 20753 Type 1A multipurpose bars serve as the primary geometry for injection-moulded compounds.
For elevated-temperature work, environmental chambers must hold temperatures within plus or minus 1°C across the full gauge length to prevent thermal expansion from corrupting strain data.
Displacement across the gauge section is typically measured using contact-type linear variable differential transformers (LVDTs) or optical systems. Contact extensometers can apply local clamping force that creates stress concentrations and premature failure at high temperatures. Non-contact video extensometers with digital image correlation (DIC) track printed dot patterns to measure axial and transverse strain without touching the sample.
DIC also reveals strain gradients stemming from fiber alignment variations across the specimen width, capturing localized compliance differences that single-point extensometers miss.
Tensile loads should be applied smoothly within one to five seconds, avoiding impact. Fast initial data acquisition captures the instantaneous elastic response ~ the strain at time zero ~ before switching to logarithmic sampling for extended tracking. Qualification tests usually run to 1,000 hours, though constructing full master curves often uses stepped isothermal or stepped isostress protocols to trim total test duration.
ISO 899-1 mandates environmental temperature control within plus or minus 1°C across the gauge length to prevent thermal expansion strain from skewing creep compliance data.
Stress Level Dependence and Linear Boundaries
Finding the linear viscoelastic limit takes testing across several stress levels at constant temperatures. Plotting creep compliance (total strain divided by applied stress) against logarithmic time highlights non-linear thresholds. Isochronous stress-strain curves ~ drawn by taking cross-sections of strain-time data at fixed intervals like 1 hour, 10 hours, 100 hours, and 1,000 hours ~ make this transition clear.
A linear response produces a straight line on an isochronous plot, while downward curvature indicates non-linear stiffness loss.
In practice, injection-moulded structural parts experience multiaxial stresses around ribs, bosses, and inserts. Uniaxial tensile data underpredicts actual deflections whenever transverse tension or shear acts alongside primary loads. von Mises yield criteria offer a simple initial correction, but anisotropic composites really require full tensor-based compliance models. Ultimately, fiber orientation developed during cavity filling governs local creep rates under combined heat and load.
A specimen’s thermal history strongly affects how fast strain accumulates. Processing factors like mold temperature alter matrix crystallinity, frozen-in orientation, and skin residual stress. Standard test bars moulded in cold tooling carry more amorphous material and higher surface tensile stress, accelerating early creep during high-temperature testing.
Pre-test annealing stabilizes crystallinity, separating the true viscoelastic response from processing-induced relaxation.
- Specimen Conditioning ~ Dry specimens at 80°C under vacuum for 48 hours, or equilibrate them at 23°C and 50% relative humidity per ISO 291 standards.
- Chamber Thermalization ~ Mount the specimen in grips, attach optical targets, and bring the chamber to target temperature, holding zero load for 60 minutes to reach thermal equilibrium.
- Load Application ~ Apply dead-weight or servo-hydraulic tensile load smoothly within 3 seconds, logging initial elastic deflection at 100 Hz.
- Logarithmic Data Logging ~ Record strain continuously at decaying rates ~ 100 points in the first minute, hourly readings through 24 hours, and daily points after that.
- Isochronous Mapping ~ Pull strain values at 1, 10, 100, and 1,000 hours across four stress levels to plot stress-strain curves and locate the linear viscoelastic threshold.
Environmental exposure speeds up creep through plasticization and oxidation. Polyamides in warm, humid air absorb moisture, which disrupts hydrogen bonds between polymer chains and acts as a plasticizer. Fluid contact or chemical vapors under load can also trigger environmental stress cracking.
Testing compliance in realistic operating environments is essential to avoid premature field failures.
Testing short-fiber compounds requires accounting for coupon orientation relative to melt flow. Specimens cut parallel to the flow axis show higher initial modulus and lower creep because fibers align longitudinally. Bars cut transverse to flow reflect matrix-dominated behavior, with lower stiffness, faster creep accumulation, and earlier non-linear onset.
Measuring both orientations is necessary to construct a realistic anisotropic compliance tensor.
Specimens tested within twenty degrees of matrix T_g accumulate strain so rapidly that standard linear compliance assumptions break down inside the first hundred hours.

Extrapolation
Time-Temperature Superposition and Master Curve Construction
Predicting structural creep modulus over a twenty-year design life from short-term laboratory test data relies on Time-Temperature Superposition (TTSP). TTSP assumes higher temperatures accelerate molecular relaxation by a deterministic scaling factor without altering the underlying relaxation mechanisms. Short-term creep curves recorded across several elevated temperatures are shifted horizontally along a logarithmic time axis to construct a single master curve at a reference temperature T_ref.
The horizontal shift factor a_T converts experimental time at temperature T to equivalent time at T_ref.
Building an accurate master curve requires clean compliance curves collected at 5°C to 10°C temperature intervals, with reference temperature T_ref picked inside the target operating range. Compliance curves plotted against log time are shifted by adding log(a_T) to the time axis. Because manual curve fitting is prone to error, non-linear least-squares algorithms are standard for determining a_T values across temperature steps.
Smooth, continuous overlap between adjacent shifted segments confirms horizontal TTSP validity.
If shifted curves fail to overlap smoothly, it points to vertical relaxation shifts or a change in physical deformation mechanisms. A vertical shift factor b_T adjusts compliance magnitude for thermal expansion and temperature-dependent density changes, using b_T = (rho T) / (rho_ref T_ref). Testing semi-crystalline polymers across T_g almost always requires vertical scaling because instantaneous elastic modulus drops sharply across the transition.
Skipping vertical shift corrections introduces artificial steps in the master curve, overestimating long-term stiffness.
| Test Temperature (°C) | Experimental Duration (hrs) | Log Shift Factor (log a_T) | Equivalent Service Time (hrs) | Shift Factor Model Fit |
|---|---|---|---|---|
| 40 | 100 | 1.45 | 2,818 | Arrhenius |
| 60 | 100 | 2.80 | 63,095 | Arrhenius |
| 80 | 100 | 4.10 | 1,258,925 | WLF |
| 100 | 100 | 5.25 | 17,782,794 | WLF |
| 120 | 100 | 6.15 | 141,253,754 | WLF |
Below T_g, shift factors follow Arrhenius kinetics expressed as log(a_T) = (E_a / 2.303 R) (1/T – 1/T_ref), where E_a is activation energy, R is the gas constant, and temperatures are in Kelvin. Above T_g, the WLF equation takes over: log(a_T) = -C1 (T – T_ref) / (C2 + T – T_ref), where C1 and C2 are empirical constants. Fitting WLF parameters over wide temperature spans requires precise T_g values, since minor errors in reference temperature destabilize C1 and C2 fits.
The Stepped Isothermal Method (SIM) and Stepped Isostress Method (SSM) provide faster alternatives to traditional multi-specimen testing. SIM subjects a single test bar to step-wise temperature increases under constant tensile load, with software shifting time scales to account for strain history at each step. While SIM saves significant testing time and specimen count, thermal lags during step transitions can generate strain artifacts that distort long-term predictions.
Extrapolating master curves far beyond test durations carries risk if thermal degradation sets in during service. Long exposures to elevated heat cause thermal oxidation that alters chain chemistry, degrading properties faster than physical viscoelastic superposition predicts. Standard master curves generated from short tests miss chemical aging altogether, making secondary Arrhenius oxidation corrections necessary for realistic design limits.

Empirical Power Laws and Constitutive Equations
Modeling non-linear creep mathematically relies on empirical constitutive equations fitted to test data. The Findley Power Law is widely used for structural plastics, writing total strain as epsilon(t) = epsilon_0 + m (t / t_0)^n, where epsilon_0 is initial elastic strain, m is a stress-dependent strain magnitude, and n is a stress-independent time exponent. For short-fiber thermoplastics, n usually lands between 0.15 and 0.35.
The stress dependence of m follows a hyperbolic sine relationship to capture non-linearity at elevated stresses.
Norton-Bailey models frame secondary creep rate as a power function of stress and time: d(epsilon)/dt = A sigma^b t^c. Integrating this equation yields total creep strain under constant stress. Finite element analysis (FEA) codes commonly use Norton-Bailey routines to simulate long-term stress relaxation and load redistribution.
Maintaining numerical stability in FEA solvers requires careful calibration of parameters A, b, and c over the full temperature range.
Modern viscoelastic modeling relies on Generalized Maxwell and Prony Series formulations derived from physical relaxation spectra. Here, the relaxation modulus is expressed as E(t) = E_infinity + SUM , where E_infinity represents the long-term equilibrium modulus, E_i the stiffness coefficients, and tau_i characteristic relaxation times. Prony series parameters map directly into implicit FEA solvers, allowing structural dynamic simulations to include viscoelastic damping and transient thermal creep.
Validating creep models requires checking predictions against independent, long-term test datasets. Models fitted only to 100-hour data frequently diverge when extrapolated to 10,000 hours or beyond. Physical aging is a common cause: in glassy polymers, structural densification slows creep over time, leading simple power laws to overpredict long-term strain.
Adding physical aging shift terms to constitutive equations restores long-term predictive accuracy.
Extrapolating short-term master curves without factoring in thermal oxidation risks unexpected structural failure when parts serve in hot air over long lifespans.
Morphology
Process-Induced Microstructures and Anisotropy
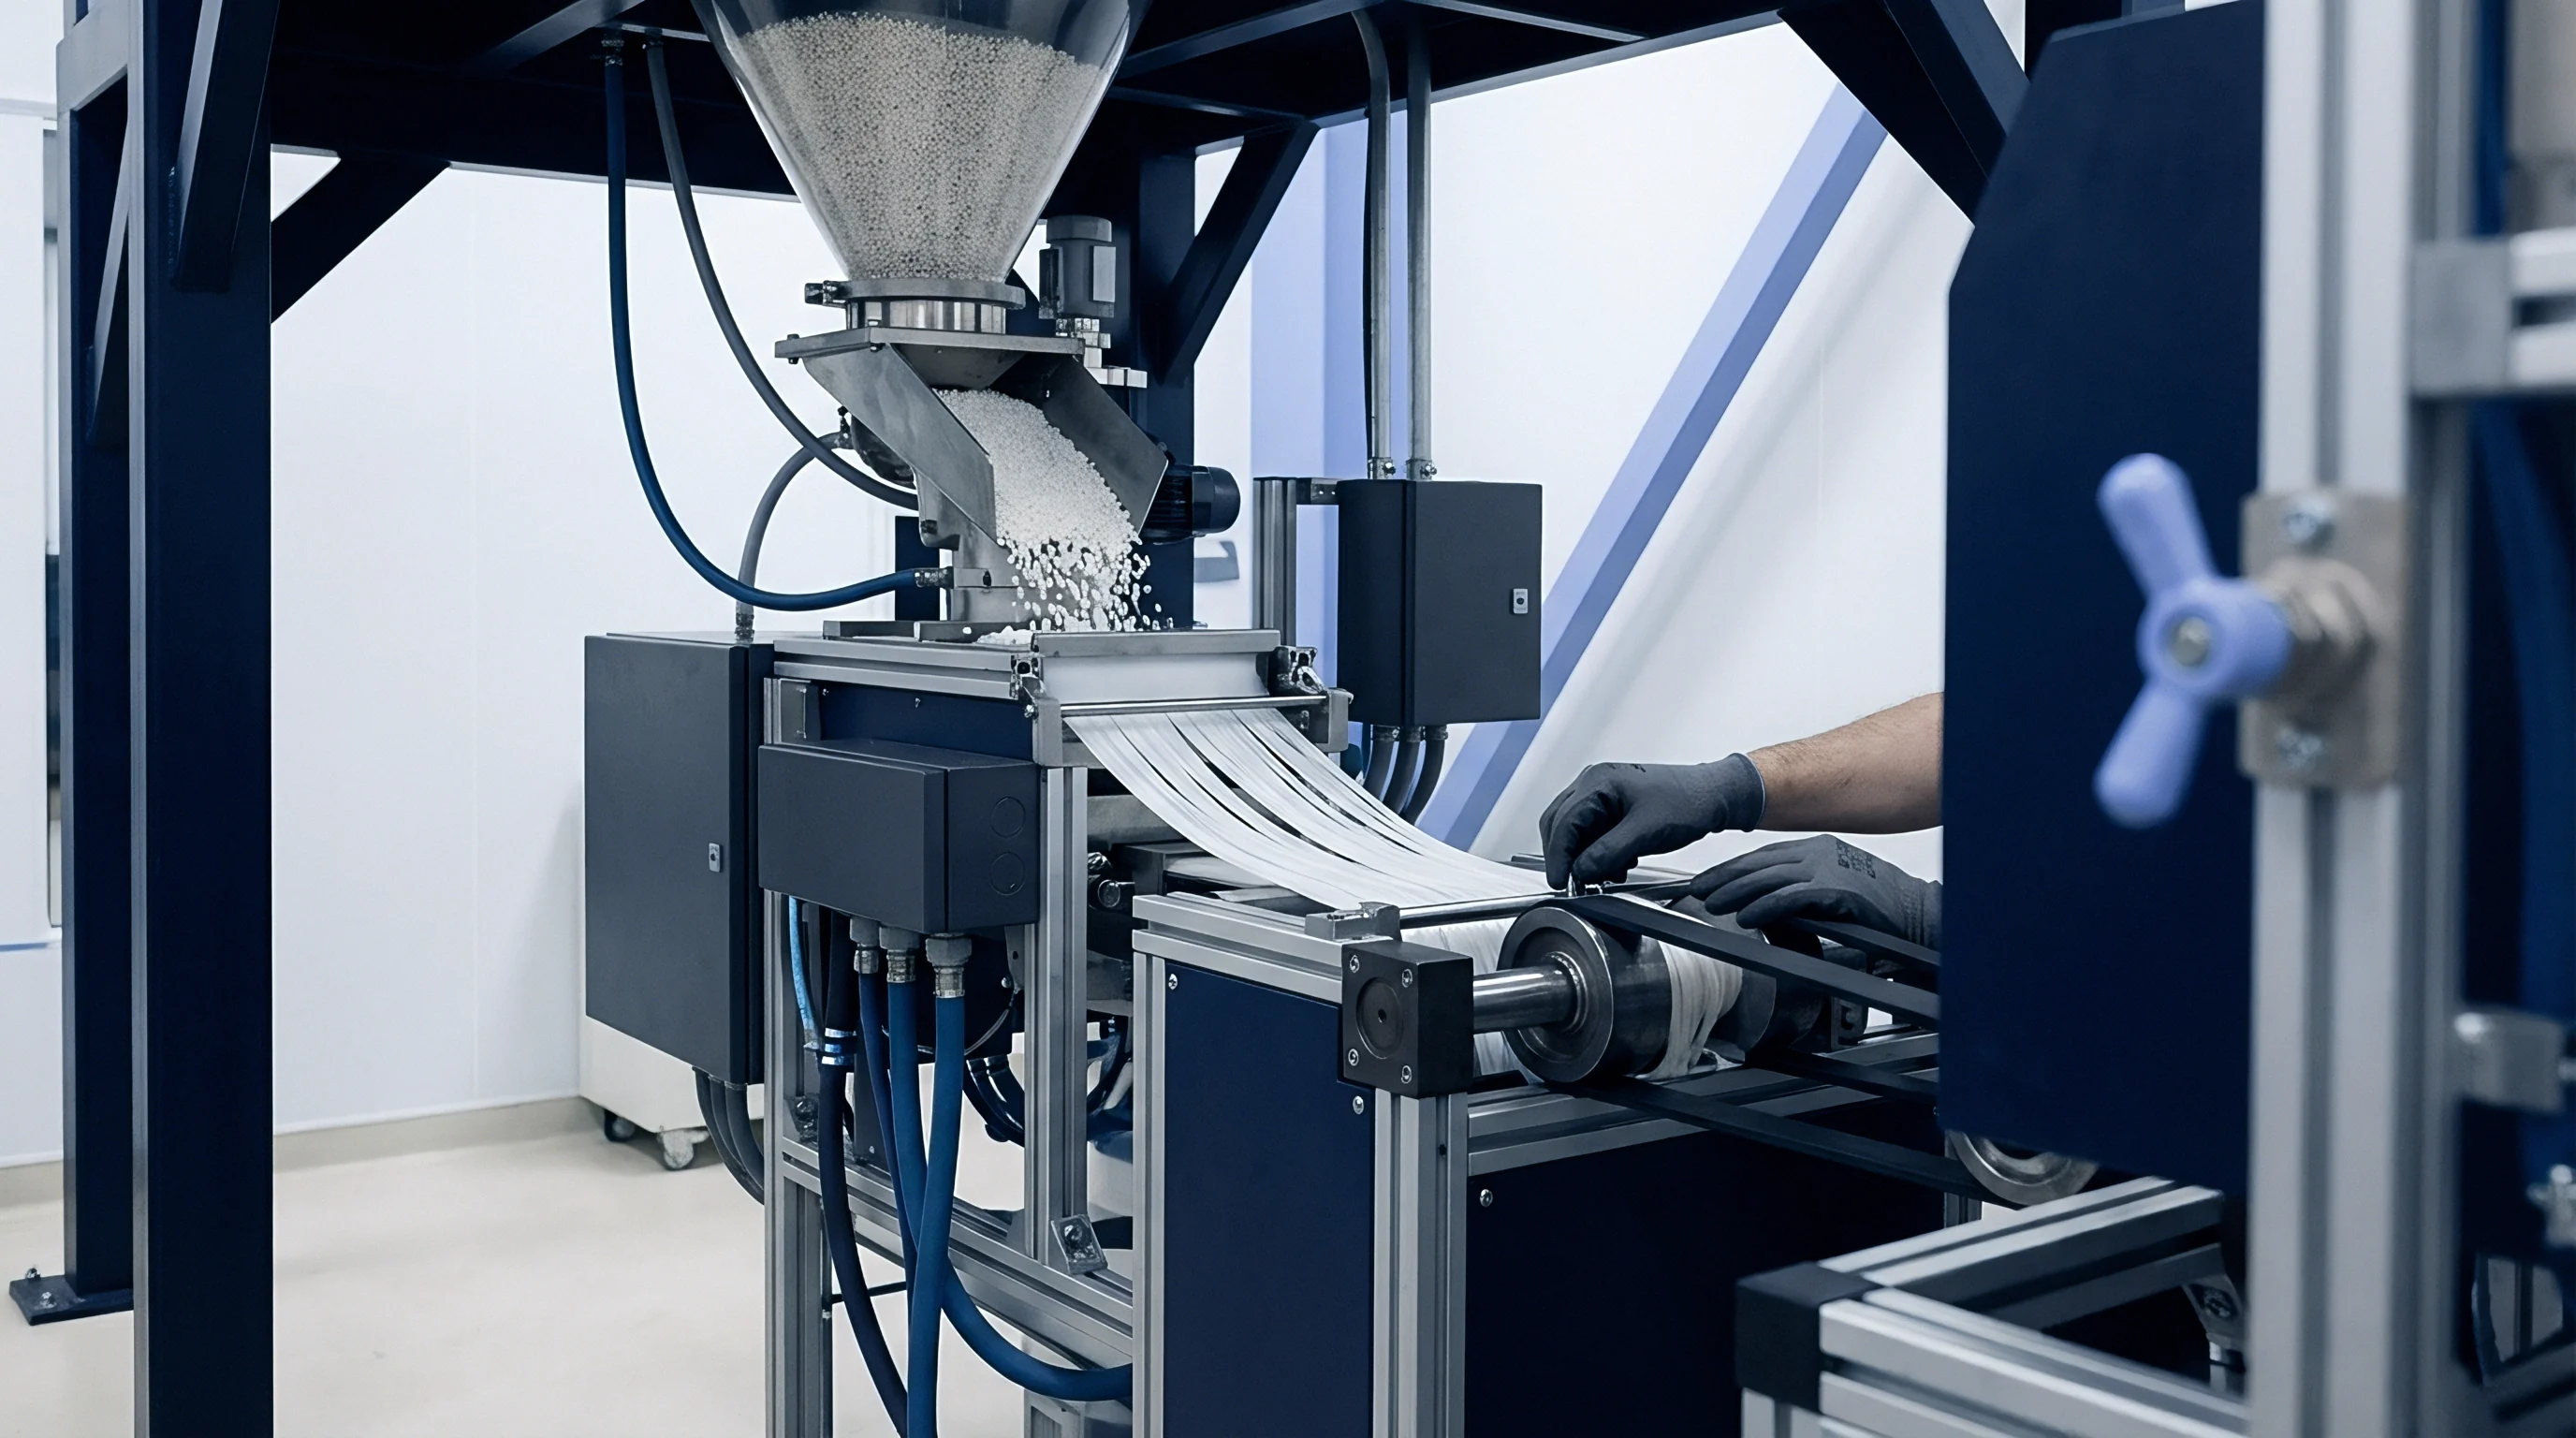
Injection moulding creates complex internal microstructures across structural components, leading to localized variations in creep resistance. Shear forces along cavity walls, thermal gradients, and flow dynamics produce a distinct shell-core-shell structure through the part thickness. The outer skin contains highly aligned fibers running parallel to the melt flow.
In contrast, the central core displays lower alignment, with fibers oriented transverse to flow or randomized by extensional flow at the melt front.
Fiber orientation patterns are quantified using Second-Order Fiber Orientation Tensors, written as A_ij. The tensor component A_11 measures alignment along the main flow axis, running from 0.33 for random 3D distribution up to 1.0 for perfect unidirectional alignment. Shear flows near mold walls typically produce A_11 values between 0.70 and 0.85 in shell layers, whereas core layers drop to between 0.20 and 0.40.
Tensile creep modulus tracks A_11 alignment along the primary load path; regions with poor fiber alignment accumulate strain faster and enter non-linear creep earlier under sustained heat.
Cooling rate variations through the thickness of semi-crystalline parts alter local matrix crystallinity. Fast cooling near tool surfaces quenches the matrix, yielding lower overall crystallinity and smaller spherulites. Because crystalline regions restrict chain slip, a lower crystalline fraction reduces the energy barrier for viscoelastic relaxation.
Thicker interior sections cool more slowly, forming higher crystalline content that improves thermal stability and creep resistance. Consequently, gate locations, wall thickness, and cooling line layouts directly govern local morphology and long-term dimensional stability.
Shell-layer fiber orientation tensors exceeding 0.75 reduce 1,000-hour creep strain by 65% compared to low-orientation core layers under identical thermal loads.

Weld Line Creep and Mold Design Controls
Weld lines formed by meeting flow fronts create clear structural weak spots under continuous thermal stress. Short fibers seldom bridge these interfaces, leaving localized zones of unreinforced resin. In addition, slight cooling of the melt front before contact reduces chain entanglement across the boundary.
Under tensile load at high temperatures, strain concentrates at weld lines, driving early non-linear creep and premature rupture well before the surrounding material fails.
Tool temperature settings govern matrix morphology, residual stress, and long-term creep response. Running cold molds shortens cycle times but locks high residual tensile stress into the skin layers. When heated in service, this molded-in stress relaxes, causing part distortion and apparent creep strain even without external loads.
Maintaining hot tooling near T_g during crystallization reduces internal stress while maximizing crystalline content for better creep resistance.
Thoughtful gate placement keeps high-creep zones away from heavily loaded features. Orienting gates to align fibers along principal tensile stress directions maximizes stiffness and creep resistance. Sequential valve gating can eliminate weld lines altogether in structural panels, keeping morphology uniform along key load paths.
Mold filling simulations paired with short-fiber orientation models predict local tensor values, supplying accurate local inputs for structural FEA.
- Fiber Alignment Audit ~ Verify that primary tensile stress vectors align within 15 degrees of primary melt flow direction in high-load regions.
- Weld Line Relocation ~ Shift flow front convergence zones away from structural fasteners, ribs, and high-temperature exposure areas using controlled gate placement.
- Mold Temperature Verification ~ Set tool surface temperatures above matrix crystallization thresholds to maximize crystalline content and minimize residual stress.
- Wall Thickness Uniformity ~ Maintain uniform wall thickness across structural sections to avoid localized cooling rate variations and differential physical aging rates.
- Secondary Annealing Assessment ~ Evaluate post-moulding heat treatment steps to stabilize matrix morphology prior to continuous high-temperature service.
Post-crystallization happens when semi-crystalline polymers operate between T_g and their melting point T_m. Continued crystal growth over time increases stiffness slightly but causes localized volumetric shrinkage. This uncontrolled crystallization creates internal stress fields that work alongside applied loads, accelerating micro-cracking at fiber interfaces and distorting dimensions over long service cycles.
Attributing long-term dimensional distortion solely to mechanical creep misses the impact of processing residual stresses relaxing during initial thermal exposure.

Derating
FEA Structural Integration and Safety Factors
Designing thermoplastic structural parts for high-temperature service requires derating short-term material properties down to allowable design stresses. Room-temperature tensile modulus values from material datasheets reveal virtually nothing about how a part behaves after thousands of hours under load and heat. Running static elastic FEA with initial room-temperature properties leads to severe under-design, as ongoing stress relaxation and localized creep redistribute internal loads.
Predictive design replaces initial elastic modulus E_0 with a time-dependent apparent creep modulus E_c(t, T, sigma) inside FEA solvers. This apparent modulus accounts for cumulative strain at a target design life, operating temperature, and stress state: E_c(t, T, sigma) = sigma / epsilon_total(t, T, sigma). Iterative FEA routines recalculate compliance tensors based on local stress until structural deflections converge.
Non-linear solvers model how peak stresses relax around bolt bosses, ribs, and press-fits while deflections grow over time.
Setting appropriate safety factors requires mapping potential failure modes across the component’s operational life. Accumulated plastic strain alters part geometry, introducing secondary bending moments or triggering buckling. Safety margins for creep-limited parts must cover real-world variations in environmental conditions, loading history, and resin lot consistency.
Traditional safety factors tied strictly to yield strength do not protect against time-dependent deformation.
| Service Life (Hours) | 23°C (Ambient) | 60°C (Below T_g) | 90°C (Above T_g) | 120°C (Near Limit) |
|---|---|---|---|---|
| Initial (Elastic) | 9.50 | 7.20 | 4.10 | 2.80 |
| 100 | 8.10 | 5.40 | 2.80 | 1.75 |
| 1,000 | 7.30 | 4.60 | 2.15 | 1.25 |
| 5,000 | 6.70 | 4.00 | 1.75 | 0.95 |
| 10,000 | 6.40 | 3.75 | 1.55 | 0.82 |
| 100,000 (Extrapolated) | 5.60 | 3.10 | 1.15 | 0.58 |
Structural failures under long-term elevated heat fall into two categories: excessive deflection and creep rupture. Deflection-limited parts reach end of life when strain exceeds working clearance limits, typically set between 1% and 2.5% strain. Creep rupture is full material fracture under continuous load, happening at stress levels far below short-term ultimate tensile strength.
Modern engineering relies on Creep Rupture Envelopes to establish maximum allowable stress limits for target operating lives.
Intermittent thermal spikes complicate cumulative damage predictions. Brief temperature peaks accelerate viscoelastic strain non-linearly. Linear cumulative damage models like Miner’s Rule tend to underpredict total strain because thermal spikes reset physical aging states and induce micro-yield damage that speeds up subsequent creep at lower temperatures.
Derating calculations should use conservative peak temperatures rather than time-weighted averages.
Failing to use orthotropic compliance matrices in FEA models can lead to underpredicting creep deflections by up to 300% where tensile loads act transverse to fiber alignment.
Under ISO 16750-3 validation standards, thermal-mechanical fatigue and creep interaction testing mandates continuous deflection tracking across complete operating thermal cycles to prevent field warranty failures.

Dossier
Material Data Audit and Verification Protocols
Selecting thermoplastics for high-temperature structural roles requires careful scrutiny of supplier technical datasheets. Datasheets routinely highlight tensile modulus values measured per ISO 527 at 23°C under quick pull rates of 1 mm/min or 5 mm/min. While these figures reflect initial short-term stiffness, they give no insight into long-term load capacity under heat.
Cutting production tooling based on short-term datasheet values risks severe field failures and costly tooling modifications.
Verifying performance requires full ISO 899-1 creep compliance datasets covering the expected temperature and stress ranges. A complete material dossier should include raw strain-time curves out to at least 1,000 hours, along with individual data points, specimen moulding parameters, moisture conditioning details, and chamber calibration logs. Master curves presented without underlying raw data or shift equations prevent independent engineering checks and should be rejected during qualification audits.
Ignoring moisture conditioning during material evaluation creates substantial risk. Suppliers often run creep tests on Dry-As-Moulded (DAM) specimens to show higher stiffness values. In real-world air, polyamide parts absorb moisture to equilibrium, depressing T_g and dropping creep modulus to a fraction of DAM ratings.
Material qualification dossiers must specify testing on specimens conditioned to equilibrium at 23°C and 50% relative humidity ~ or under humidity levels matching actual service conditions.
Audits also need to address lot-to-lot consistency and fiber content tolerances. A nominal 30% glass-reinforced resin shipped under loose specifications might arrive at 27% fiber loading, dropping initial stiffness and accelerating creep. Setting strict receiving tolerances for fiber loading via ash content testing under ISO 3451-1 protects production runs from unchecked raw material variation.
Verification should also cross-check UL 746B Relative Thermal Index (RTI) ratings against mechanical creep data. UL 746B RTI measures unstressed thermal aging to gauge long-term chemical degradation. While helpful for thermal oxidation resistance, RTI ignores stress-driven viscoelastic deformation entirely.
A resin with a high RTI rating can still experience severe creep strain within hundreds of hours under moderate continuous load. Technical dossiers must evaluate thermal aging and creep compliance as coupled mechanisms.
Production part approval for high-temperature components requires testing first-article samples produced on production tooling with actual press settings. Test bars machined from flat test plaques exhibit idealized fiber alignment that does not reflect the complex flow patterns, weld lines, and cooling rates of real components. Testing specimens cut straight from molded production parts under heat and load verifies that gate layout, tooling, and process settings deliver the long-term creep performance specified in design requirements.
Qualifying high-temperature structural thermoplastics requires tight control over incoming resin moisture, tool temperature records, and long-term creep dossiers across the entire production lifecycle.