Determining Polymer Wall Conductance on Smooth Tool Steel
Polymer wall conductance on smooth tool steel peaks above 3500 W/m²K under packing pressure and drops below 600 W/m²K upon thermal gap detachment.


Contact
Interfacial energy exchange between a liquid resin stream and a cold metal surface determines thermal energy removal during industrial moulding operations. High pressure drives liquid polymer into intimate contact with microscopic asperities on polished tool surfaces, establishing direct heat transfer pathways. When the fluid first touches the cavity wall, thermal contact resistance drops significantly, allowing heat to flow rapidly into the chilled metal substrate.
Heat flux across the mold boundary changes continuously throughout the processing sequence. In the initial filling stage, high hydrostatic pressure presses the fluid against the mirror-finish cavity, compressing microscopic trapped air pockets to negligible volumes. As the polymer freezes and contracts thermal-volumetrically, cavity pressure drops toward atmospheric levels.
This pressure reduction permits the cooling polymer shell to pull away from the metallic cavity wall, creating an insulating gaseous micro-gap that sharply throttles thermal transport.

Thermal Boundary Dynamics across Injection Phases
Peak heat flux occurs within milliseconds of cavity fill, driven by high packing pressures that enforce intimate mechanical contact between the molten fluid and the tool substrate. During this high-pressure interval, thermal contact conductance values for semi-crystalline resins routinely exceed 3500 W/m²K on highly polished tool surfaces. Once the gate freezes and packing pressure stops transmitting force into the cavity, volumetric shrinkage initiates local detachment.
Upon detachment, conductance values plummet below 600 W/m²K, turning the boundary layer into the dominant bottleneck for part cooling.
Amorphous resins like polycarbonate and ABS exhibit smoother conductance transitions than highly crystalline materials such as PBT or polypropylene. Crystalline polymers undergo sudden density jumps during crystallization, accelerating shell detachment and causing rapid conductance drops. Amorphous polymers shrink steadily along their temperature-dependent specific volume curves, maintaining moderate contact pressure for a longer portion of the cooling cycle.
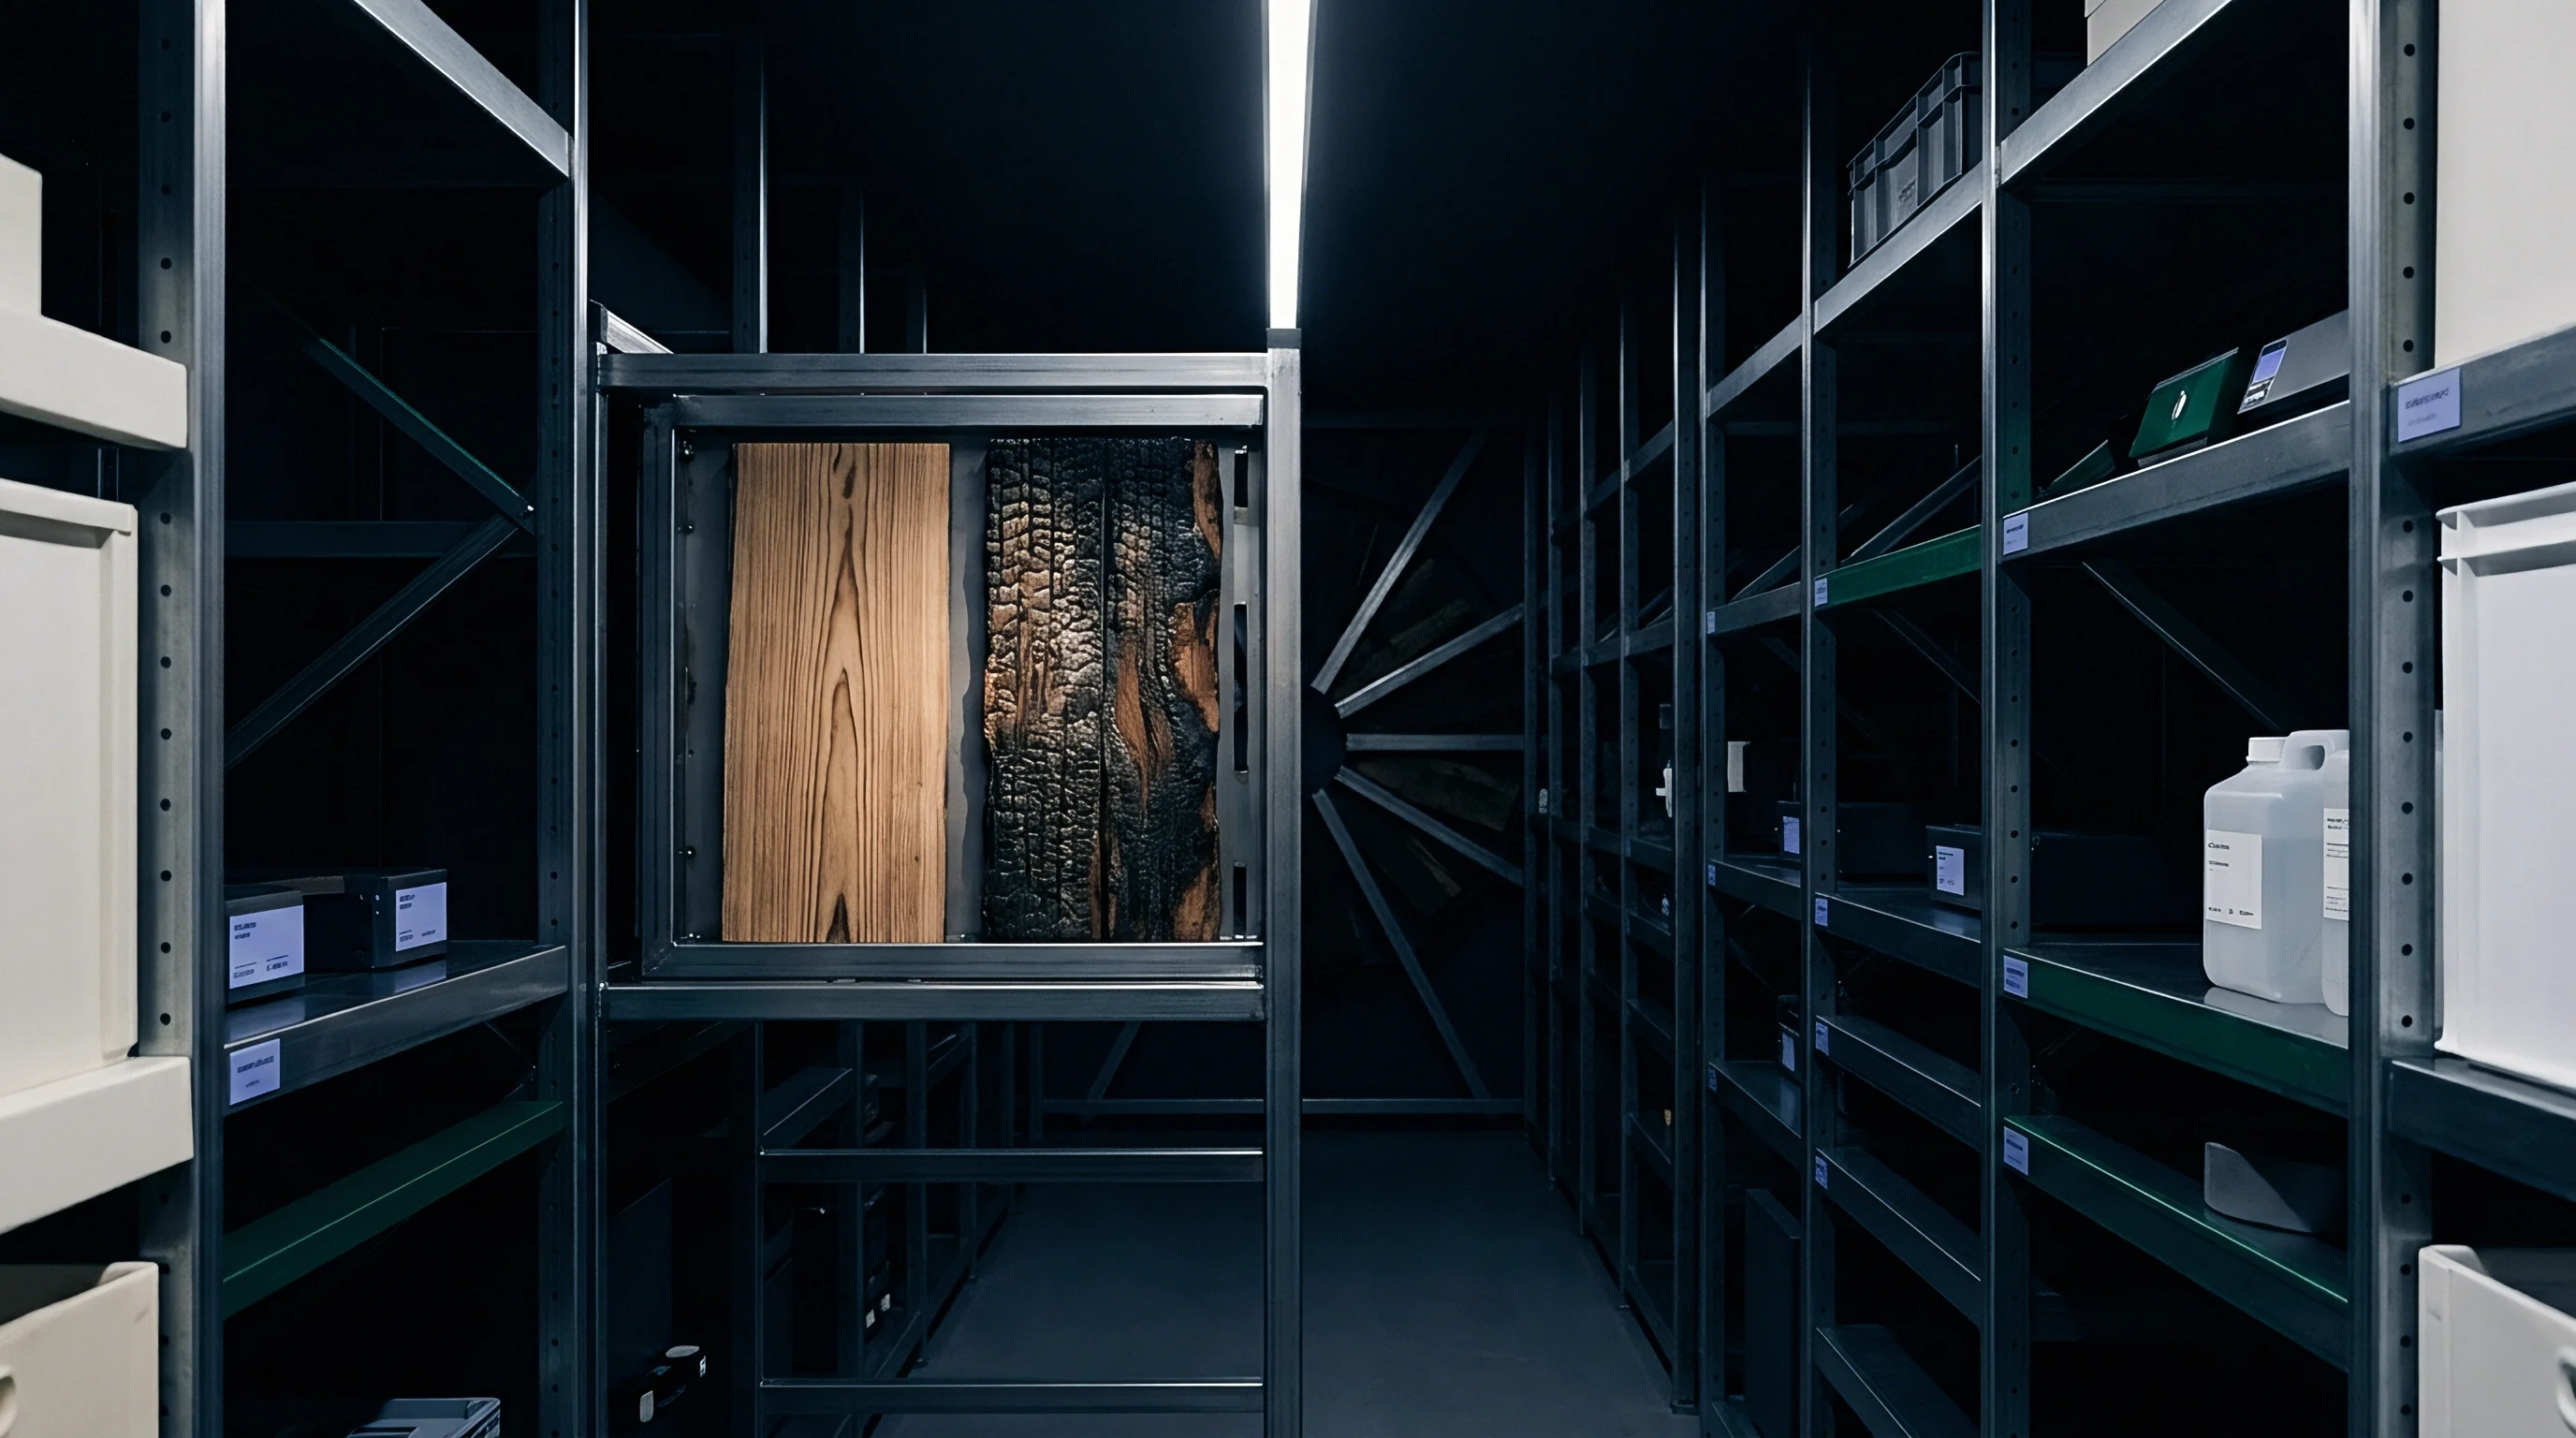
Peak thermal contact conductance between semi-crystalline polymers and diamond-polished tool steel reaches 4500 W/m²K under 80 MPa packing pressure, dropping to 400 W/m²K following thermal detachment.
Interface Pressures and Roughness Scale Effects
Surface micro-geometry on tool steel dictates the actual contact area accessible to the fluid. Optical-grade cavity finishes rated at SPI A-1 or A-2 present surface roughness values below 0.05 microns Ra, minimizing the depth of air-trapping valleys. Rougher tool finishes, such as vapor-honed or bead-blasted surfaces rated SPI C-1, retain microscopic air pockets even under peak injection pressures exceeding 100 MPa.
Increasing peak packing pressure forces soft, molten polymer chains into deeper conformity with surface micro-asperities. The resulting physical contact area approaches 90 percent of the nominal area on smooth steel, whereas rougher finishes achieve less than 60 percent contact under identical processing conditions.
| Polymer Class | Filling Phase (10-30 MPa) | Packing Phase (50-100 MPa) | Detached Phase (0 MPa) | Boundary Sensitivity |
|---|---|---|---|---|
| Semi-Crystalline (PBT, PA66) | 1800 – 2400 W/m²K | 3500 – 4800 W/m²K | 350 – 550 W/m²K | High shrinkage jump at phase change |
| High-Density Polyethylene (HDPE) | 2000 – 2600 W/m²K | 3800 – 5200 W/m²K | 400 – 650 W/m²K | Extreme thermal contraction sensitivity |
| Amorphous (PC, ABS) | 1400 – 1900 W/m²K | 2800 – 3600 W/m²K | 500 – 750 W/m²K | Gradual thermal detachment decay |
| Glass-Filled Semi-Crystalline (30% GF PBT) | 1200 – 1700 W/m²K | 2400 – 3200 W/m²K | 300 – 450 W/m²K | Fiber orientation reduces micro-conformity |
Underestimating micro-gap formation leads directly to premature part ejection, where under-cooled core material causes post-moulding warpage, severe sink marks, and dimensional rejections on the production floor.

Melt
Polymer thermal conductivity remains low in both fluid and solid states, running two orders of magnitude below that of tool steel. As a result, heat transport within an injection cavity is constrained jointly by the plastic’s internal thermal diffusivity and boundary conductance at the steel interface. When hot plastic meets cold metal, a solid layer freezes instantly against the wall, creating a steep thermal gradient through the thickness of the part.

Why Does Cavity Pressure Shift Thermal Boundary Conductance?
Hydrostatic compressive force squeezes micro-gas pockets trapped between the advancing melt front and the steel topography. Gas trapped in surface valleys acts as a thermal insulator, with thermal conductivity near 0.026 W/mK. When cavity hydraulic pressure reaches 60 MPa, these micro-pockets compress dramatically, allowing liquid polymer molecules to wet the metallic asperities directly and raising effective wall conductance.
As long as hydraulic holding pressure pushes fresh material into the cavity to offset volumetric thermal contraction, physical contact between the solidifying plastic skin and the polished cavity wall remains intact. Once the gate freezes, internal pressure bleeds off quickly, and thermal contraction pulls the outer shell away from the tool steel face.
Phase Change Dynamics and Shell Solidification
Phase change releases latent heat of crystallization at the solid-liquid transition front in semi-crystalline polymers. This heat release buffers the cooling rate, temporarily stabilizing the internal temperature profile of the frozen shell. During this period, substantial heat flux must pass across the tool wall interface to maintain steady growth of the frozen wall layer.
Assuming uniform, constant wall conductance across the entire cooling cycle undercounts required cycle time by 15 to 30 percent, producing parts that distort upon ejection from the mold cavity.
Improper modeling or miscalculation of heat transfer across the mold interface causes severe operational failure modes during volume manufacturing:
- Core Read-Through Voiding creates internal vacuum bubbles inside thick geometric intersections when outer walls detach early and insulate the hot core.
- Asymmetric Part Warpage develops when uneven wall contact between cavity and core sides causes unequal cooling rates across the wall thickness.
- Extended Cycle Deadlocks occur when presses must run at artificially long cooling times to prevent part deformation, destroying expected machine profitability.
- Surface Gloss Inconsistencies appear as matte patches on show surfaces where local thermal contact dropped prior to complete skin solidification.
A reliable cooling process maintains holding pressure long enough to prevent premature gap opening before the part skin reaches structural stability.


Bench
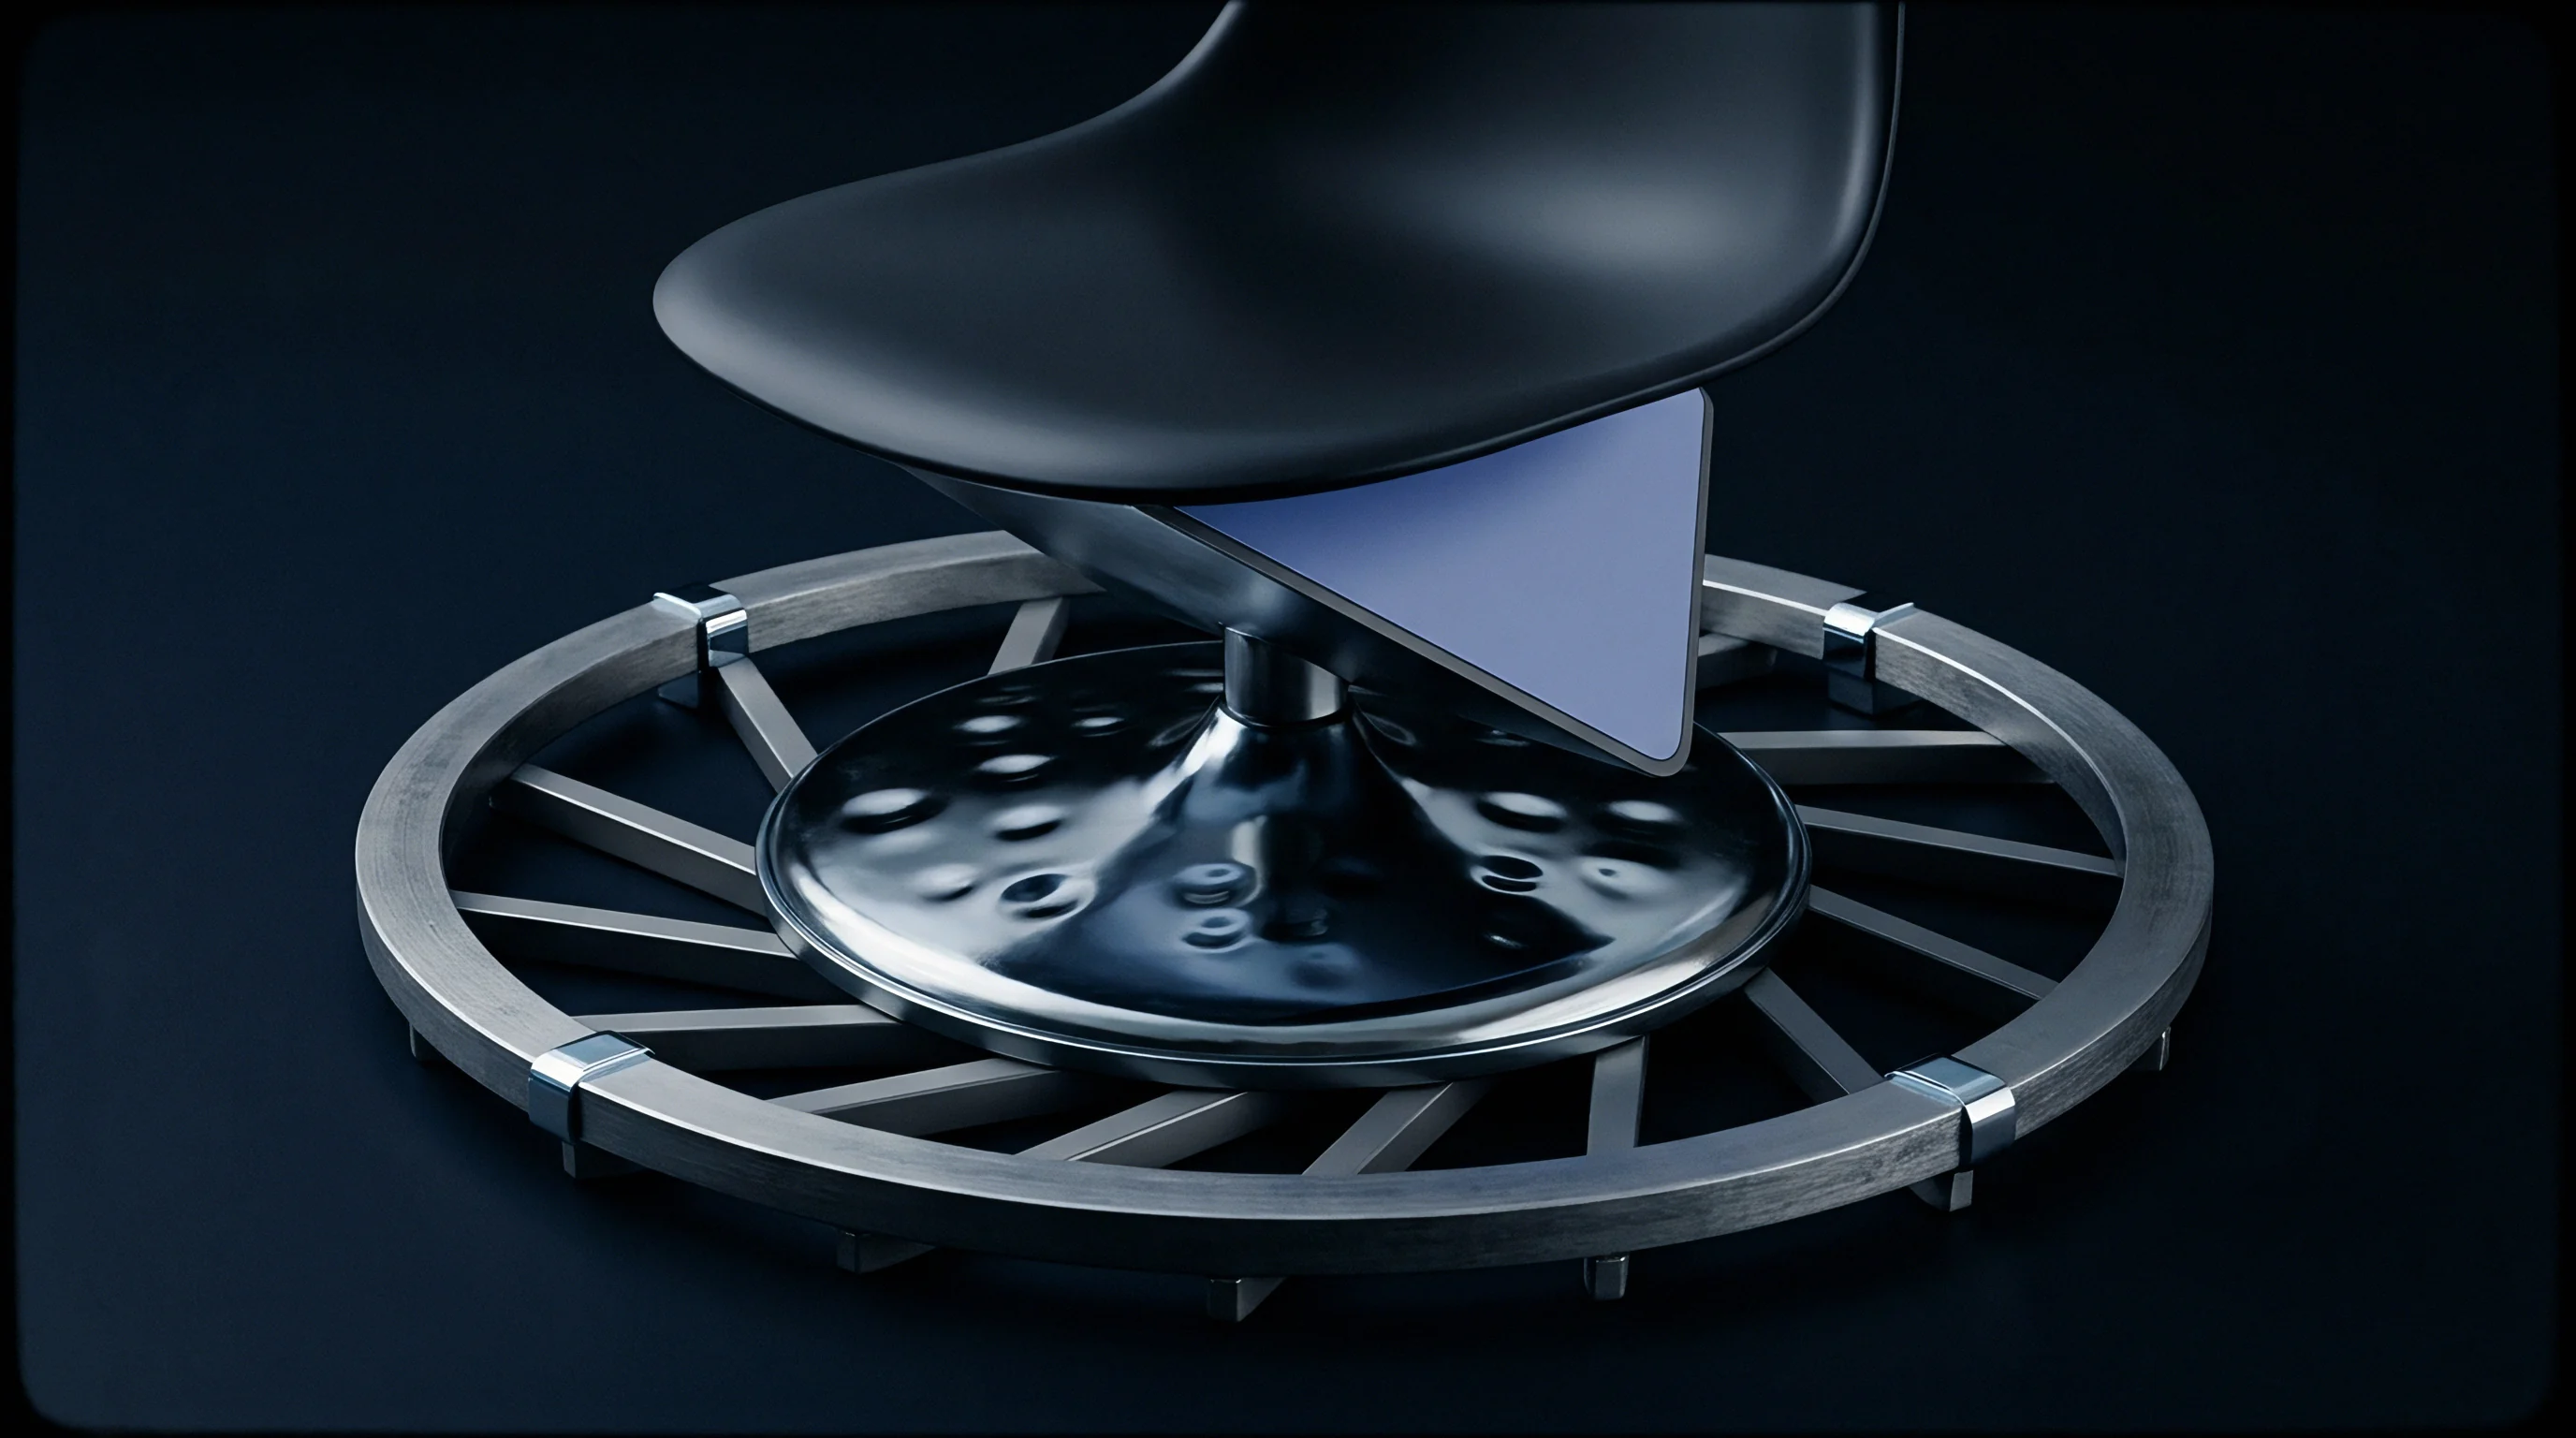
Experimental determination of thermal wall conductance relies on fast-response transient thermal instrumentation embedded flush with the tool surface. Coaxial thermocouples and thin-film heat flux sensors installed in core and cavity inserts record local thermal response at sample rates exceeding 1000 Hz. These high-speed thermal traces allow calculation of instantaneous heat transfer coefficients throughout the injection cycle.
Standard ISO 20753 test geometries instrumented with fast-response coaxial thermocouples yield transient wall heat flux data accurate to within 5 percent under industrial packing conditions.
Transient Heat Flux Sensor Instrumentation
Direct measurement requires placing a sensor tip flush with the polished tool surface without disrupting local flow geometry or thermal properties. Coaxial thermocouples feature response times under 10 microseconds, capturing the sudden thermal spike that occurs when the hot polymer front first reaches the sensor location.
Coupling cavity pressure sensors directly adjacent to heat flux sensors enables simultaneous correlation between local hydraulic decay and heat transfer decay. This combined sensor array identifies the exact timestamp of thermal detachment, marked by a sharp inflection point on the thermal flux curve.
Inverse Heat Conduction Problem Algorithms
Calculating wall heat transfer coefficients from subsurface temperature measurements requires solving the non-linear Inverse Heat Conduction Problem (IHCP). Direct temperature measurements taken 0.5 mm beneath the tool surface serve as boundary inputs for transient finite-difference thermal models of the steel mold wall.
Mathematical optimization routines minimize the residual error between measured internal steel temperatures and calculated thermal model profiles. Iterative IHCP algorithms output time-resolved wall conductance curves showing peak values during packing and step-down values following micro-gap initiation.
- Prepare Sensor Cavity machining an instrument bore using wire EDM to accept a high-speed coaxial thermocouple assembly flush with the optical steel face.
- Calibrate Subsurface Distance measuring the exact distance from the sensing junction to the polished cavity face using non-contact optical metrology to within 0.002 mm accuracy.
- Execute Baseline Dry Run thermal cycling the tool cavity with liquid heat transfer fluid without polymer injection to quantify baseline background conduction.
- Record Full Injection Cycle logging simultaneous cavity pressure, subsurface tool temperature, and hydraulic melt pressure at 1 kHz data collection rates.
- Execute IHCP Solver running regularized inverse thermal algorithms to convert transient temperature curves into time-dependent thermal conductance profiles.
Standard software thermal defaults are frequently assumed to reflect real boundary heat transfer performance without field verification, leading to unverified delays in cycle time.

Arithmetic
Quantifying interfacial heat exchange relies on Newton’s law of cooling modified for transient thermal contact resistance. Instantaneous heat flux per unit area equals the product of wall conductance and the temperature difference across the polymer-steel boundary layer.
Mathematical formulations express heat flux q” as:
q” = h_c (T_polymer_surface – T_steel_surface)
Thermal contact resistance R_tc represents the mathematical inverse of conductance h_c. In finite-element cooling simulations, h_c is implemented either as a step function linked to cavity pressure or as a continuous function of local contact pressure and gap width.
Mathematical Formulations for Variable Contact Resistance
When local cavity pressure P exceeds a critical contact threshold P_crit, conductance follows a pressure-dependent power law equation:
h_c(P) = h_min + (h_max – h_min) (P / P_peak)^n
Where h_min represents detached conductance through air, h_max represents maximum compressed contact conductance, P_peak represents maximum packing pressure, and exponent n ranges between 0.6 and 0.9 depending on surface polish level. Once local cavity pressure falls to zero and thermal contraction distance x_gap exceeds surface roughness amplitude R_z, conductance transitions to a gap conduction formula:
h_gap = k_gas / x_gap
Where k_gas represents the thermal conductivity of the entrapped mold air or evolved polymer volatiles at the local cavity wall temperature.
Worked Solidification Model for Crystalline Polymer
A worked case demonstrates the numerical impact of assuming a constant wall conductance versus a pressure-dependent variable conductance for a 3.0 mm thick PBT housing part. The material exhibits an initial melt temperature of 260 °C, a mold wall temperature of 60 °C, a crystallization temperature of 200 °C, and an ejection temperature of 130 °C. Steel substrate is H13 tool steel with thermal conductivity of 28.6 W/mK.
Under a constant conductance assumption of h_c = 2500 W/m²K, mathematical solution of the 1D transient heat conduction equation predicts a required cooling time of 11.2 seconds to reach ejection criteria across the centerline thickness. Incorporating a variable conductance model where h_c starts at 3800 W/m²K during packing (0 to 4 seconds) and drops to 450 W/m²K post-detachment (4 to 15 seconds) yields a true required cooling time of 15.8 seconds.
| Boundary Conductance Model | Predicted Cooling Time | Peak Steel Face Temp | Centerline Temp at 11s | Predicted Volumetric Shrinkage |
|---|---|---|---|---|
| Constant High Conductance (3000 W/m²K) | 10.4 s | 84.2 °C | 122.5 °C | 1.82 % |
| Constant Moderate Conductance (1500 W/m²K) | 12.8 s | 76.1 °C | 141.0 °C | 1.95 % |
| Variable Pressure-Dependent Model (h_c(P)) | 15.8 s | 91.5 °C | 158.4 °C | 2.34 % |
| Measured Tool Trial Verification Data | 16.1 s | 93.0 °C | 161.2 °C | 2.38 % |
Applying the variable pressure-dependent model shifts predicted centerline thermal profiles significantly, matching physical temperature measurements taken during tool trial ejections with high numerical precision.

Steel
Metal substrate selection dictates the thermal diffuser performance behind the contact surface. Tool steels with high thermal conductivity extract heat rapidly from the boundary layer, preventing local surface overheating and maintaining a higher temperature gradient across the polymer interface.
Selecting copper-beryllium or high-conductivity copper alloys over standard stainless tool steel increases effective boundary heat removal by up to 40 percent during high-pressure packing phases.

Substrate Thermal Diffusivity across Tool Alloys
Diffusivity measures how fast thermal energy moves through the tool body relative to its volumetric heat capacity. Pre-hardened P20 tool steel (1.2738) offers a thermal conductivity around 29 W/mK, whereas corrosion-resistant 420 stainless steel (1.2083) delivers only 19 W/mK. Premium copper-nickel-silicon alloys (Ampcoloy) achieve thermal conductivities exceeding 120 W/mK, accelerating boundary thermal removal during early cycle phases.
Higher tool substrate conductivity lowers cavity skin temperatures during peak injection, preserving a wider temperature difference between the core plastic and the tool face. This lowered skin temperature speeds up frozen layer growth, allowing earlier part ejection without structural sagging.

Polished Surface Quality Metrics under SPI Guidelines
Surface roughness ratings defined by the Society of the Plastics Industry (SPI) govern cavity mirror finishes. SPI A-1 finishes achieved with fine diamond paste generate surface roughness levels between 0.012 and 0.025 microns Ra. SPI A-3 finishes produced with 15-micron diamond compound yield 0.05 to 0.10 microns Ra.
Microscopic asperities on SPI A-3 steel finishes create microscopic valleys that retain insulating air pockets under moderate cavity pressures. Optical SPI A-1 finishes remove these microscopic air reservoirs, allowing resin to wet the surface directly and increasing baseline wall conductance during the fill phase.
Procurement documents and tooling purchase agreements define thermal qualification standards through explicit specification clauses:
- Cavity Surface Finish Specification mandates SPI A-1 mirror polish using diamond compound on all primary thermal transfer surfaces prior to tool sign-off.
- Steel Grade Certification Clause requires material test reports confirming thermal conductivity exceeds 28 W/mK for core inserts and core pins.
- Cooling Circuit Flow Requirement mandates turbulent cooling flow conditions with a Reynolds number exceeding 10,000 in all internal tool cooling channels.
- Tool Qualification Protocol Line conditions final tool acceptance on holding target cycle times without exceeding a maximum peak cavity surface thermal rise of 15 °C.
According to standard ISO 16012 tooling documentation rules, supplier failure to deliver specified surface finish roughness metrics nullifies cycle time warranties carried in primary manufacturing agreements.

Outlay
Cooling duration accounts for 60 to 70 percent of total injection moulding cycle time in thick-walled structural components. Capital return on injection tooling depends directly on minimizing total cycle seconds to maximize annual unit throughput on press assets.
Cycle Time Impact on Moulding Production Costs
A cycle time extension of 4 seconds on a 30-second moulding job increases hourly machine-hour cost allocations by 13.3 percent. On a multi-cavity tool running two million units annually, a 4-second delay translates into hundreds of additional production hours, consuming machine capacity and inflating per-part landed cost.
Accurate prediction of polymer-wall heat conductance allows tool designers to place conformal cooling channels precisely where boundary heat flux concentrated. Properly targeted thermal management suppresses peak surface temperatures, maintaining maximum contact conductance for a longer duration and trimming critical seconds off the cooling phase.

Tooling Specification Clauses for Thermal Qualification
Tooling quotes built on optimistic default boundary conductance figures understate required press clamping tonnage and cooling requirements. When tools arrive press-side, operators must extend cooling times to prevent part warpage, causing financial disputes between tooling buyers and contract moulders regarding quoted unit pricing.
Uncertainty surrounding real-time micro-gap opening dynamics under varying press pack-and-hold profiles leaves open the question of whether active cavity pressure modulation can extend maximum thermal contact long enough to eliminate custom metal substrate alloys in high-volume tools.