Injection Molding Flow Induced Strain Prediction in Stepped Geometries
Abrupt wall thickness transitions double flow-induced molecular orientation; mitigating residual strain demands tapered transitions, viscoelastic flow profiling, and generous fillets.
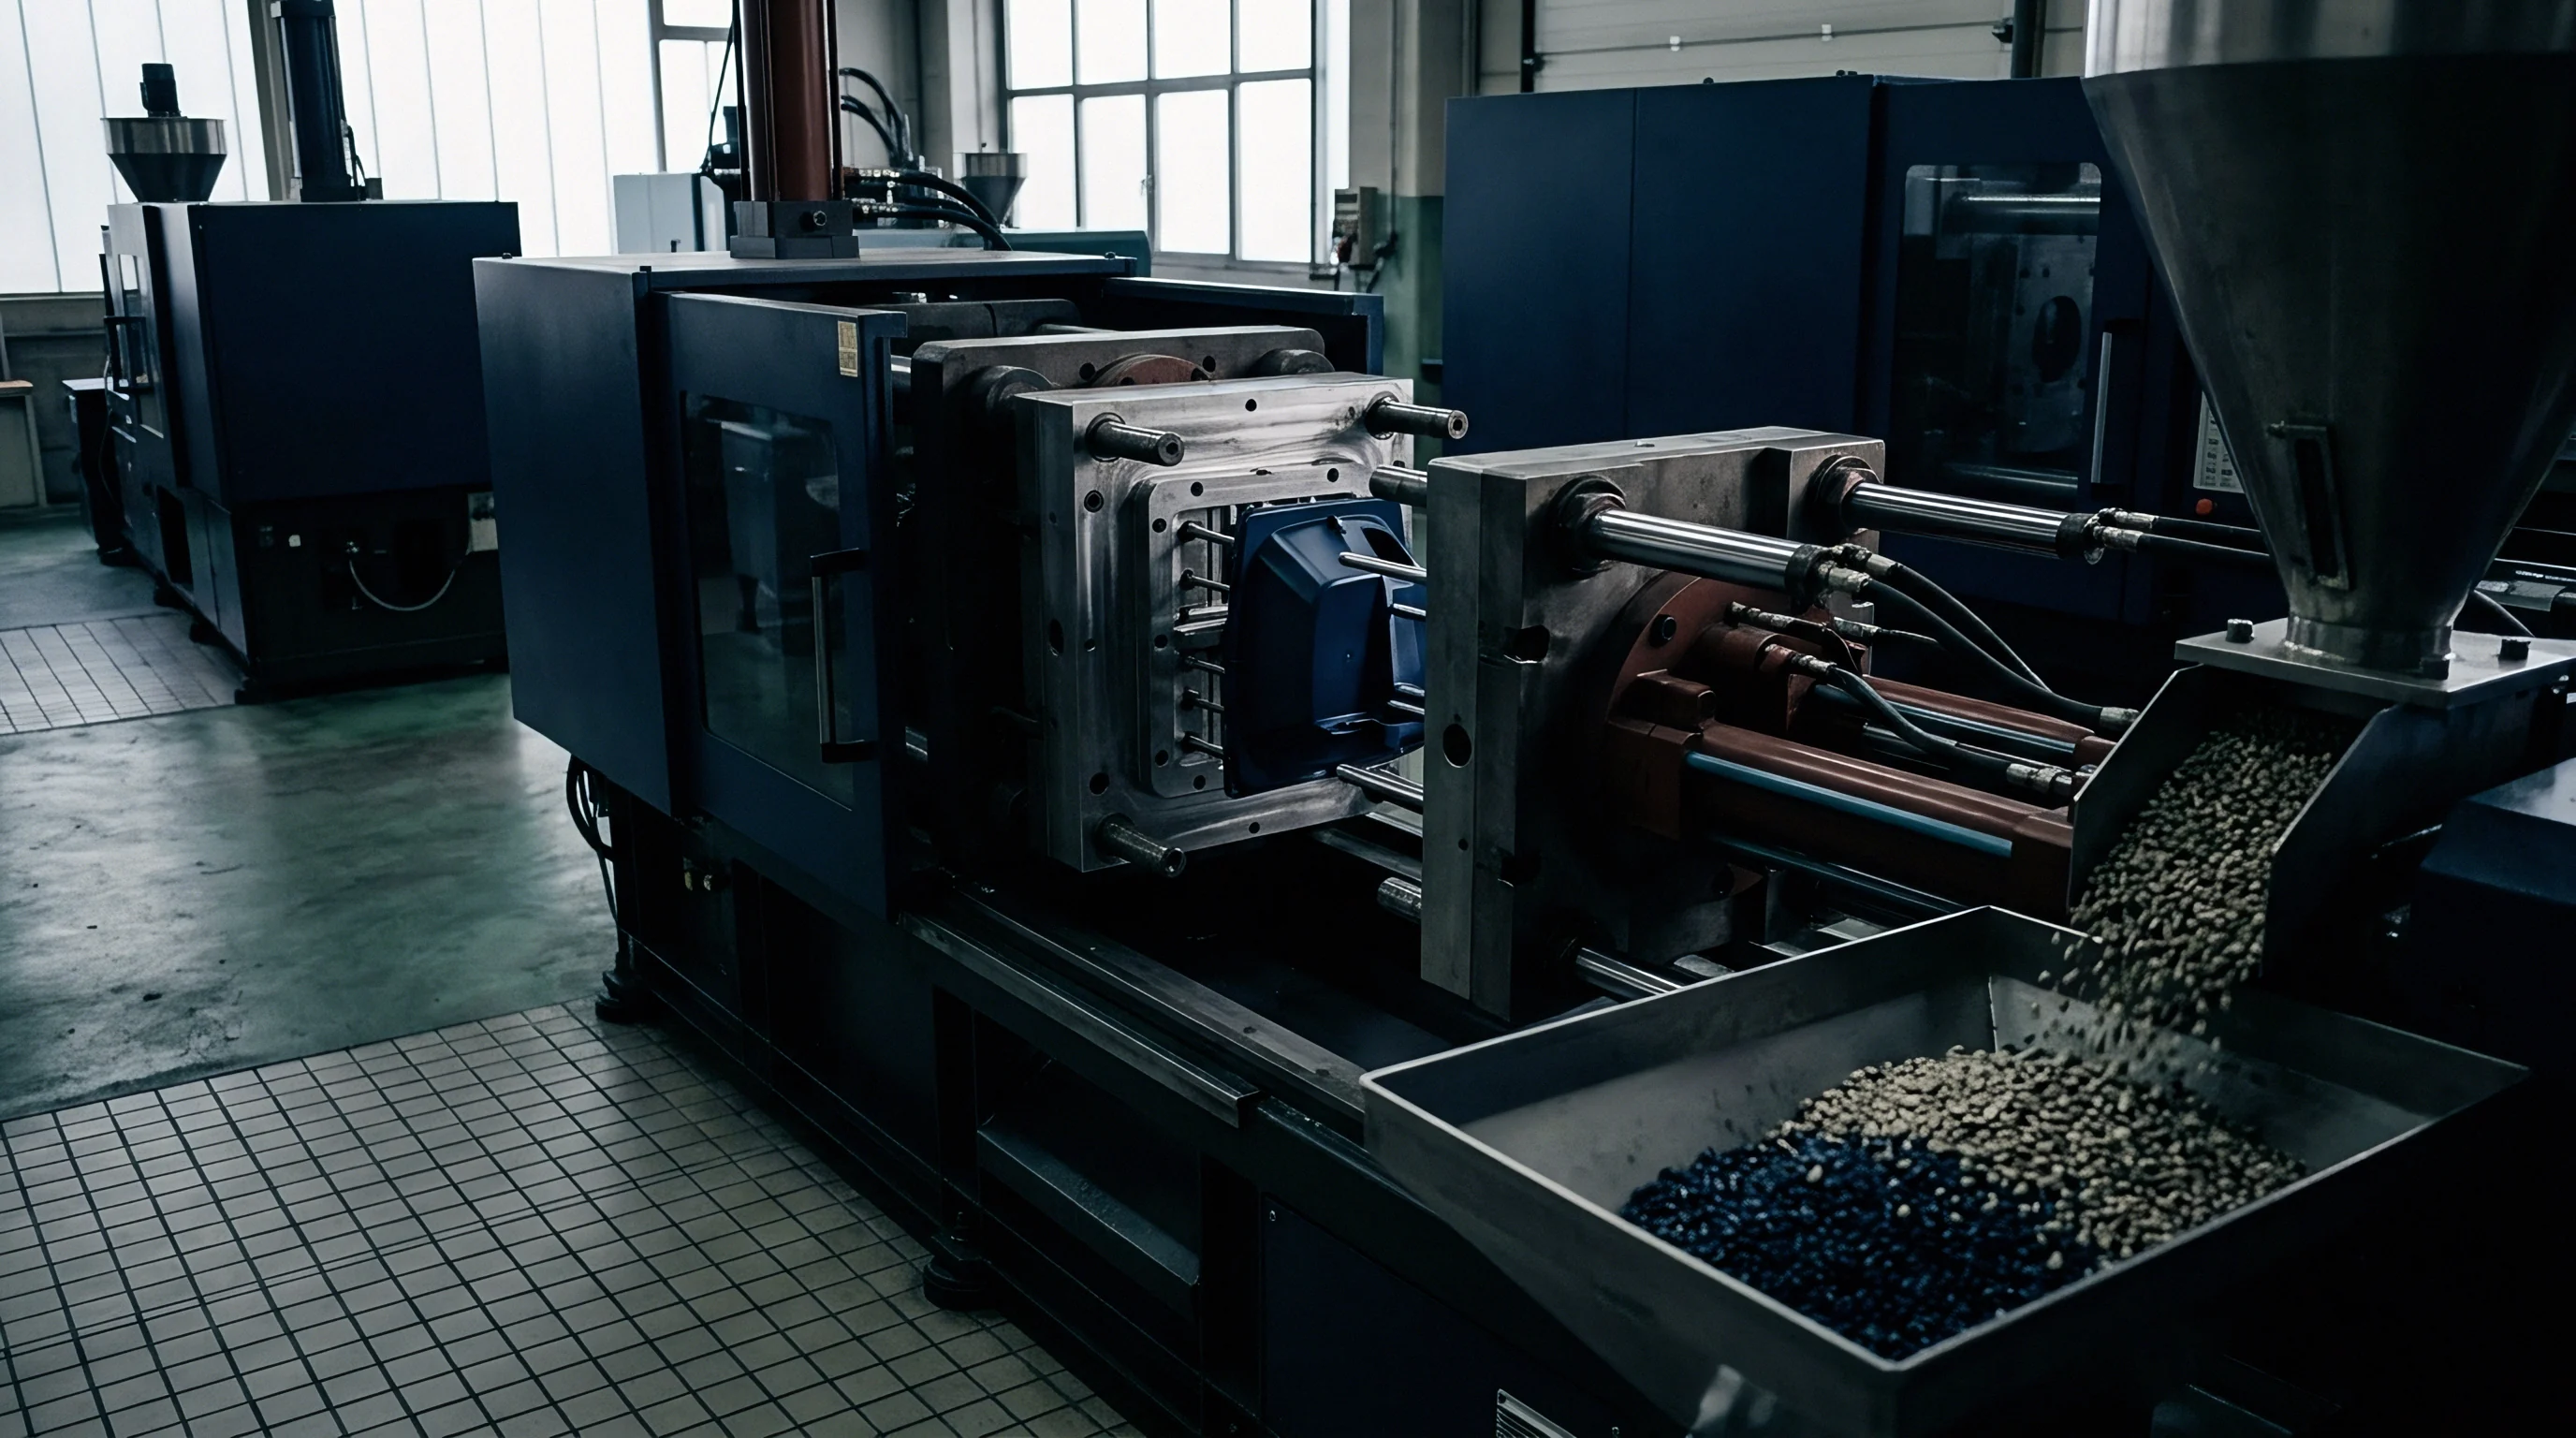
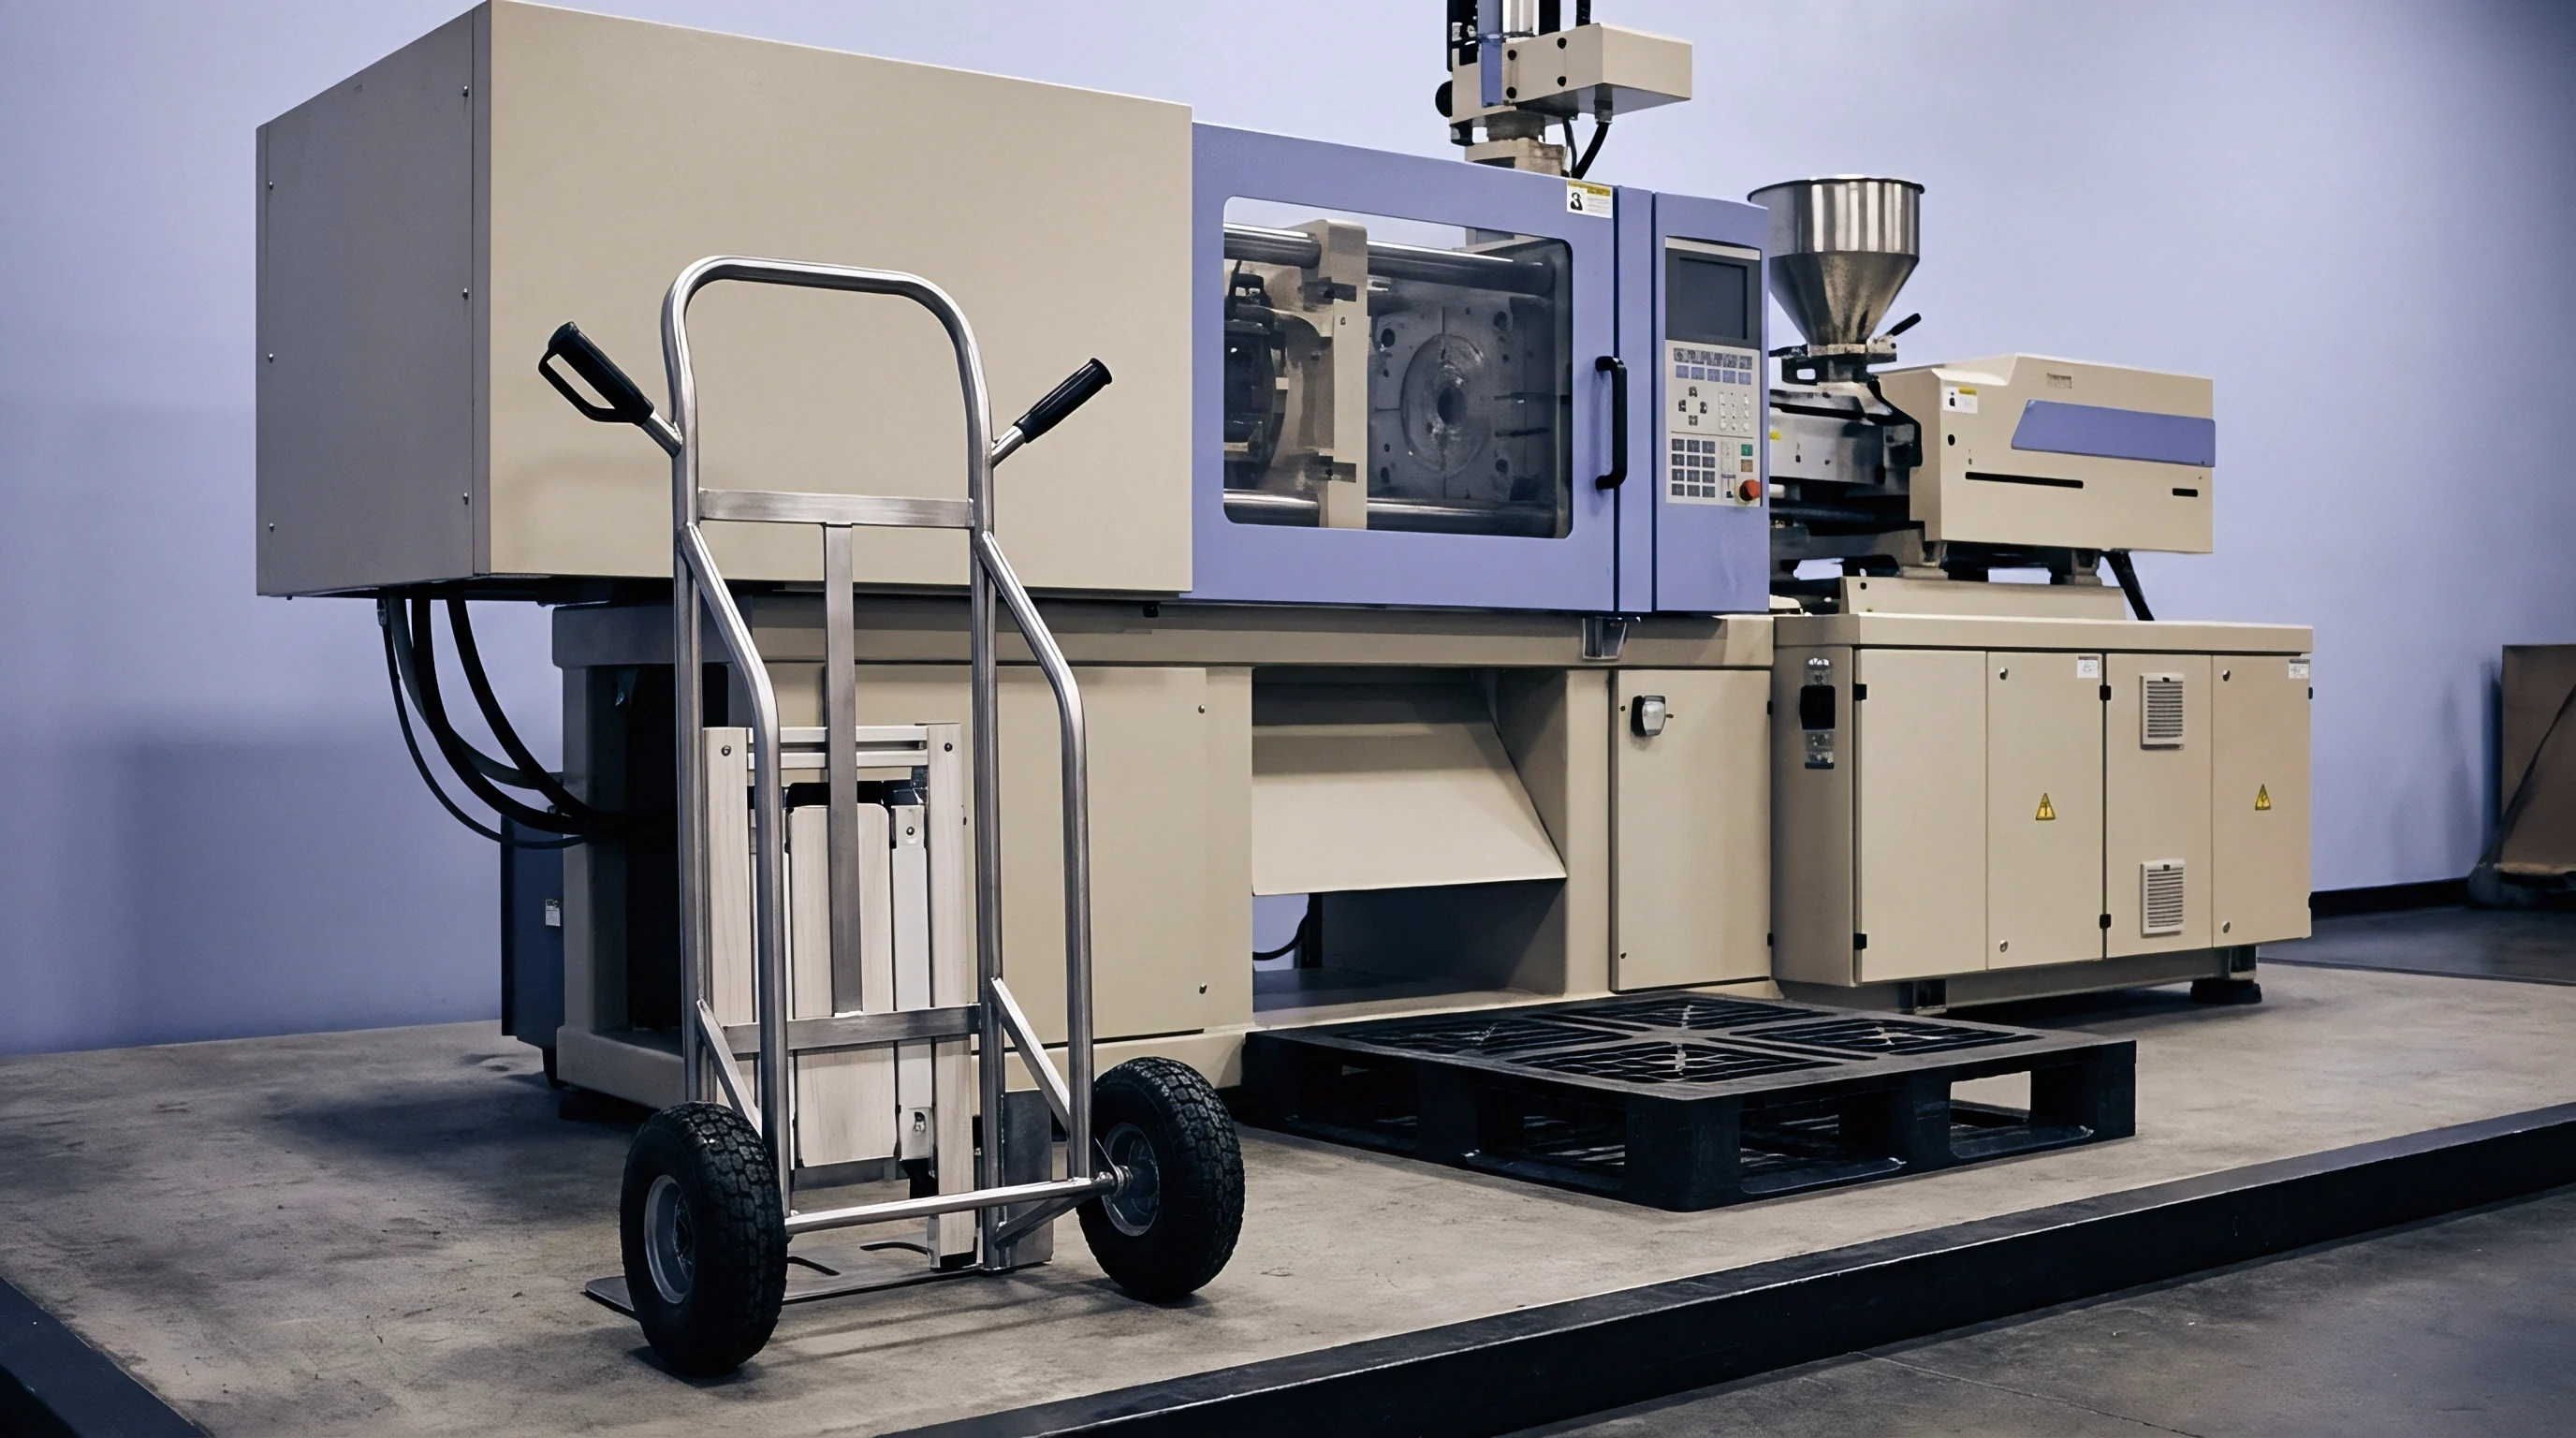
Transition
Melt advancing through a cavity with varying wall thickness undergoes sharp changes in velocity gradients, velocity distribution, and shear rates. Polymer chains align along the direction of flow under high shear stress near mold walls, while extensional flow dominates at abrupt geometrical steps where cross-sectional areas shrink or expand. When the melt front passes from a section of 3.0 millimeters wall thickness down to 1.0 millimeter, the sudden contraction forces fluid elements to accelerate, creating strong extensional stresses along the centerline alongside extreme shear rates near the entrance corners.
This mechanical deformation stretches molecular chains out of their random coil equilibrium, storing entropic energy in the fluid matrix before the material cools below its glass transition temperature or semi-crystalline freezing point.
Shear rates jump sharply. The thermal boundary layer, formed by hot polymer touching cold steel, remains thin at high injection velocities, forcing the volumetric flow through a narrow liquid core. At the sudden step, the local shear rate exceeds values calculated from steady-state Hagen-Poiseuille pipe flow approximations by factors of three to eight.
High velocity gradients generate substantial first normal stress differences, causing viscoelastic stress concentrations right at the re-entrant corner of the step. The combination of intense shear deformation near the wall and extensional stretching in the core leaves a frozen-in molecular orientation profile across the thickness, directly governing post-moulding dimensional distortion.
Wall thickness reductions exceeding two-to-one generate local extensional stress fields that double the frozen-in orientation compared to uniform channels.
Differential relaxation rates between thick and thin wall sections aggravate structural instability. In the thicker region, slow heat extraction allows polymer chains time to disentangle and relax toward isotropic states before solidification locks the structure. In the adjacent thin section, fast thermal quenching freezes stretched configurations instantly.
The sharp boundary between highly oriented, frozen polymer and relaxed polymer creates residual stress gradients across the step junction, resulting in localized warpage, sink marks, or spontaneous stress cracking under environmental exposure.

Extensional Stresses at Abrupt Contractions
Polymer molecules entering a narrow channel from a wide reservoir experience spatial acceleration that stretches the macromolecular coils along the streamlined flow paths. Extensional viscosity, which often increases with strain rate for branched polymers or exhibits shear-thinning behavior in linear chains, determines the magnitude of the pressure drop across the contraction step. Shear stresses dominate near the mold boundary, but extensional stresses govern the entry pressure loss and set up molecular orientation profiles that persist far downstream from the physical step feature.

Polymer Chain Freeze-In Mechanics
Cooling rates inside the tool dictate how much flow-induced strain transforms into permanent structural stress. Thermal diffusivity of the resin, mold wall temperature, and local wall thickness dictate the exact cooling window available for strain relaxation. Frozen orientation drives warpage.
When the local cavity wall drops below the heat deflection threshold before viscoelastic stress relaxes, residual strain remains embedded within the solid structure. These residual stresses consist of two distinct contributions: thermal residual stresses caused by uneven volumetric shrinkage, and flow-induced residual stresses caused by unrelaxed shear and extensional strains. In stepped geometries, flow-induced strain accounts for up to sixty percent of the total internal stress state near the step transition zone.
Unbalanced orientation profiles weaken the part along the transverse direction while strengthening it parallel to flow. Failure modes manifest across specific operating conditions and structural geometries:
- Anisotropic Shrinkage Deflection manifests when differential thermal contraction along oriented macromolecular chains causes non-uniform part twisting after mold release.
- Environmental Stress Cracking develops near step corners where high residual tensile stresses lower the chemical resistance threshold against aggressive liquid agents.
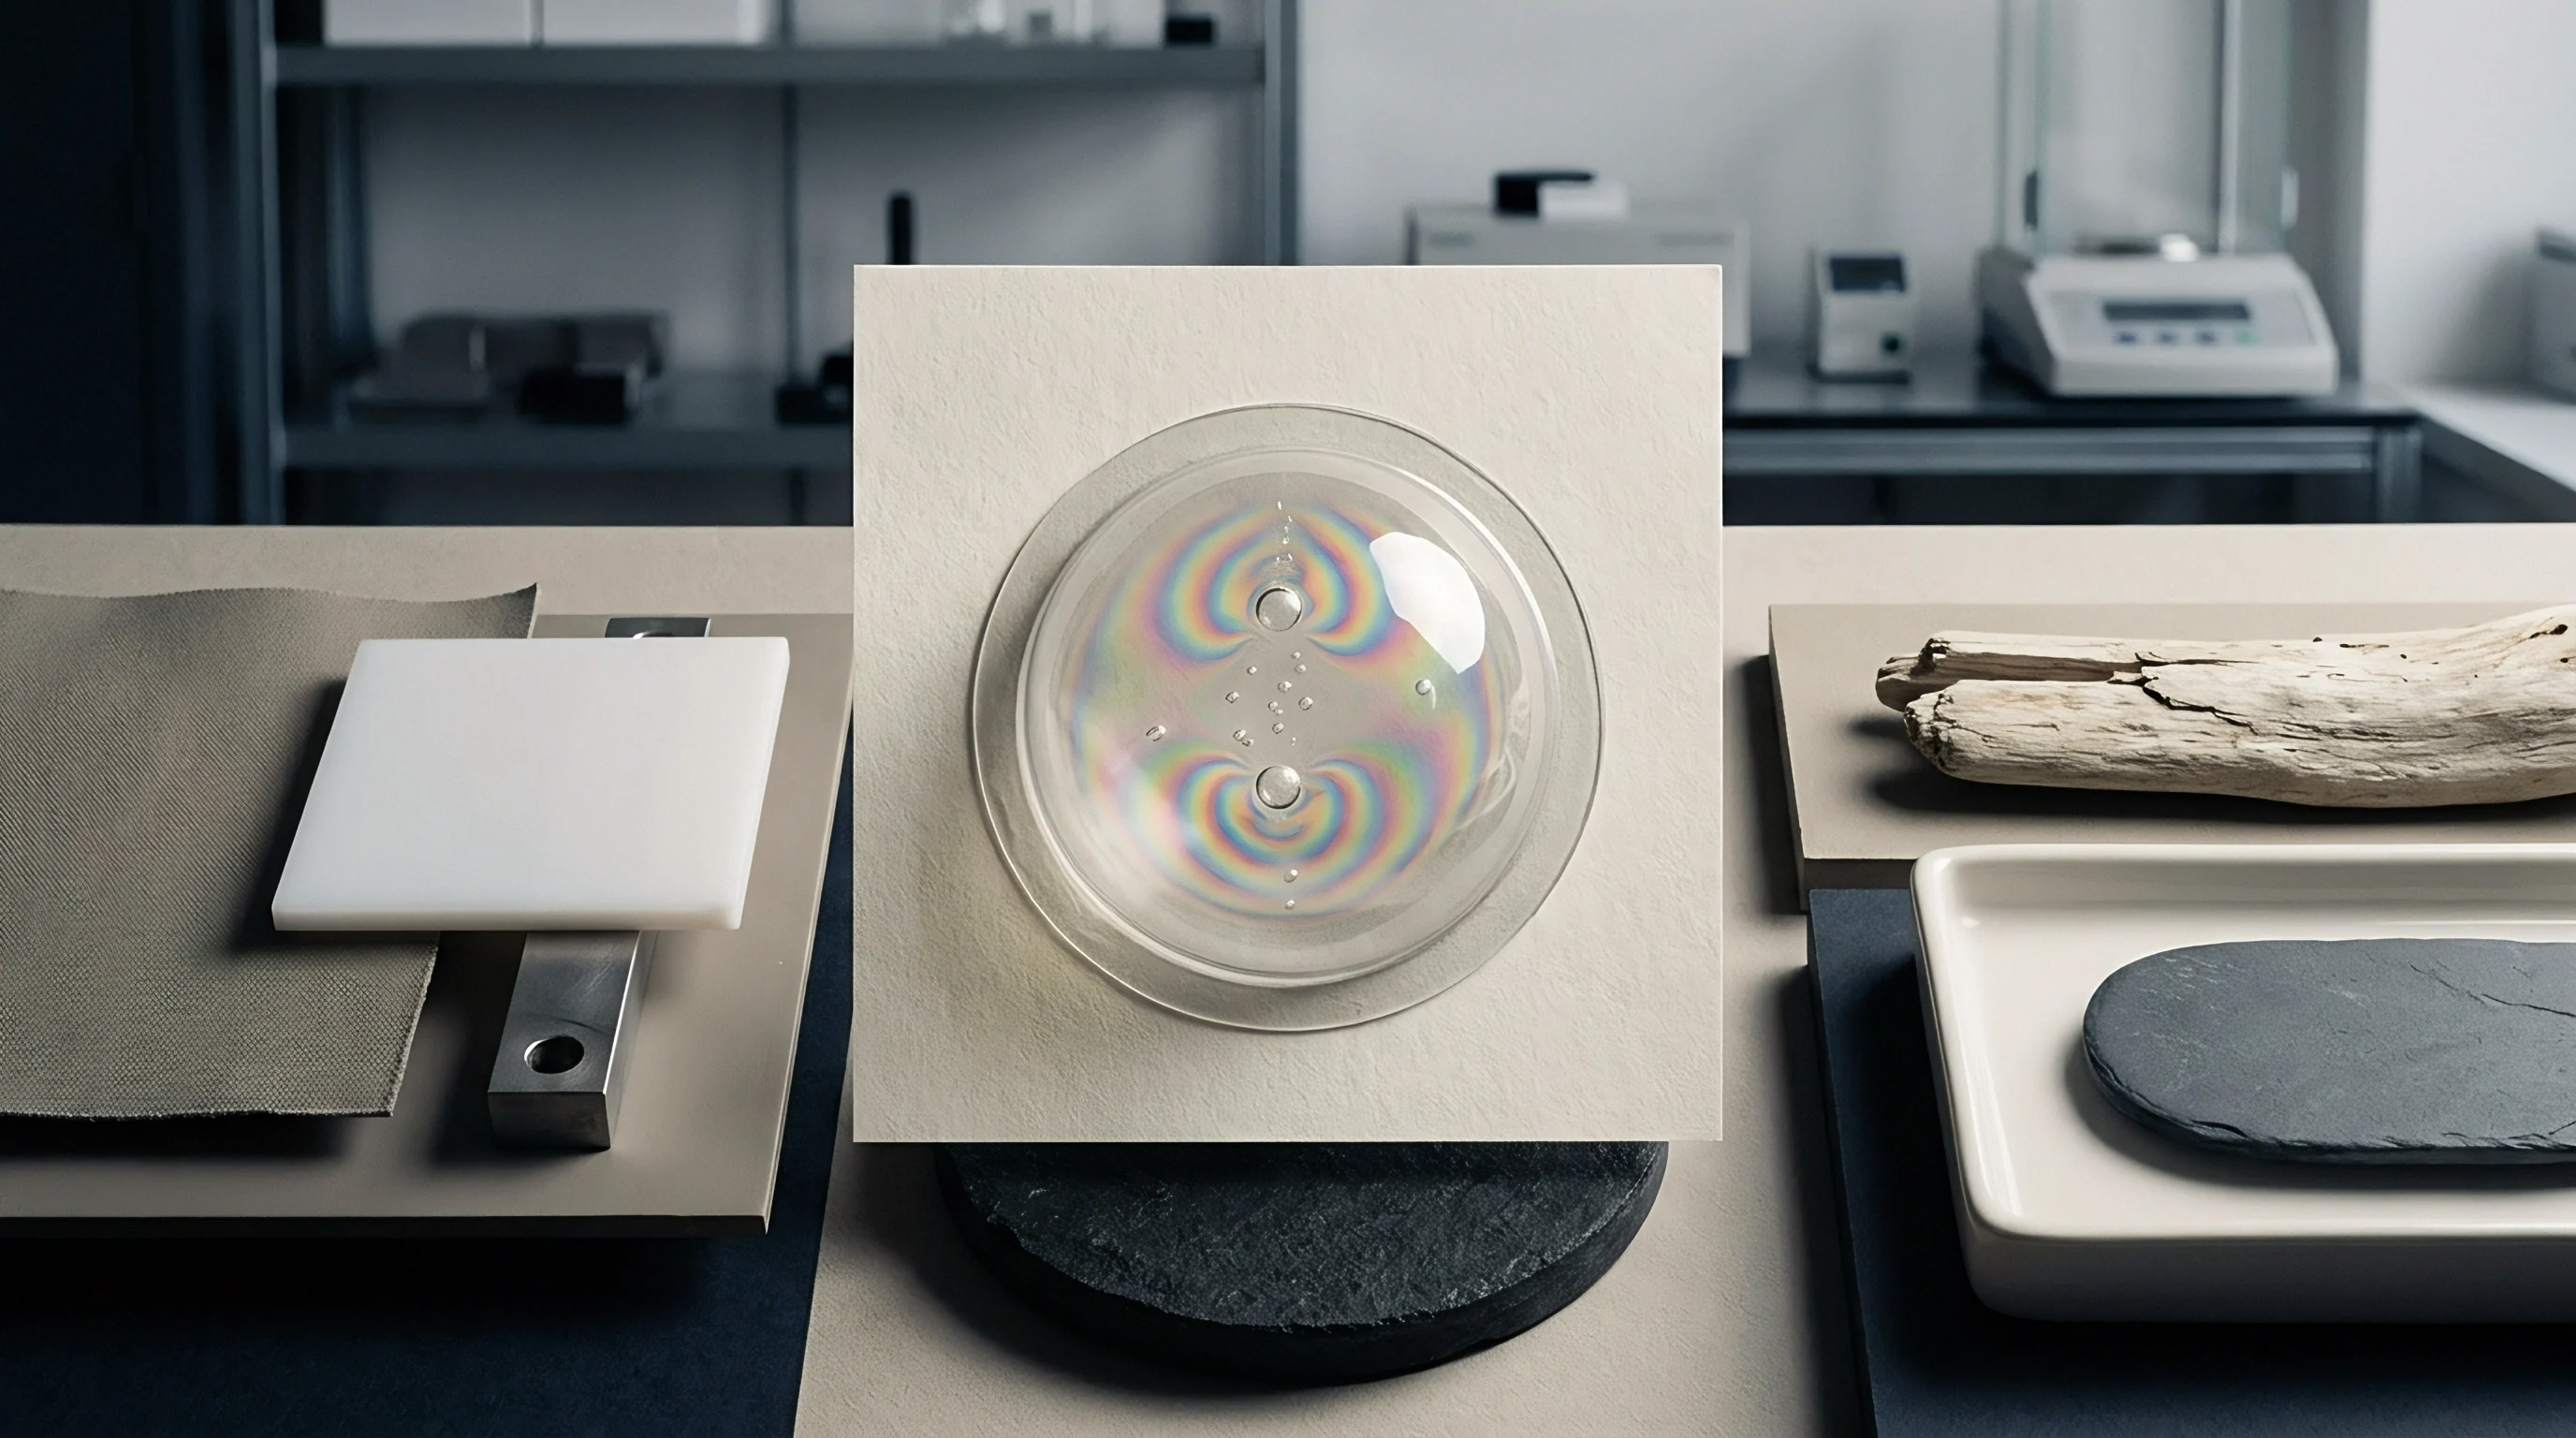
- Optical Birefringence Fringes appear in transparent components due to anisotropic refractive index distribution caused by oriented polymer chains locked in place during rapid thermal quenching.
- Gate Delamination Flaking occurs when extreme shear rates at step transitions sever surface layer molecular entanglement, causing thin skin layers to peel under shear forces during ejection.
Failure to account for velocity field acceleration at geometric transitions distorts structural finite element analyses, leading to unexpected premature part cracking during impact testing.


Rheology
Constitutive equations used in commercial injection molding simulation packages must capture both shear-thinning behavior and viscoelastic memory phenomena to predict flow-induced stresses accurately. Standard generalized Newtonian models, such as Cross-WLF or Carreau-Yasuda formulations, predict viscosity variations as a function of shear rate and temperature but omit normal stress differences and strain relaxation time scales. Predicting residual strain across stepped geometries requires viscoelastic constitutive models that incorporate fluid elasticity, such as the Phan-Thien-Tanner, Giesekus, or Differential Viscoelastic models.
Viscoelastic memory persists longer. Linear viscoelasticity theory applies when deformation remains small, but the large shear and extensional deformation rates encountered at geometric steps require non-linear stress-strain relationships. The first normal stress difference measures the tension developed along flow streamlines, directly driving polymer chain orientation.
Second normal stress differences, though smaller in magnitude, drive secondary flow vortices in non-circular cross-sections, altering local strain accumulation across steps.
| Model Type | Viscosity Dependency | Normal Stresses | Relaxation Spectrum | Strain Prediction Accuracy |
|---|---|---|---|---|
| Temperature and Shear Rate | Omitted | Single Average Value | Low in core, moderate near walls | |
| Shear Rate Only | Omitted | None | Poor across step transitions | |
| Shear and Extensional | First and Second Captured | Multi-mode Relaxation | High across shear and contraction steps | |
| Anisotropic Mobility | First and Second Captured | Multi-mode Relaxation | High for highly branched polymers |
Multi-mode relaxation spectra accurately represent the broad molecular weight distribution typical of commercial engineering resins. Short relaxation times characterize small molecular segments that adjust rapidly to local shear deformation, while long relaxation times correspond to long-chain entanglements that retain memory of extensional strain long after the flow front has passed. When the process residence time through a step feature is shorter than the dominant material relaxation time, frozen-in strain escalates dramatically.

Viscoelastic Stress History Calculations
Tracking stress tensors along fluid pathlines demands tracking the complete strain history of fluid elements from the gate to the solidification front. As fluid elements pass through a step contraction, the history of deformation accumulates according to integral or differential viscoelastic equations. The Deborah number, defined as the ratio of material relaxation time to characteristic flow process time, quantifies elastic strain accumulation.
High Deborah numbers at step transitions indicate that elastic energy storage dominates viscous dissipation.
Polycarbonate resins processing at Deborah numbers above 0.5 maintain residual orientation profiles that increase post-moulding birefringence by forty percent.
Extensional viscosity modeling governs energy loss across converging geometries. Linear polymers exhibit extensional thinning at high strain rates, whereas long-chain branched polymers exhibit strain hardening. Strain hardening increases resistance to extensional flow, swelling the entry pressure loss and producing wider stress boundary layers upstream of the step.
First Normal Stress Difference Dynamics
Normal stress differences generate anisotropic tension within the flowing melt stream. In flat channels, normal stresses act parallel to cavity walls, but at stepped transitions, the fluid velocity vector re-orients, converting longitudinal normal stresses into transverse stress components. Pressure losses multiply rapidly.
These re-oriented stress components remain trapped as the polymer cools, leaving a complex, multi-axial stress field surrounding the geometric feature. Mold design strategies must account for these stress fields to avoid unexpected post-moulding distortion. Can advanced non-linear viscoelastic solver algorithms reliably predict residual optical retardation without empirical calibration coefficients for every unique resin batch?

Fillet
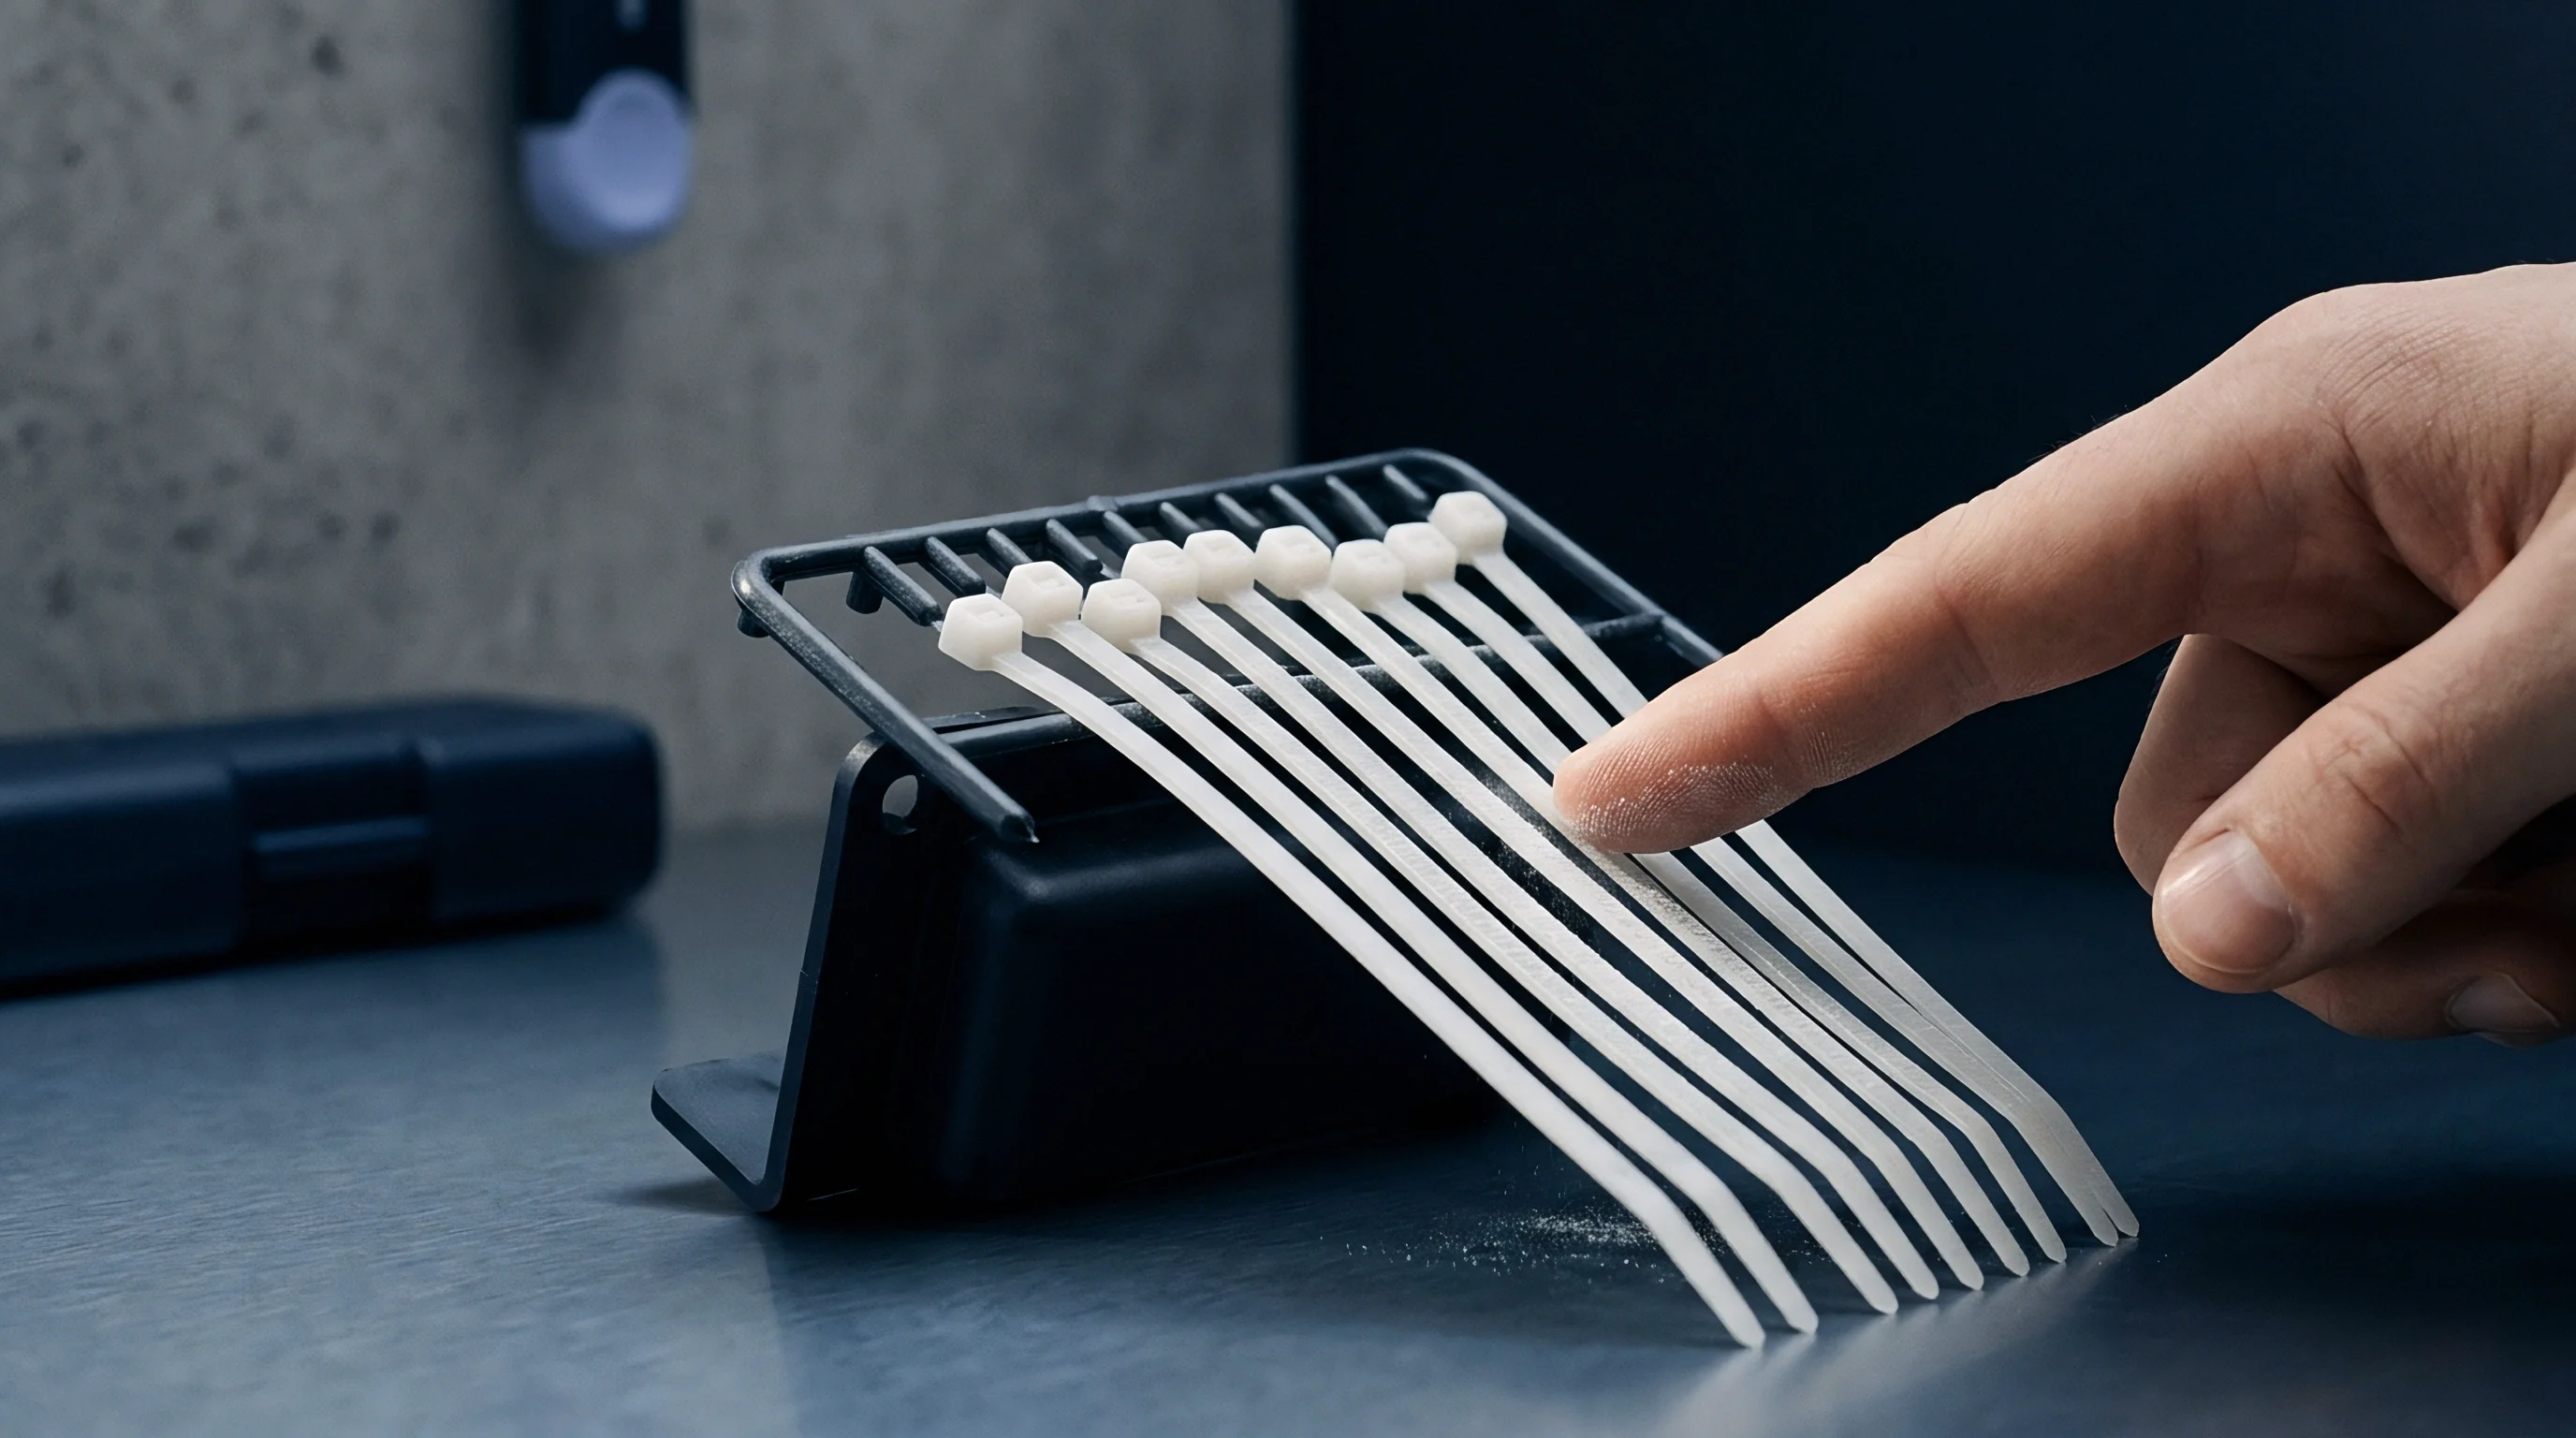
Geometrical modification of the transition zone serves as the primary toolroom mechanism for suppressing local strain spikes. Introducing internal radii or chamfers converts an abrupt step contraction into a gradual transition zone, lowering local shear rate peaks and smoothing out extensional velocity gradients. Replacing a 90-degree step corner with an optimized fillet radius expands the cross-sectional transition distance, giving oriented polymer chains more time to undergo thermal relaxation before freezing.
Radii size selection dictates local shear stress mitigation. A fillet radius smaller than fifty percent of the adjacent thin wall thickness provides minimal reduction in extensional stress gradients. Conversely, excessively large transition radii add unnecessary mass to the part, extending local cooling times, increasing sink mark risks, and expanding cycle time without yielding proportional stress reductions.
Transition radii matched exactly to thin wall thickness eliminate re-entrant corner flow stagnation and suppress peak shear stress spikes.
Core steel requires modification. Step ratios define the severity of strain concentration. A wall thickness jump from 1.0 millimeter to 3.0 millimeters represents a three-to-one transition ratio, introducing severe pressure drop anomalies and flow front instabilities.
Transition ratios exceeding two-to-one require tapered wall transitions with slope angles kept below fifteen degrees relative to the primary flow direction.

Why Does Melt Memory Escalated Strain Surface at Internal Radius Steps?
Corner junctions act as localized thermal insulators and mechanical stress raisers simultaneously. Heat transfers away from the melt through two steel faces at an internal corner, whereas an external corner transfers heat into a large mass of steel across a wide outer radius. This asymmetric heat removal causes the internal core of the resin at an internal step corner to remain molten longer, allowing thermal shrinkage stresses to pull against the rapidly frozen outer skin layer.
Simultaneously, fluid streamlines bend sharply around internal radii, causing local shear rate spikes that peak right at the liquid-solid interface. The combination of slow cooling in the core and high shear at the wall leaves a sharp residual stress gradient embedded directly beneath the surface of the internal radius.
Transition planning requires methodical tool geometry decisions prior to final steel cutting:
- Transition Ratio Auditing requires calculating the ratio of thick-to-thin nominal wall sections across all cavity features, flagging any step exceeding a two-to-one section change for radius redesign.
- Internal Radius Sizing mandates applying a continuous transition radius equal to at least eighty percent of the thinner wall thickness along every sharp corner.
- Taper Angle Implementation incorporates a smooth ten-to-fifteen-degree transition ramp between differing wall planes instead of a perpendicular step face.
- Flow Path Realignment places gates so that the melt front flows from thick sections into thin sections rather than forcing high-velocity flow from thin sections into thick expansions.
Stepped transitions engineered without generous blend radii generate sharp stress concentration factors, lowering ultimate part fatigue life under cyclic mechanical loading. Smooth radius transitions prevent local flow stagnation zones, maintaining balanced fill patterns across complex multi-cavity tools.
Birefringence
Optical retardation measurement provides a non-destructive method for quantifying frozen-in molecular strain in transparent amorphous polymers like polycarbonate, polymethyl methacrylate, and cyclic olefin copolymers. When polarized light passes through an anisotropic material with oriented polymer chains, the light splits into two orthogonal beams traveling at different phase velocities. The resulting phase difference, or optical retardation, correlates directly with the principal stress differences trapped within the part geometry through the photoelastic law.
Residual stresses distort geometry. Photoelastic constants depend on chemical structure and temperature, converting measured optical fringe patterns into quantitative internal stress maps. High fringe densities concentrated at stepped wall transitions indicate extreme flow-induced orientation profiles, exposing region-specific structural vulnerability.
Quantifying residual strain profiles across complex step geometries follows a strict laboratory protocol:
- Cut microtome test specimens measuring 100 micrometers in thickness perpendicular to the primary flow axis across the stepped transition feature.
- Mount the thin section flat on a polarizing microscope stage equipped with a monochromatic light source operating at 589 nanometer wavelength.
- Rotate the specimen relative to the transmission axes of the polarizer and analyzer until maximum extinction positions confirm principal optical axes orientations.
- Insert a tilting Berek compensator into the optical path to measure exact retardation values in nanometers across the wall thickness profile.
- Calculate principal stress differences by dividing measured retardation by the product of specimen thickness and the material photoelastic constant.
- Map stress magnitude curves from the outer frozen skin layer through the shear boundary zone to the central core region.
Thick wall steps cool slowly. Polarized light inspection techniques highlight the precise boundaries where flow-induced orientation transforms into thermal residual strain. High fringe concentrations near mold surfaces track shear-induced orientation formed during cavity filling, while fringes concentrated near internal core steps capture extensional stresses locked in during packing.
| Step Profile Configuration | Fillet Radius (mm) | Peak Shear Rate (1/s) | Retardation At Wall (nm) | Retardation At Core (nm) |
|---|---|---|---|---|
| 0.0 | 18,500 | 680 | 420 | |
| 0.5 | 12,200 | 410 | 280 | |
| 1.5 | 6,800 | 210 | 130 | |
| 3.0 | 4,100 | 110 | 65 |
Alternative strain determination methods include destructive hole-drilling strain gauge testing and thermal recovery strain analysis. Thermal recovery testing involves heating sectioned samples above their glass transition temperature, allowing oriented chains to shrink back to their equilibrium state, with measured dimensional changes reflecting original frozen-in strain levels.
Tooling suppliers often claim that optical birefringence variations stem entirely from material lot inconsistencies rather than incorrect gate placement or aggressive injection speeds.
Profile
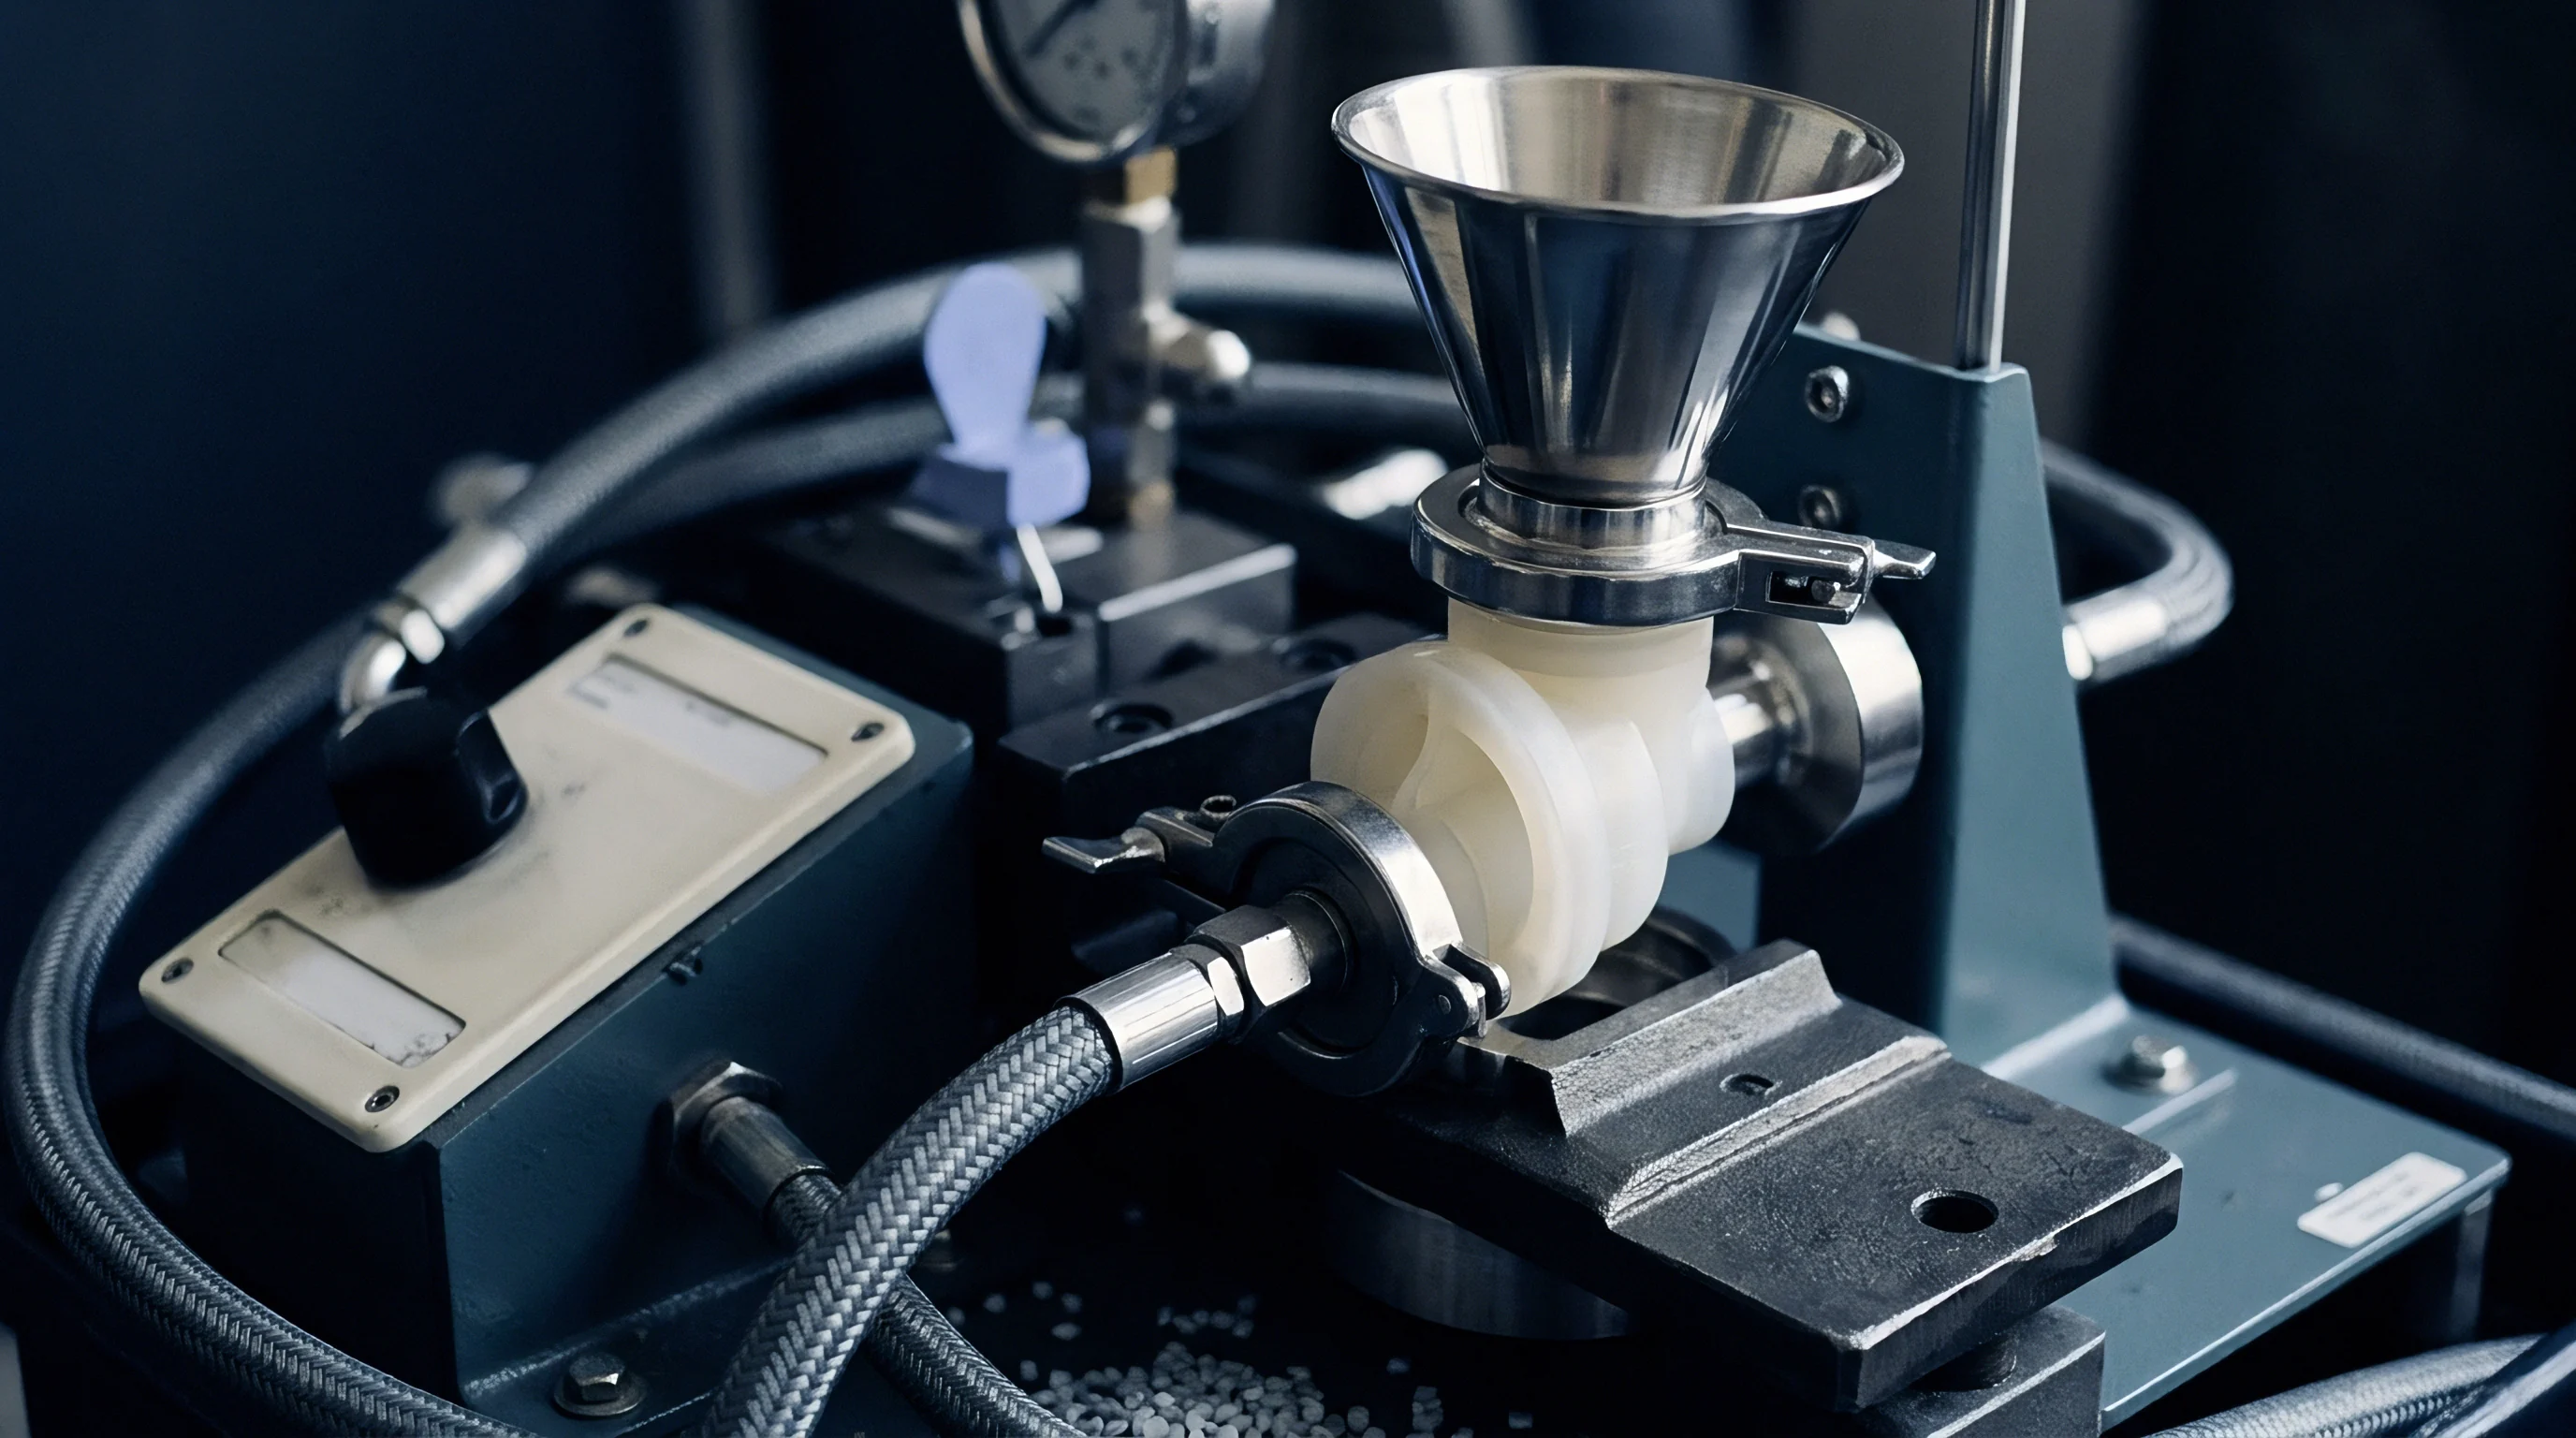
Injecting polymer melt at a constant volumetric flow rate creates extreme velocity spikes as the fluid front negotiates stepped reductions in wall thickness. Velocity profiling on modern scientific injection moulding presses allows setters to adjust screw speed dynamically based on screw position, maintaining a constant melt front velocity across changing cross-sectional areas. Decelerating the injection speed just before the flow front reaches a stepped transition prevents peak shear rate spikes and reduces extensional strain formation across the step feature.
Flow front velocity stability minimizes molecular orientation spikes. When the flow front exits a thin section and enters a thicker geometry, accelerating the screw speed prevents premature skin freezing and avoids flow hesitation marks. Screw position calibration matching part cavity volumes ensures precise velocity handoffs at the exact moment the melt front passes through step transitions.
| Injection Speed Profile | Transition Zone Velocity | Max Shear Stress (kPa) | Extensional Stress (kPa) | Cycle Time Delta (s) |
|---|---|---|---|---|
| Accelerating through step | 285 | 410 | 0.0 | |
| Decelerating before step | 140 | 190 | +1.8 | |
| Constant front velocity | 115 | 145 | +0.4 | |
| Gradual speed decay | 165 | 225 | +0.9 |
Cavity pressure dynamics during the packing phase further modify frozen-in strain states. High packing pressures force additional melt into the cooling core, counteracting thermal shrinkage but introducing secondary shear stresses as semi-solid material slides along frozen outer layers. Adjusting packing pressure decay profiles prevents over-packing thin sections while maintaining sufficient pressure to pack out adjacent thick walls across step transitions.

Multi-Stage Injection Speed Programming
Setting multi-stage speed profiles requires linking screw position transfers directly to internal cavity volume changes. Standard press controllers execute transfer steps based on linear stroke position, demanding precise calculation of shot weight percentages represented by each distinct wall thickness section within the cavity tool.
Initial fill speed drives fast mold filling through primary channels, preventing cold flow front formation. Secondary slow speeds engage as the melt enters stepped contractions, suppressing extensional strain spikes. Final fill speeds accelerate slightly to pack out distant rib structures before the controller switches over to hold pressure based on cavity transducer feedback.
Melt Temperature and Mold Wall Effects
Elevating melt temperatures lowers polymer relaxation times, accelerating molecular disentanglement and reducing residual strain levels. Elevated mold temperatures slow the cooling rate, providing extended relaxation windows that decrease frozen-in orientation at the expense of longer overall cooling cycle times.
Balancing mold wall temperatures across core and cavity halves helps equalize shrinkage forces across stepped features. Operating cavity steel twenty degrees warmer than core steel compensates for thermal asymmetry introduced by step radius geometry, suppressing post-ejection part warpage without extending cycle times excessively.
Cooling circuit positioning around step features dictates local heat extraction rates. Conformal cooling channels following the exact step contour prevent localized heat buildup, maintaining uniform skin layer thickness and preventing localized stress concentrations from locking into the solid part structure.
Allowance
Predicting flow-induced strain allows tool designers and buyers to establish realistic tolerance allowances before cutting tool steel. DIN 16742 tolerance standard categorizes molded part dimensions based on material shrink behavior and geometric constraint levels. Stepped geometries exhibit wide variations in achievable tolerance grades because anisotropic shrinkage parallel to flow differs significantly from transverse shrinkage across the step transition.
Parting line alignment, mold core stability, and local wall thickness ratios set the baseline tolerance capability. Attempting to hold tight tolerance grades on dimensions spanning stepped transitions without adjusting for orientation-induced warpage forces toolmakers to execute costly steel modifications late in the commissioning cycle.
Managing commercial and technical risks associated with flow-induced strain requires formal documentation standards:
- Rheological Fill Simulation Dossiers must include full non-linear viscoelastic stress predictions and frozen-in strain contour maps alongside standard pressure drop calculations before drawing approval.
- Tool Design Sign-Off Records mandate explicit verification that all wall thickness step transitions incorporate radius transitions meeting minimum geometry guidelines.
- First Article Inspection Reports require non-destructive birefringence testing or cross-polarized optical stress checks on all transparent prototype parts prior to final cavity steel hardening.
- Mold Trial Quality Checklists record multi-stage injection velocity profiles, packing pressure decay curves, and cavity pressure trace data from sensor-equipped tools across early production trials.
Tooling amortisation calculations must incorporate potential steel-safe modification cycles needed to correct strain-induced warpage on stepped features. Budgeting for secondary EDM polishing passes or local core adjustment recuts prevents unexpected cost overruns when T1 prototype samples fail dimensional capability audits.
DIN 16742 Tolerance Grade TG6 requires non-uniform shrinkage compensation factors applied along orthogonal flow axes at stepped wall transitions.
Tool ownership terms and quality guarantee agreements should explicitly tie dimensional acceptance criteria to scientific molding process windows. Defining process window parameters in procurement contracts prevents suppliers from altering injection speeds or cooling times to optimize press output at the expense of part strain integrity.
A standard quality assurance contract clause mandates that parts undergo thermal stress relief verification testing under ISO 20753 guidelines, penalizing suppliers if unannounced process changes cause internal strain levels to exceed specified optical retardation limits.