Mapping Viscoelastic Stress Redistribution across Variable Thickness Bosses Using Non-Isothermal Moldflow FEA Integration
Non-isothermal Moldflow viscoelastic stress mapping converts frozen-in injection shear and thermal gradients into Abaqus structural FEA to prevent boss root yield.
Rib
At boss junctions, the increased local polymer mass disrupts uniform heat dissipation during injection molding. As molten resin fills the cavity, nominal walls freeze first, creating an outer skin that constricts flow into the adjacent boss root. Since the wall at a boss base is often fifty to one hundred percent thicker than the nominal panel, the core inside stays liquid far longer.
This isolated hot core creates sharp volumetric shrinkage differences, leaving behind residual stresses that lower load capacity and sink the outer surface.
Accurately predicting these residual stresses requires modeling the polymer as a non-isothermal viscoelastic fluid rather than assuming isotropic elasticity. During filling and packing, high shear rates near the walls align polymer chains along the primary flow direction. As heat conducts into the cooler tool steel, this orientation freezes into the outer skin.
The unsolidified core continues to contract, creating isotropic thermal stresses that act against the anisotropic skin. Standard linear elastic models miss this behavior entirely because they ignore stress relaxation during non-isothermal cooling.
Varying cooling rates across a boss cross-section create sharp thermal gradients that shift the material relaxation spectrum, delaying stress relief in the thick core while locking high shear stresses into the outer skin. Integrating non-isothermal rheological models into finite element injection simulations enables accurate mapping of these frozen-in stress tensors across variable thickness boss features before steel cutting begins.
Wall Thickness Ratios at Boss Geometry Junctions
Design guidelines traditionally recommend keeping boss wall thickness between sixty and seventy percent of the adjacent nominal panel to prevent sink marks. In high-load structural applications, however, product designers routinely increase boss wall thickness to accommodate higher thread-engagement torque from self-tapping screws or threaded brass inserts. This geometry shift creates a thick thermal mass where the vertical boss barrel meets the horizontal substrate floor.
As the cooling front advances, heat leaves the nominal wall rapidly from both top and bottom core pins, while the internal junction core remains above the polymer glass transition temperature or melting point.
The volumetric shrinkage within this isolated core pulls upon the already-solidified surface skin. If the surface skin possesses sufficient mechanical stiffness, the shrinkage force draws material inward from the center, forming internal micro-voids within the boss root junction. Conversely, if the skin remains warm and compliant, the outer surface collapses inward, manifesting as a visual sink mark on the show surface opposite the boss.
Both phenomena relieve peak hydrostatic tension within the core at the expense of structural integrity and aesthetic fidelity. Tool design evaluation relies on analyzing thermal contours at boss root intersections, identifying zones where core cooling delays exceed four seconds relative to nominal wall sections.
| Polymer Matrix Grade | Glass Fiber Mass Content (%) | Zero-Shear Viscosity (Pa·s) | WLF C1 Constant | WLF C2 Constant (K) | Thermal Diffusivity (mm²/s) |
|---|---|---|---|---|---|
| Polyamide 66 High-Flow | 30 | 450 | 8.85 | 101.6 | 0.132 |
| Polybutylene Terephthalate | 30 | 320 | 11.20 | 125.4 | 0.118 |
| Unreinforced Polycarbonate | 0 | 2100 | 17.44 | 51.6 | 0.098 |
| Polyoxymethylene Copolymer | 0 | 680 | 6.12 | 140.2 | 0.145 |
Viscoelastic Shear and Normal Stress Coupling
Under high shear rates, polymer melts exhibit non-linear viscoelastic behavior, generating normal stress differences that drive cross-directional stresses. In non-isothermal flow simulation, the total stress tensor splits into a viscous pressure contribution and a viscoelastic extra-stress tensor derived from constitutive equations such as the Phan-Thien-Tanner or Giesekus models. During high-velocity injection into a variable thickness boss, high shear fields develop at the narrow entry radius, inducing significant first and second normal stress differences.
These normal stresses create transverse forces that alter the orientation of glass reinforcing fibers or molecular backbones relative to the boss central axis.
As the melt transitions from high shear rates inside the runner and gate to low shear rates within the expanding boss cavity, stress relaxation occurs concurrently with rapid thermal quenching. The time available for molecular relaxation depends directly on the localized cooling rate, governed by the Williams-Landel-Ferry equation above the glass transition temperature or the Arrhenius relation below it. High cooling rates in thin wall sections freeze the polymer chains in an extended, highly oriented state before viscoelastic relaxation can occur.
In contrast, the slower cooling rate inside the thick boss core allows substantial stress relaxation, resulting in an unoriented core surrounded by highly stressed skin layers. Increasing injection rate from 45 mm/s to 75 mm/s shifts frozen-in residual shear stress across a 3.2 mm junction by 14 percent.
Wall intersections exceeding sixty percent of the primary nominal substrate induce localized core thermal isolation that doubles residual stress gradients.
The resulting stress state across the boss cross-section contains severe spatial gradients. High tensile residual stresses reside in the sub-surface layers, balanced by compressive stresses on the extreme outer frozen surface and hydrostatic tension within the warm core. When external mechanical loads, such as fastener insertion or bending moments, act upon the boss during assembly, these internal residual stresses superimpose directly onto the applied load state, precipitating premature brittle failure at stress values far below the nominal yield strength published on resin datasheets.
Whether localized molecular orientation decay kinetics under elevated packing pressure regimes can be captured without real-time pressure-dependent crystallization kinetics in semi-crystalline polymers remains an active area of investigation.

Mesh
Simulating viscoelastic stress generation across variable wall thicknesses requires precise discretization of spatial gradients throughout the molten polymer core. Traditional midplane or surface-mesh representations fail at boss root junctions because they reduce three-dimensional volumetric geometry to simplified shell approximations. Shell solvers rely on planar assumptions that cannot resolve transverse shear stresses, out-of-plane thermal gradients, or complex three-dimensional flow re-entry near core pin tips.
Accurately mapping viscoelastic stress fields demands fully three-dimensional solid finite element meshing using tetrahedral or hexahedral element formulations.
Spatial discretization across thickness transitions dictates the accuracy of both heat transfer and fluid flow calculations. Non-isothermal injection simulation coupling Navier-Stokes energy conservation equations with non-linear rheological constitutive models is sensitive to boundary layer mesh density. Shear rates peak sharply within thin solidifying layers near cavity walls, while temperature gradients display steep non-linear profiles across the freeze front.
Insufficient element density across the wall thickness artificially smears these gradients, underestimating peak shear stresses and overpredicting the rate of thermal relaxation within the boss core.
Boundary Layer Refinement across Thickness Transitions
Resolving non-isothermal flow behavior near metal tool boundaries requires refined boundary layer meshing. Standard solid mesh generators frequently place uniform tetrahedral elements throughout the volume, resulting in only two or three elements spanning the wall thickness in thin sections. This mesh coarseness introduces severe numerical damping, undercalculating viscous shear heating and failing to detect localized thermal spikes.
Advanced processing analysis demands a minimum of ten to twelve elements through the thickness of nominal walls, with localized geometric refinement surrounding boss radii, rib roots, and gate entry locations.
Edge length ratios between adjacent elements must change gradually to prevent numerical artificial stiffness. When transitioning from a 2.5 mm nominal panel into a 4.0 mm boss root junction, element aspect ratios must remain below three to one to preserve shape function accuracy within the solid solver. Prism or layer elements applied along outer cavity boundaries provide high spatial resolution perpendicular to the wall while maintaining reasonable element counts parallel to the flow path.
This structural discretization preserves steep thermal gradient accuracy during the rapid quench phase without causing computational memory overflows during matrix inversion.
3d Solid Solvers and Non-Isothermal Flow Equations
Coupling momentum and energy transport equations within a three-dimensional solid solver involves tracking transient temperature fields alongside velocity and pressure arrays at every time step. Non-isothermal flow equations account for viscous dissipation, where mechanical shear energy converts directly into thermal energy within high-shear wall boundary zones. In variable thickness bosses, this localized shear heating can elevate melt temperatures by ten to twenty degrees Celsius near sharp entry radii, temporarily reducing local melt viscosity and delaying solid skin growth.
The numerical stability of the non-isothermal solver relies on proper pressure-velocity decoupling and stable time-integration schemes. As the molten polymer fills the boss cavity and hits the solid core pin, flow deceleration generates localized pressure spikes that increase melt density and shift viscosity according to the Barus pressure-dependency coefficient. Solid solvers must iteratively calculate these density and viscosity shifts across every element layer while updating local thermal conductivity parameters as the resin transitions from liquid to solid state.
- Root fillet shear yield occurs when high shear stress fields locked during packing combine with service loads to exceed local material strength.
- Core void formation develops during cooling when the unsolidified molten core contracts away from frozen outer walls under severe thermal isolation.
- Asymmetric sink depression forms along nominal exterior surfaces due to localized volumetric shrinkage pull at thick boss roots.
- Hoop stress cracking emerges during self-tapping fastener insertion into bosses carrying high frozen-in hoop orientations.
Simulating structural performance using these discretized solid meshes demands continuous tracking of material frame rotation. As polymer elements deform during filling and packing, the principal orientation axes of the stress tensor rotate relative to fixed tool coordinates. Solid solvers must apply objective tensor rate formulations, such as the Upper Convective Maxwell model, to prevent unphysical stress generation during large-strain flow through complex boss radii.
Mesh discretization across variable thickness transitions maintains stability only when ten distinct solid layers span the local wall thickness.

Frost
Transient temperature distribution within the tool steel governs the rate of solid skin growth during injection and packing. Polymer solid skin layer growth begins immediately upon melt contact with cavity steel walls held below the material freezing temperature. In variable thickness bosses, heat extraction occurs asymmetrically due to steel geometric constraints.
While flat nominal panel surfaces benefit from planar cooling channels placed at uniform depths, internal boss core pins represent narrow steel projections surrounded entirely by molten polymer mass. Heat accumulates rapidly inside these small-diameter core pins, creating localized hot spots that dramatically retard polymer solidification.
As local mold temperatures spike near the core pin root, the thermal boundary condition at the polymer-metal interface shifts continuously throughout the injection cycle. Standard flow simulations assuming a constant tool wall temperature miss this bottleneck. Accurate modeling requires dynamic transient thermal boundaries that explicitly solve conjugate heat transfer between the polymer melt and tool steel second by second.
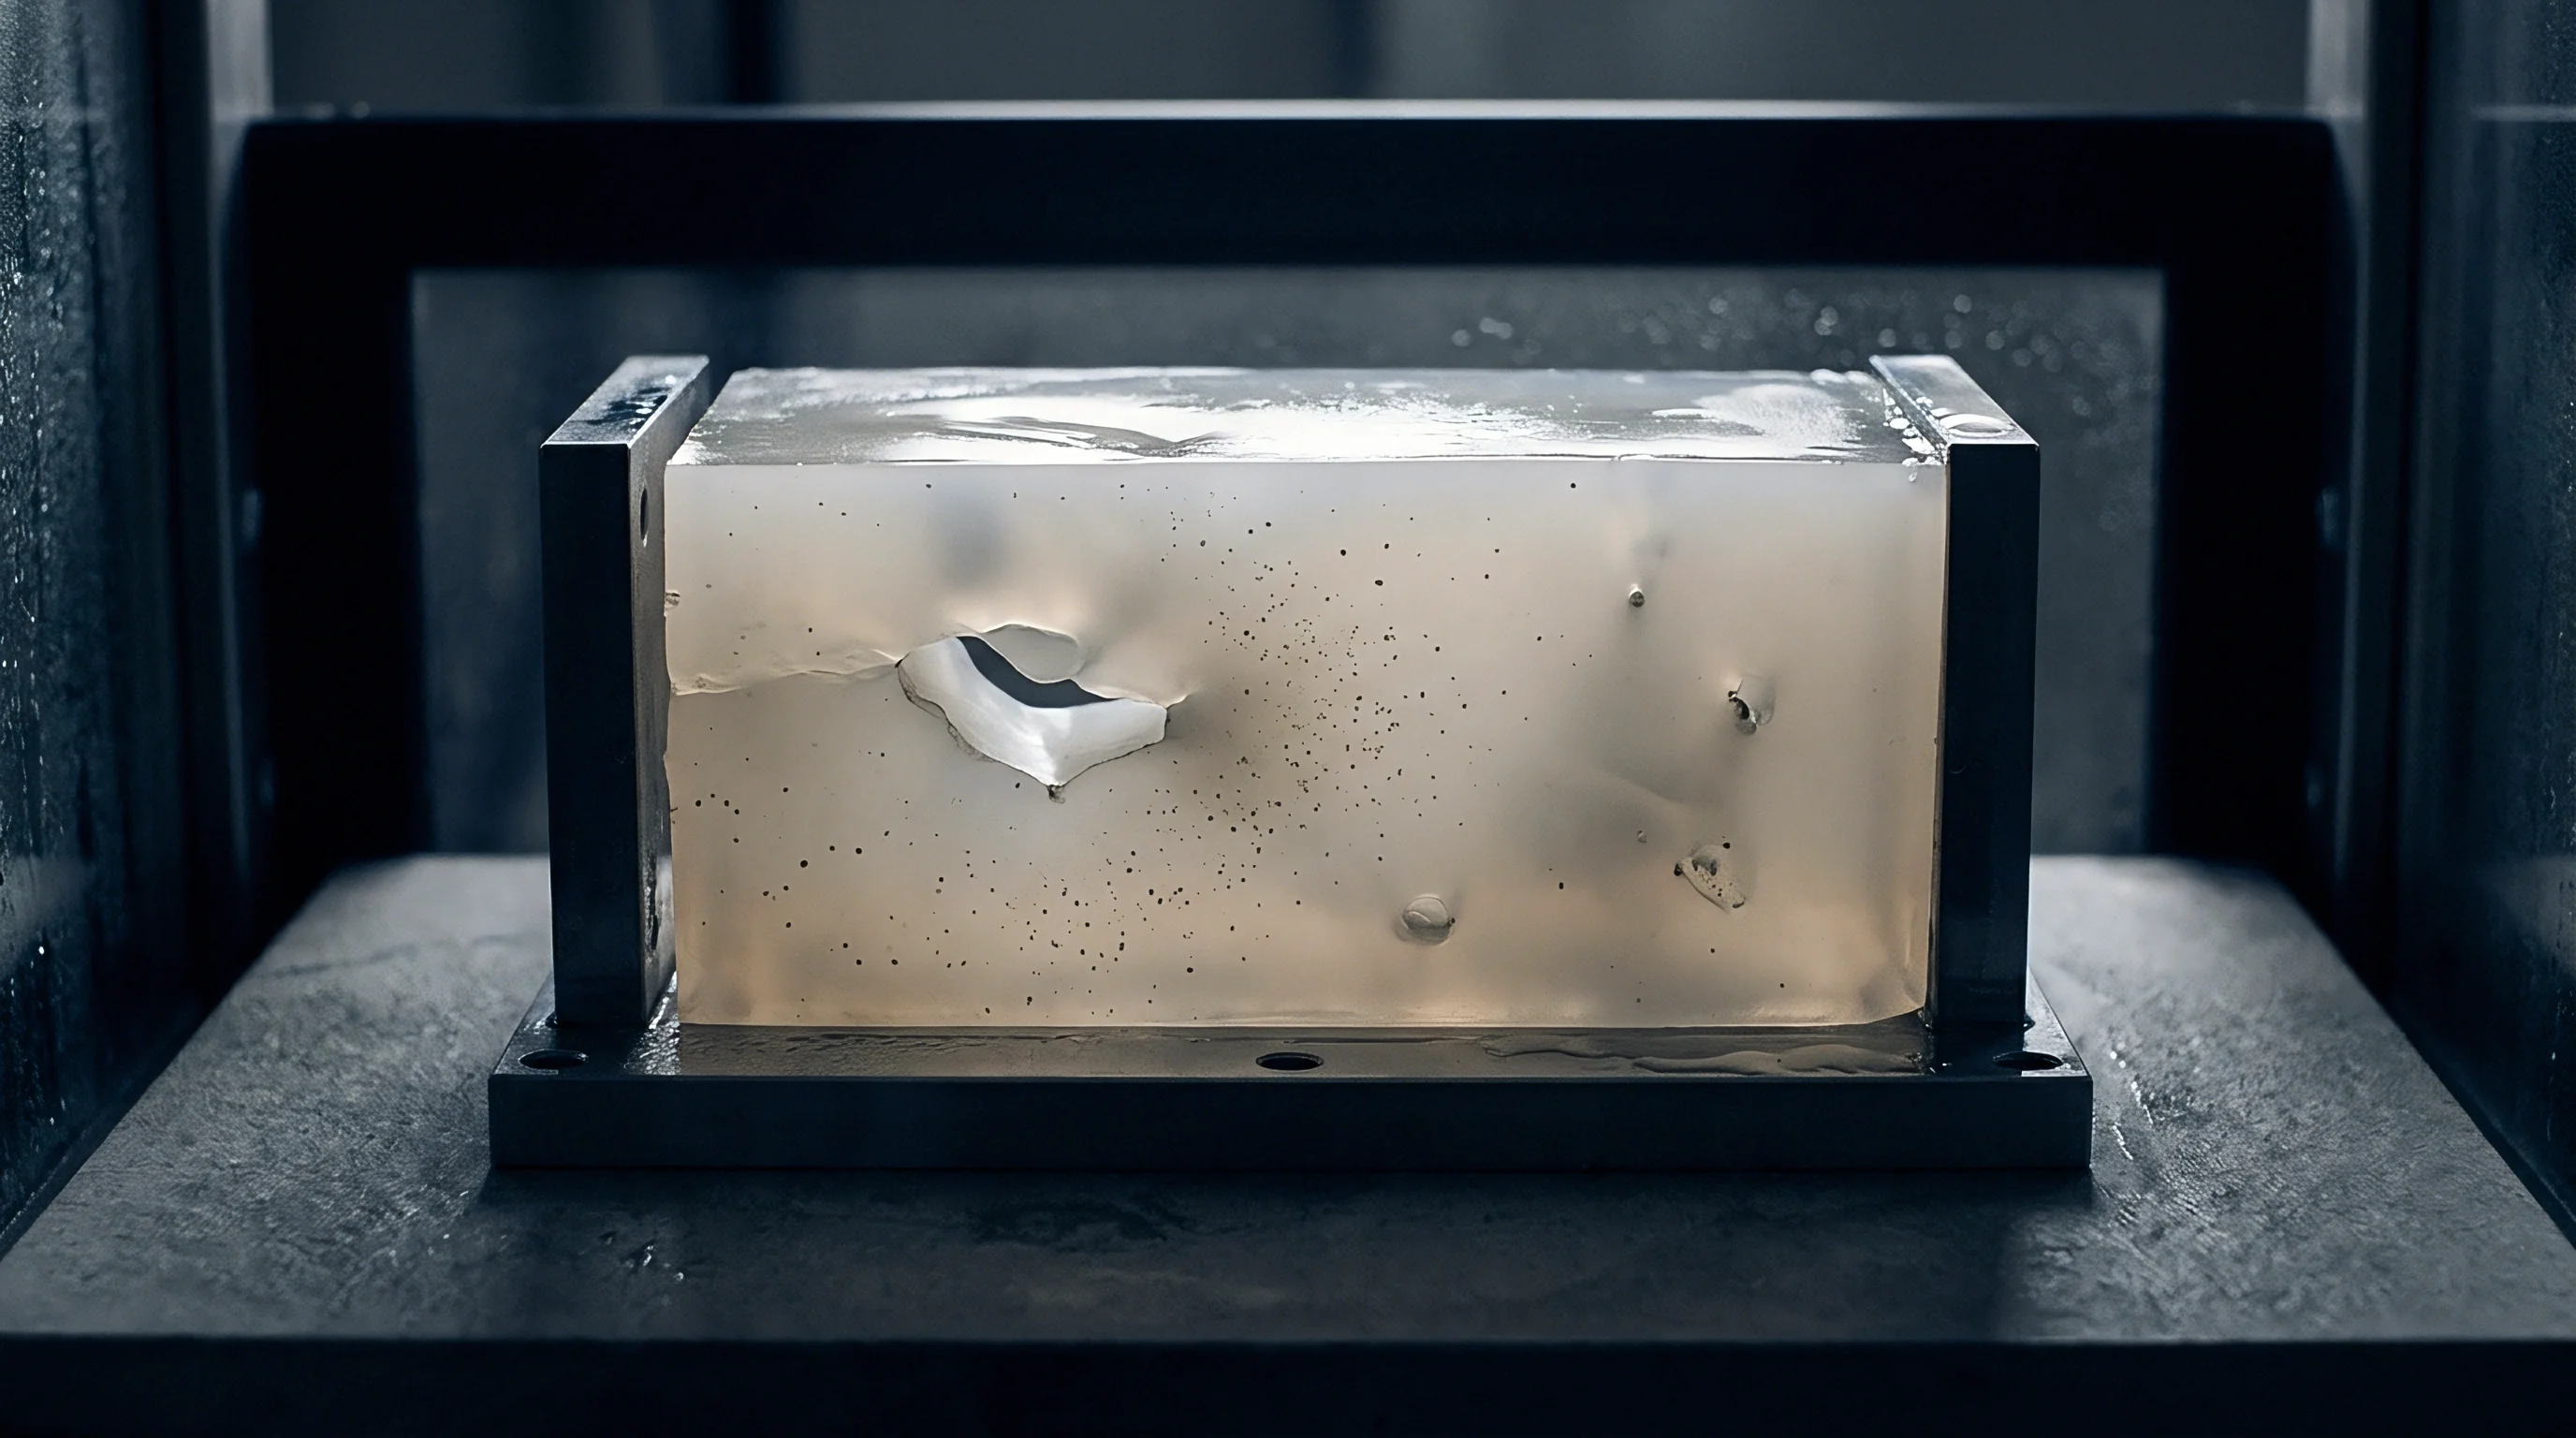
Why Does Localized Mold Temperature Spike in Boss Roots?
Heat accumulates inside core pins because the volumetric surface area available for thermal conduction decreases relative to the surrounding melt volume. During cavity filling, molten resin sweeps over the tip and sides of the core pin, delivering continuous thermal energy into a restricted steel cross-section. Cooling water circuits rarely extend into small-diameter core pins due to machining limits, leaving axial thermal conduction through the length of the pin as the sole heat removal pathway.
If the thermal conductivity of the tool steel is insufficient, heat builds up faster than it can conduct away into the main mold base, elevating the pin surface temperature toward the melt processing temperature.
As core pin temperatures rise, thermal isolation promotes internal voiding while localized pressure drops follow wall contraction. The polymer adjacent to the hot pin solidifies much more slowly than the outer shell formed against the main cavity wall. This asymmetric thermal field skews the frozen skin profile around the boss axis, driving uneven volumetric shrinkage and forcing the liquid core away from the hotter pin side.
Consequently, residual stress profiles around the boss perimeter become unbalanced, predisposing the part to directional warpage and asymmetric thread assembly failure.
Transient Thermal Boundary Conditions during Injection
Accurate transient thermal modeling couples heat conduction within the tool steel to convective and conductive energy transfer inside the polymer melt. Heat transfer coefficients (HTC) at the polymer-steel interface do not remain static; they vary dynamically as a function of local pressure and solidification state. During the initial filling phase, high contact pressure enforces maximum thermal contact, yielding interface HTC values reaching 2500 W/m²K. As the polymer cools and contracts during packing, localized contact pressure drops, allowing micro-clearances to form that drop the interface HTC down to 250 W/m²K or lower.
In thick boss features, this premature thermal decoupling dramatically retards heat removal. The insulating air micro-gap acts as a thermal barrier, retaining core temperatures above the material ejection threshold for prolonged durations. Advanced non-isothermal simulations dynamically update interface HTC maps based on calculated local contact pressure fields, capturing the precise point where thermal contact degrades and localized cooling rates stall.
Applying ISO 294 molding cycle standard conditions without adjusting cooling hold duration for localized boss core mass results in part rejection under DIN 16742 shear warp limits.
To mitigate severe thermal bottlenecks within core pins, toolmakers substitute standard H13 or P20 tool steel inserts with high-conductivity copper alloys, such as Beryllium Copper (C17200) or Moldmax alloy grades. These copper inserts feature thermal conductivities up to four times higher than conventional tool steels, accelerating heat removal from internal boss features and homogenizing the temperature profile across the wall transition zone.
An uncooled core pin raised boss root mold temperature by forty degrees Celsius and distorted the mounting plane beyond tolerance, causing twelve thousand dollars in tool rework costs.
Tensor
Exporting predicted stress distributions from non-isothermal injection molding simulations into structural finite element codes requires accurate coordinate mapping across disparate mesh topologies. Process simulation models utilize spatial meshes optimized for fluid flow, thermal boundaries, and shear layer resolution, whereas structural mechanics models employ meshes tailored for structural bending, contact mechanics, and stress concentration analysis. Mapping the full three-dimensional viscoelastic residual stress tensor ~ comprising normal stresses S_xx, S_yy, S_zz and shear stresses S_xy, S_yz, S_xz ~ from the flow mesh to the structural mesh requires advanced spatial interpolation algorithms that preserve hydrostatic and deviatoric stress invariants.
Anisotropic material behavior induced by mechanical orientation adds further complexity to structural export workflows. In short-glass-fiber reinforced thermoplastics, flow-induced fiber alignment varies continuously across the wall thickness of variable bosses. Process simulation outputs include fiber orientation tensor fields (A_ij) at every node layer.
Mapping routines must translate these orientation tensors into anisotropic elastic and plastic material properties using micro-mechanical homogenization schemes, such as Mori-Tanaka or Tandon-Weng models, before superimposing initial frozen-in stress tensors onto structural simulation nodes.
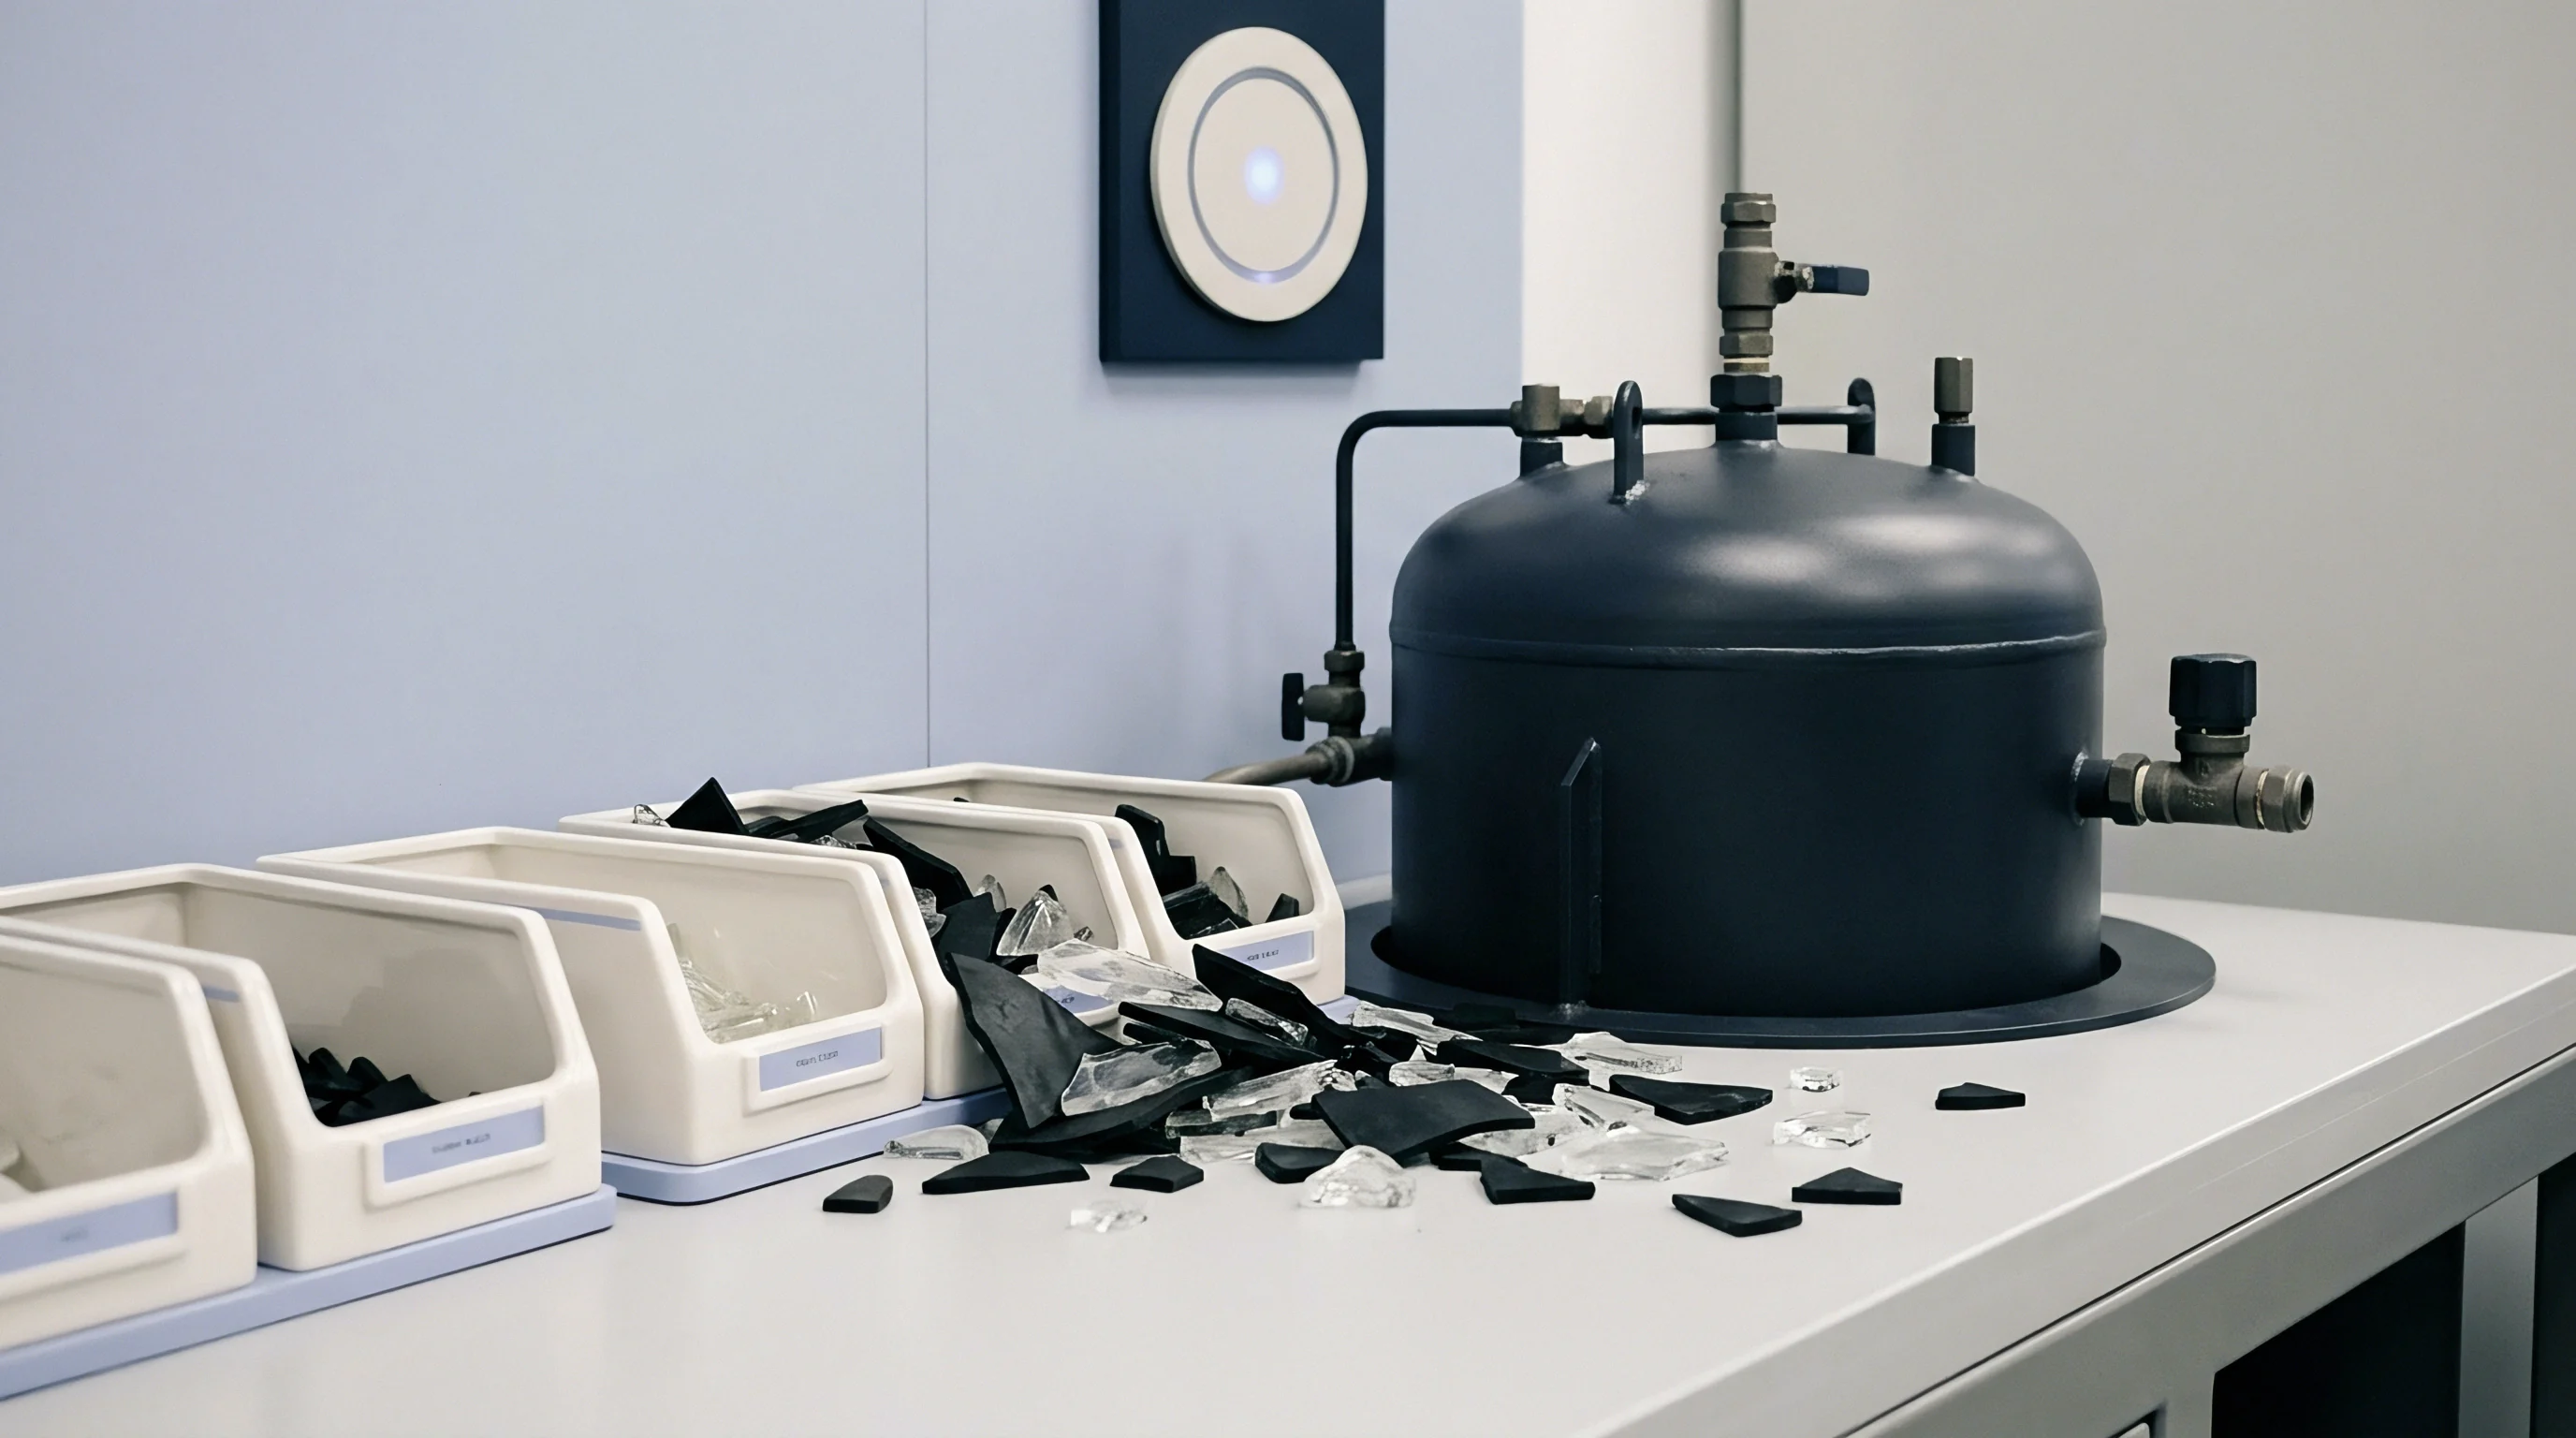
Mapping Polymer Residual Stress into Structural FEA
Structural solvers accept initial stress conditions by reading volumetric state files generated at the conclusion of the simulated molding cycle, specifically following ejection and thermal equilibration to ambient conditions. Simple isotropic mapping routines frequently extract only thermal contraction strains, neglecting flow-induced shear stresses entirely. This omission underestimates peak localized stresses near boss fillets by up to sixty percent in fiber-filled resins.
Comprehensive integration protocols export the complete, non-isotropic stress tensor alongside spatially dependent mechanical moduli.
Spatial interpolation must account for surface distortion between process and structural representations. When transferring stress tensors from an un-deformed Moldflow mesh to an Abaqus or ANSYS structural mesh, the mapping algorithm projects integration point data across element boundaries using shape-function weightings. Nodes located within steep stress concentration fields at boss root radii require localized patch recovery algorithms to prevent numerical attenuation of peak residual stresses during data transfer.

Viscoelastic Stress Relaxation Kinetics Post Mold Ejection
Following mold ejection, the part releases mechanical constraints imposed by tool steel cavity walls. Unconstrained, the component undergoes immediate elastic recovery followed by extended time-dependent viscoelastic stress relaxation. The residual stress tensor does not remain static; thermal energy retained within the ambient part drives ongoing molecular rearrangement, dissipating frozen orientation stresses over time.
The rate of stress relaxation follows time-temperature superposition principles, governed by the master relaxation curve G(t) derived from dynamic mechanical thermal analysis (DMTA).
For amorphous polymers such as Polycarbonate, post-ejection stress relaxation proceeds predictably according to the material glass transition dynamics. For semi-crystalline materials like Polyamide or Polybutylene Terephthalate, ongoing secondary crystallization post-ejection alters the relaxation spectrum, increasing matrix stiffness while generating localized micro-strains around crystalline spherulites. Structural mapping protocols must specify the exact conditioning time and ambient thermal storage history between part ejection and final mechanical loading to accurately reflect the relaxed stress state present during product service life.
Worked Sensitivity Analysis on Boss Fillet Stress Convergence
Evaluating three distinct structural boss design variants molded from 30% glass-fiber reinforced Polyamide 66 under identical non-isothermal injection conditions (melt temperature 290 °C, tool temperature 80 °C, pack pressure 65 MPa) quantifies the sensitivity of boss root integrity to wall thickness ratios and fillet radii. The baseline design (Boss A) featured a 1.2:1 wall thickness ratio relative to a 2.5 mm nominal panel with a 0.4 mm fillet radius. Boss B modified the geometry to a standard 0.6:1 ratio while retaining the 0.4 mm fillet radius.
Boss C retained the 0.6:1 ratio but increased the fillet radius to 1.0 mm while introducing a copper alloy core pin insert.
The non-isothermal process simulation mapped both anisotropic fiber orientation tensors and residual viscoelastic stress tensors into a structural FEA model subjected to an axial pull-out force of 1500 N applied via a thread-forming fastener. Process-induced stresses were superimposed directly onto applied mechanical loading stresses.
| Geometry Configuration ID | Wall-to-Nominal Thickness Ratio | Fillet Radius (mm) | Peak Injection Residual Stress (MPa) | 48-Hour Relaxed Stress (MPa) | Von Mises Stress under 1500N Load (MPa) | Predicted Structural Failure Mode |
|---|---|---|---|---|---|---|
| Boss A (Thick Unoptimized) | 1.2 : 1 | 0.4 | 48.2 | 31.5 | 128.4 | Brittle Root Yield at Fillet |
| Boss B (Standard Geometry) | 0.6 : 1 | 0.4 | 28.6 | 19.1 | 98.2 | Hoop Fatigue Cracking |
| Boss C (Optimized Radii & Cooling) | 0.6 : 1 | 1.0 | 14.3 | 9.8 | 64.7 | Stable Elastic Deflection |
Boss A exhibited severe thermal isolation within its 3.0 mm core, locking in a peak residual stress of 48.2 MPa due to differential cooling across the thick junction. When combined with the operational 1500 N pull-out load, local von Mises stress reached 128.4 MPa, exceeding the matrix transverse yield strength and triggering brittle crack initiation at the sharp 0.4 mm fillet. Boss B reduced residual processing stress to 28.6 MPa by eliminating core mass.
Boss C achieved the lowest combined stress state (64.7 MPa) by pairing reduced wall thickness with a generous 1.0 mm fillet radius and copper core cooling, maintaining operational safety factors well within acceptable limits.
Polycarbonate boss roots molded with a mold temperature of eighty degrees Celsius release forty-two percent of frozen orientation stress within twenty-four hours of room temperature storage.
Because friction generates shear heat and fastener insertion induces hoop strain, unaccounted residual stresses frequently drive structural failure. Analyzing mapped tensor data reveals that process-induced stress components account for twenty-five to forty percent of total stress under operational load states, proving that un-mapped structural FEA routinely miscalculates real failure thresholds.
Sink marks and localized stress concentrations stem from both resin grade characteristics and insufficient core pin cooling execution.
Bench
Validating numerical stress predictions requires physical testing on molded samples taken from standardized production runs. Process simulation models operate under idealized boundary conditions; actual shop-floor operations introduce variables like thermal fluctuations during screw recovery, check-valve leakage, mold platen deflection, and ambient humidity shifts. To verify predicted viscoelastic stress redistribution across variable thickness bosses, test engineers rely on a mix of destructive and non-destructive physical inspection protocols right after molding.
Physical bench testing bridges the gap between simulated physics and press-side execution. Cavity pressure transducers installed at boss roots provide real-time thermal-hydraulic signatures during the pack and hold phases. Optical birefringence, strain gauging, and X-ray micro-computed tomography (micro-CT) quantify frozen-in molecular strain fields, void distribution, and fiber alignment patterns within physical samples, providing empirical baseline datasets to calibrate non-isothermal simulation solvers.
Cavity Pressure Tracing at Internal Geometry Features
Monitoring pressure transmission into restricted boss features requires placing miniature flush-mounted piezoelectric pressure transducers directly inside core pin steel assemblies or at the base of the boss root wall. Standard cavity pressure sensors mounted near gates fail to detect localized pressure losses caused by early gate freezing or runner solidification. In variable thickness bosses, tracking the pressure decay curve inside the boss root reveals the precise moment polymer flow stalls and volumetric shrinkage begins un-packable thermal isolation.
Comparing measured pressure-time integrals against Moldflow FEA predicted curves validates the simulated melt compressibility and frozen skin development rate. If measured core pressure drops faster than predicted, the simulation model is underestimating heat transfer to the tool steel or overestimating material viscosity under low shear rates. Adjusting interface thermal conductivity coefficients based on empirical pressure traces aligns the predicted residual stress field with actual press-side physics.
Empirical Strain Measurements and Failure Validation
- Install flush-mounted piezoelectric pressure transducers directly opposing the target boss root geometry within the core steel.
- Record peak packing pressure and gate freeze timing across incremental pack pressure steps from 30 MPa to 90 MPa.
- Section trial parts along the longitudinal axis of the boss using a diamond wafering saw under liquid coolant.
- Measure residual optical retardance under cross-polarized light to map stress fringe order through the boss transition zone.
- Subject conditioned parts to mechanical pull-out testing at 5 mm/min while recording strain response via optical extensometry.
Optical birefringence measurements on transparent amorphous resins, such as Polycarbonate or Polymethyl Methacrylate, provide direct visual mapping of principal stress differences. When viewed under cross-polarized light, frozen-in orientation stresses appear as alternating colored fringe patterns, where fringe order correlates directly with the magnitude of residual shear stress via the photoelastic coefficient. Photogrammetric analysis of these fringe fields validates whether non-isothermal simulation accurately captured the spatial location of high-stress bands surrounding boss radii.
For opaque or fiber-reinforced semi-crystalline resins where photoelasticity is inapplicable, destructive testing via sectioning and strain gauge rosette application measures relaxed strain components. Micro-CT scanning non-destructively reveals core void dimensions and fiber orientation tensors throughout the boss volume. Comparing micro-CT fiber alignment arrays against simulated tensor fields confirms whether micro-mechanical homogenization inputs used in structural FEA reflect real fiber distribution across variable wall sections.
Compliance with DIN 16742 TG4 tolerance class mandates that boss perpendicularity stays within 0.08 mm following seventy-two hours of post-molding thermal equilibration.

Ledger
Accounting for the financial consequences of boss failures requires evaluating both upfront tooling investments and long-term production cycle times. Optimizing variable wall boss geometry using non-isothermal flow integration requires additional engineering hours during the tool design phase, alongside potential capital expenditure for specialized tool cooling hardware. However, cutting steel without performing advanced stress mapping risks catastrophic tool rework costs, extended cycle times to mask thermal defects, and high field-failure warranty liabilities when undersized or over-stressed bosses fail during assembly.
Tooling amortisation schedules depend heavily on cycle time efficiency. Incorporating conformal cooling channels or high-conductivity beryllium copper core pins increases initial mold construction costs, yet systematically reduces total cycle time by resolving localized thermal bottlenecks at boss roots. A cycle time reduction of three seconds on a multi-cavity tool running high annual volumes recovers the extra tooling capital expenditure within months of production bring-up, while simultaneously yielding parts with lower residual stress fields and tighter dimensional tolerances.

Tooling Amortization and Conformal Cooling Capital ROI
Direct metal laser sintering (DMLS) enables the fabrication of tool steel core inserts with internal conformal cooling passages that follow the exact helical contour of a boss barrel. Traditional straight-drilled cooling lines cannot approach boss root junctions without risking steel breakthrough into cavity walls. Conformal cooling channels maintain uniform water distance from polymer melt surfaces, extracting heat rapidly and homogenizing wall temperature profiles.
Evaluating the return on investment (ROI) for conformal cooling requires weighing additive manufacturing insert costs against cycle time savings and scrap reduction.
| Tooling Subsystem Architecture | Additional Tooling Cost (USD) | Cycle Time Impact (s) | Cavitation Capacity | Break-Even Volume (Units) | Landed Unit Cost Impact (USD) |
|---|---|---|---|---|---|
| Standard P20 Steel Core Pins (Uncooled) | 0 | + 4.5 | 8 Cavities | 0 | Base Baseline |
| Copper Alloy Insert (Moldmax C17200) | 3,200 | – 2.8 | 8 Cavities | 115,000 | – 0.038 |
| DMLS Conformal Cooled Tooling Core Inserts | 8,500 | – 4.2 | 8 Cavities | 240,000 | – 0.052 |
| Automated Core Pin Bubbler System | 5,100 | – 3.1 | 8 Cavities | 175,000 | – 0.041 |
A standard eight-cavity production tool operating on a $75 per hour press rate incurs significant operational penalties when cycle times extend by four seconds to cool un-optimized boss roots. Investing $8,500 in 3D-printed conformal cooling core inserts drops part cycle times by 4.2 seconds, achieving financial break-even at 240,000 production units. Beyond the break-even point, reduced cycle duration drops landed part costs while eliminating sink marks and lowering residual stress levels that trigger field returns.
Commercial Risk Allocation in Boss Integrity Defects
Tool procurement contracts must explicitly define liability thresholds for structural boss defects. Toolmakers frequently attribute surface sink marks or boss cracking to resin selection or part designer geometry mistakes, while sourcing buyers argue that poor tool steel thermal management and gating design caused the defect. Utilizing integrated non-isothermal FEA documentation as an objective technical milestone within tooling purchase orders eliminates ambiguity regarding commercial responsibility.
- Core thermal management audit verifies whether high-conductivity copper alloy cores or direct water cooling lines exist in bosses exceeding 4 mm wall thickness.
- Structural export validation checks whether the FEA mesh mapping protocol transferred anisotropic residual stress tensors or merely isotropic thermal shrinkage strains.
- Fastener drive torque specification establishes maximum assembly torque limits based on empirical hoop stress data rather than resin supplier generic tables.
- Cavity pressure decoupling signoff confirms that pack pressure control switches on cavity sensor signal rather than screw position to limit boss stress spikes.
Conformal cooling inserts in boss clusters increase initial tool expenditure by eight percent while reducing molding cycle times by four point five seconds.
Because gate sealing stops pack pressure and cycle time dictates overall production cost, writing quantitative residual stress and deformation limits directly into tool build specifications protects sourcing buyers from absorbing hidden rework expenses. When a supplier agrees to DIN 16742 tolerance classes alongside verified finite element stress mapping outputs prior to steel sign-off, commercial risk remains strictly bounded.
Material properties, cooling circuit choices, and FEA stress mapping directly dictate whether a boss design survives assembly torque without failing. When engineering teams integrate non-isothermal flow simulation results into structural solvers during preliminary tool design, tooling rework expenses drop significantly and production schedules remain intact.