Post Consumer Recyclate Lot Sampling Strategies for Quality Verification
Verify post-consumer recyclate lots using stratified multi-zone core sampling, variables acceptance criteria, and thermal analysis before silo discharge.


Dock
Incoming inspection of post-consumer recyclate (PCR) begins on the unloading bay, where physical containment determines whether a lot represents a single statistical population or an unblended sequence of distinct extrusion runs. A delivered dry bulk tanker containing 25 metric tons of washed post-consumer high-density polyethylene (HDPE) flakes does not behave like prime virgin resin pelleted from a continuously stirred tank reactor. Virgin polymer enters the receiver with a predictable melt index tolerance band of plus or minus five percent around the nominal datasheet value.
Post-consumer lots arrive with cross-contamination, variable molecular mass distributions, and non-uniform particulate burdens across packaging units. Acceptance sampling under these conditions serves as an operational filter designed to reject contaminated lots before unloading into silos.
Silo loading without verified batch sampling distributes cross-contamination across entire inventory banks, turning a single off-grade container into twenty days of moulding scrap. Sampling protocols applied to virgin polymer fail when applied directly to recyclates. Standard bulk plastics verification methods, such as those governed by ASTM D1898 (withdrawn but widely practiced) or ISO 5667 series adaptations, rely on assumptions of bulk homogeneity.
If a processor receives twenty bulk bags (FIBCs) totaling 20,000 kilograms of post-consumer polypropylene (PP) intended for automotive battery trays, testing five composite pellets pulled from the surface of the nearest bag yields meaningless analytical data. Density variations, legacy pigments, and cross-polymer fractions segregate during transit.
Consigning a non-conforming lot into a plant storage silo multiplies sorting and purge costs across all connected injection barrels.
The receiver treats every incoming delivery as an unverified assembly of discrete production sub-lots. Unloading proceeds only after composite testing confirms that melt mass-flow rate, intrinsic viscosity, or bulk density fall within predetermined statistical acceptance intervals. The commercial stakes require this rigor: resolving off-grade resin disputes after material discharges into storage vessels voids raw material rejection covenants, converting a vendor defect into in-house production regrind.
The buyer records bag seals, container lot codes, and gross tare weights on the delivery receipt before probing bags. Discrepancies between shipping documentation and bag labeling halt unloading. When a trailer shows multiple compounder lot identifiers distributed arbitrarily across pallet rows, the sampling plan shifts from composite bulk evaluation to isolated unit sampling, treating each identified batch as an autonomous population.


Thief
Physical acquisition of representative solid polymer samples requires tools adapted to pellet size, flake aspect ratio, and container depth. Surface grabs introduce severe bias due to particulate segregation during truck transport; smaller flakes, mineral fillers, and residual grit settle toward container floors, while bulkier flakes ride near the top. Technicians counter this mechanical stratification by using compartmented concentric zone samplers, commonly termed slot-thief or grain probes, manufactured from electropolished 316 stainless steel to eliminate static adhesion and surface contamination.
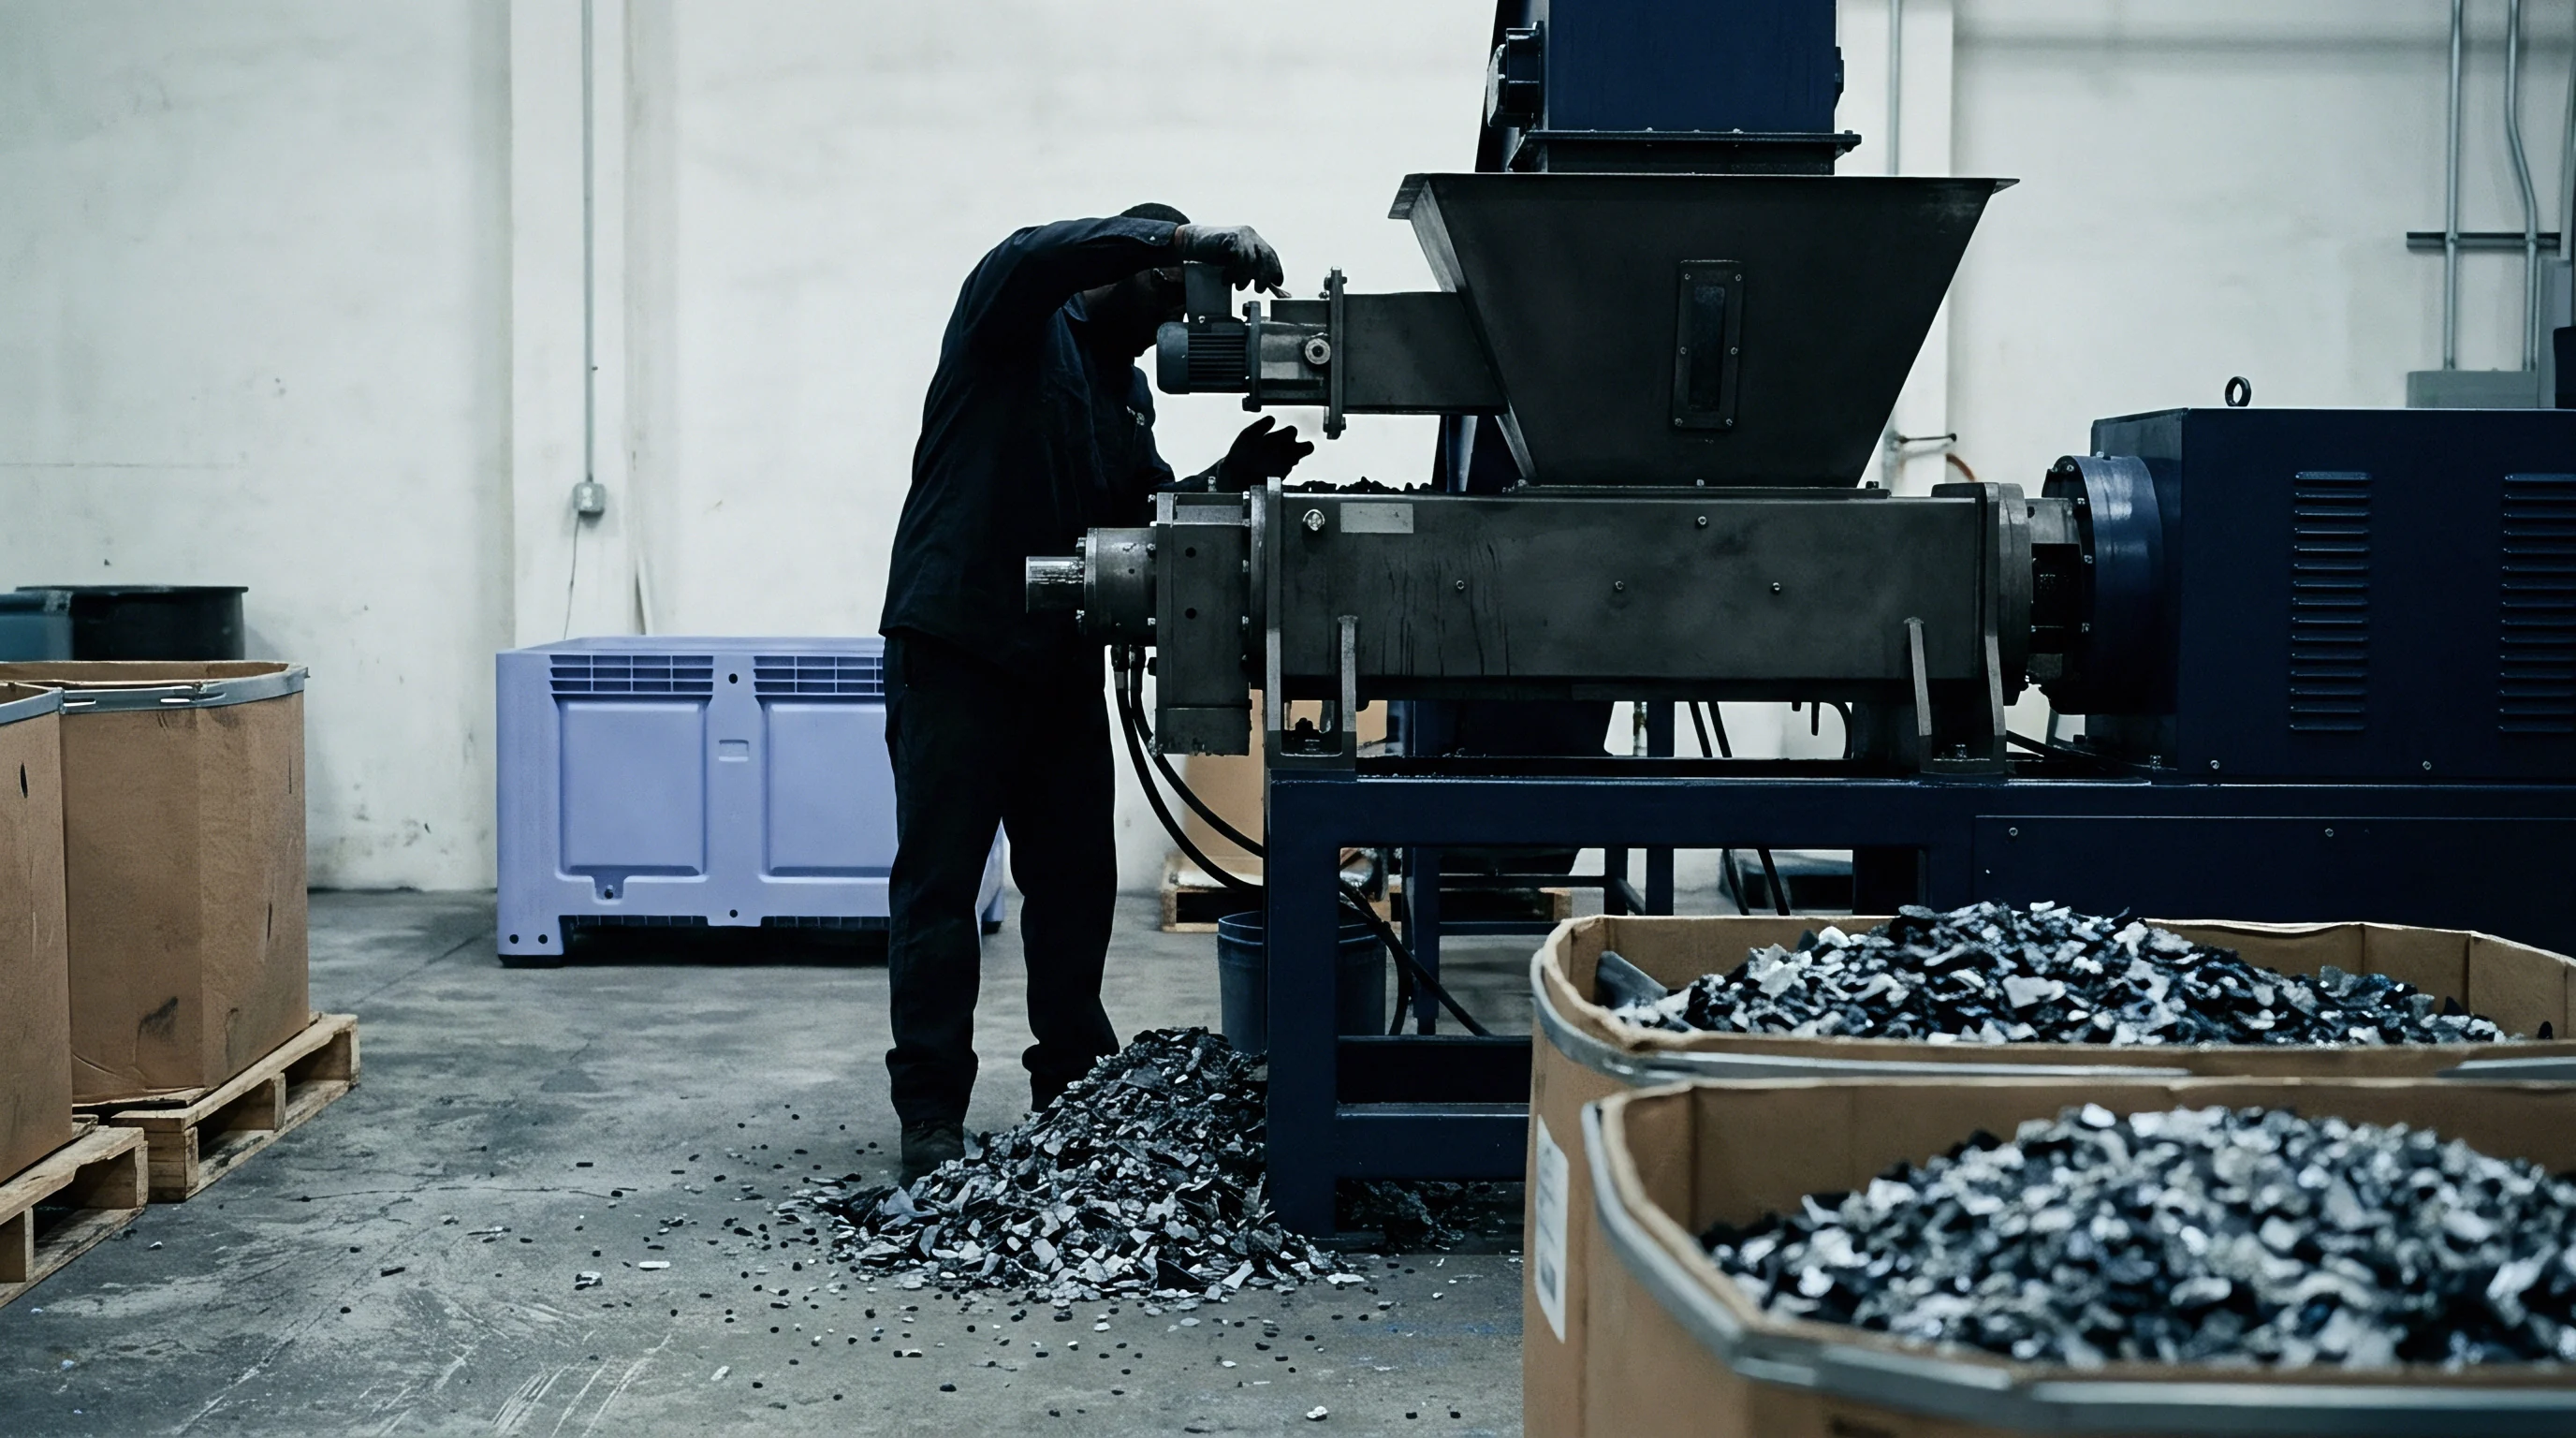
Concentric Zone Samplers for Bulk Containers
For a standard 1,000-kilogram bulk bag, the sampler deploys a dual-tube instrument measuring 40 millimeters in outer diameter and 1.5 to 2.0 meters in length. The inner tube features milled extraction pockets that align with outer slots upon mechanical rotation of the t-handle. The inspector drives the probe diagonally from the top corner through the geometric center to the opposite bottom quadrant while the pockets remain closed.
Once the tool achieves target depth, the operator rotates the inner handle 180 degrees to open the sampling windows, vibrates the body to drop pellets into the internal chambers, rotates back to seal, and extracts the core.
Extracted material remains segregated by depth zone during qualification trials. Analyzing top, middle, and bottom chambers separately detects vertical segregation of fine particulate contaminants and cross-polymer impurities. In standard lot acceptance verification, the operator discharges all zones into a conductive grounding vessel to form the primary sample increment.

Pneumatic Diverters and Automated Stream Catchers
Bulk railcar or silo-truck deliveries require cross-stream diverter valves located at pneumatic discharge points rather than manual probing. Manual top-hatch probing on railcar compartments introduces safety hazards and fails to sample bottom-cone zones. Automatic sweep-arm samplers intercept the dilute-phase conveying pipe behind the rotary airlock, extracting a predetermined pellet mass at timed volumetric intervals.
The diverter operates on a fixed timer linked to line velocity, gathering fifty grams every three hundred kilograms conveyed.
The mechanical interface demands clean internal seals. Elastomeric seals degraded by mineral fines or polyolefin waxes drag material between lots, compromising sample fidelity. Stainless steel slide gates with self-cleaning wiper seals eliminate inter-lot contamination.
| Vessel Type | Tool Geometry | Material of Construction | Extraction Volume per Insertion | Targeted Physical Defect |
|---|---|---|---|---|
| Bulk Bag (FIBC) | Slot-thief, 40 mm OD, 1.8 m length | 316 Stainless, electropolished | 250 to 350 grams | Vertical stratification of flakes, chalk settling |
| Octabin (Gaylord) | Trier, 32 mm OD, angled tip, 1.2 m | 304 Stainless, passivated | 150 to 200 grams | Core-to-wall fines segregation, masterbatch drift |
| Pneumatic Transfer Line | Automated cross-cut diverter plunger | Hard chrome plated steel, PTFE wiper | 50 grams per discharge cycle | Temporal melt flow drift across continuous batch |
| 25 kg Valve Bag | Single-tube spear sampler, 20 mm OD | Anodized aluminum alloy | 40 to 60 grams | Lot blending inconsistencies across bag palletization |
Tool dimensions dictate sample validity. Probing flake recyclates with a narrow twenty-millimeter grain spear bridges the intake ports, excluding broad, irregular flakes and preferentially capturing granular fines. The slot aperture must exceed three times the maximum particle length of the largest recycled flake dimension.
Probing failures void subsequent laboratory analyses.
Standard clauses in quality agreements define sampler dimensions directly. When an incoming dispute reaches arbitration, the compounder inspects the receiving tool geometries; proving that an undersized sampler excluded target particle fractions renders the buyer’s non-conformance claims indefensible.


Strata
Establishing the required number of physical sampling units demands statistical rigor derived from international standards rather than arbitrary shop-floor habits. ISO 2859-1 provides acceptance sampling systems indexed by acceptance quality limit (AQL) for lot-by-lot inspection of discrete items, while ISO 3951-1 governs variables inspection when measuring continuous material parameters like melt flow rate. Because post-consumer resin lots contain variable within-lot variances, sampling plans combine attribute checks for gross contamination with variables testing for mechanical and rheological stability.

Are Acceptance Sampling Tables Directly Transferable to Recyclate Lots?
Direct application of standard virgin polymer sampling tables understates post-consumer recyclate variance by a factor of three. Virgin resin production lots present typical intra-batch coefficients of variation below two percent for melt flow rate. Mechanical recycling lots derived from curbside post-consumer packaging frequently exhibit intra-lot melt flow coefficients of variation ranging between eight and fifteen percent.
Calculating sample size begins with determining the number of discrete shipping containers, denoted as N. For a delivery of N = 40 octabins of recycled high-density polyethylene pellets (approximate net weight 40,000 kilograms), standard General Inspection Level II under ISO 2859-1 indicates Sample Size Code Letter J, designating a primary sample of eight individual containers to be probed. For post-consumer lots with unproven compounder capability, the sampling plan mandates Level III or variable square-root allocation to control producer and consumer risk.
Under the square-root rule, the number of containers sampled, n, follows the relation:
n = 1 + √N
For a shipment where N = 40 containers, this calculation yields:
n = 1 + √40 = 1 + 6.32 = 7.32 → 8 containers
When past vendor audit data demonstrates elevated batch inconsistency, the quality manual shifts to the intensified rule, n = 1.5 × √N, which mandates ten containers for the same shipment size.
ASTM D1898 establishes that primary sample increments drawn from stratified units preserve their integrity only when combined through standardized mechanical riffling.
The operator draws primary sample increments of identical mass from each selected container. If the protocol requires eight containers, the inspector extracts 500 grams from each container using the multi-zone thief, producing a four-kilogram gross composite sample. The laboratory homogenizes this composite via a rotary splitter or riffle box (Jones splitter) before taking analytical test specimens.
Riffling divides the material into equal representational halves, preventing operator shaking from segregating dense, mineral-filled flakes from unpigmented polyolefins.
The processing history of post-consumer resin dictates whether testing occurs on the composite blend or on individual container extracts. Testing only composite blends obscures intra-lot variance. If two containers in an eight-container sample have a melt flow index of 0.8 g/10 min while six containers display 2.2 g/10 min, the composite test returns 1.85 g/10 min.
That figure passes the nominal procurement specification of 2.0 ± 0.4 g/10 min (2.16 kg, 190 °C). However, running those containers sequentially on a high-speed blow-moulding line causes continuous parison sag and wall thickness failures.
- Container selection mapping designates specific container numbers through pseudo-random number generation before the truck enters the dock bay.
- Primary increment extraction collects 500 grams per target container using multi-zone slot samplers driven diagonally through the material body.
- Gross sample division processes the combined increments through an enclosed sixteen-slot Jones riffle splitter down to analytical aliquots of 250 grams.
- Retention split archiving preserves one half-split aliquot under hermetic nitrogen seal for thirty days to serve as a legal re-test baseline.
The cost of under-sampling manifests immediately in compounding line performance. Processing untested variance causes excessive barrel pressure spikes, screw stalls, and out-of-round extruded profiles that scrap complete production runs.


Assay
Analytical verification of the prepared sample verifies material composition and processing characteristics against the technical data sheet. Post-consumer lots contain thermal degradation markers, residual cross-polymers, volatile organic contents, and particulate impurities that do not occur in virgin polymers. Testing proceeds through a tiered sequence, moving from rapid bench checks to specialized thermo-analytical and spectroscopic characterization.
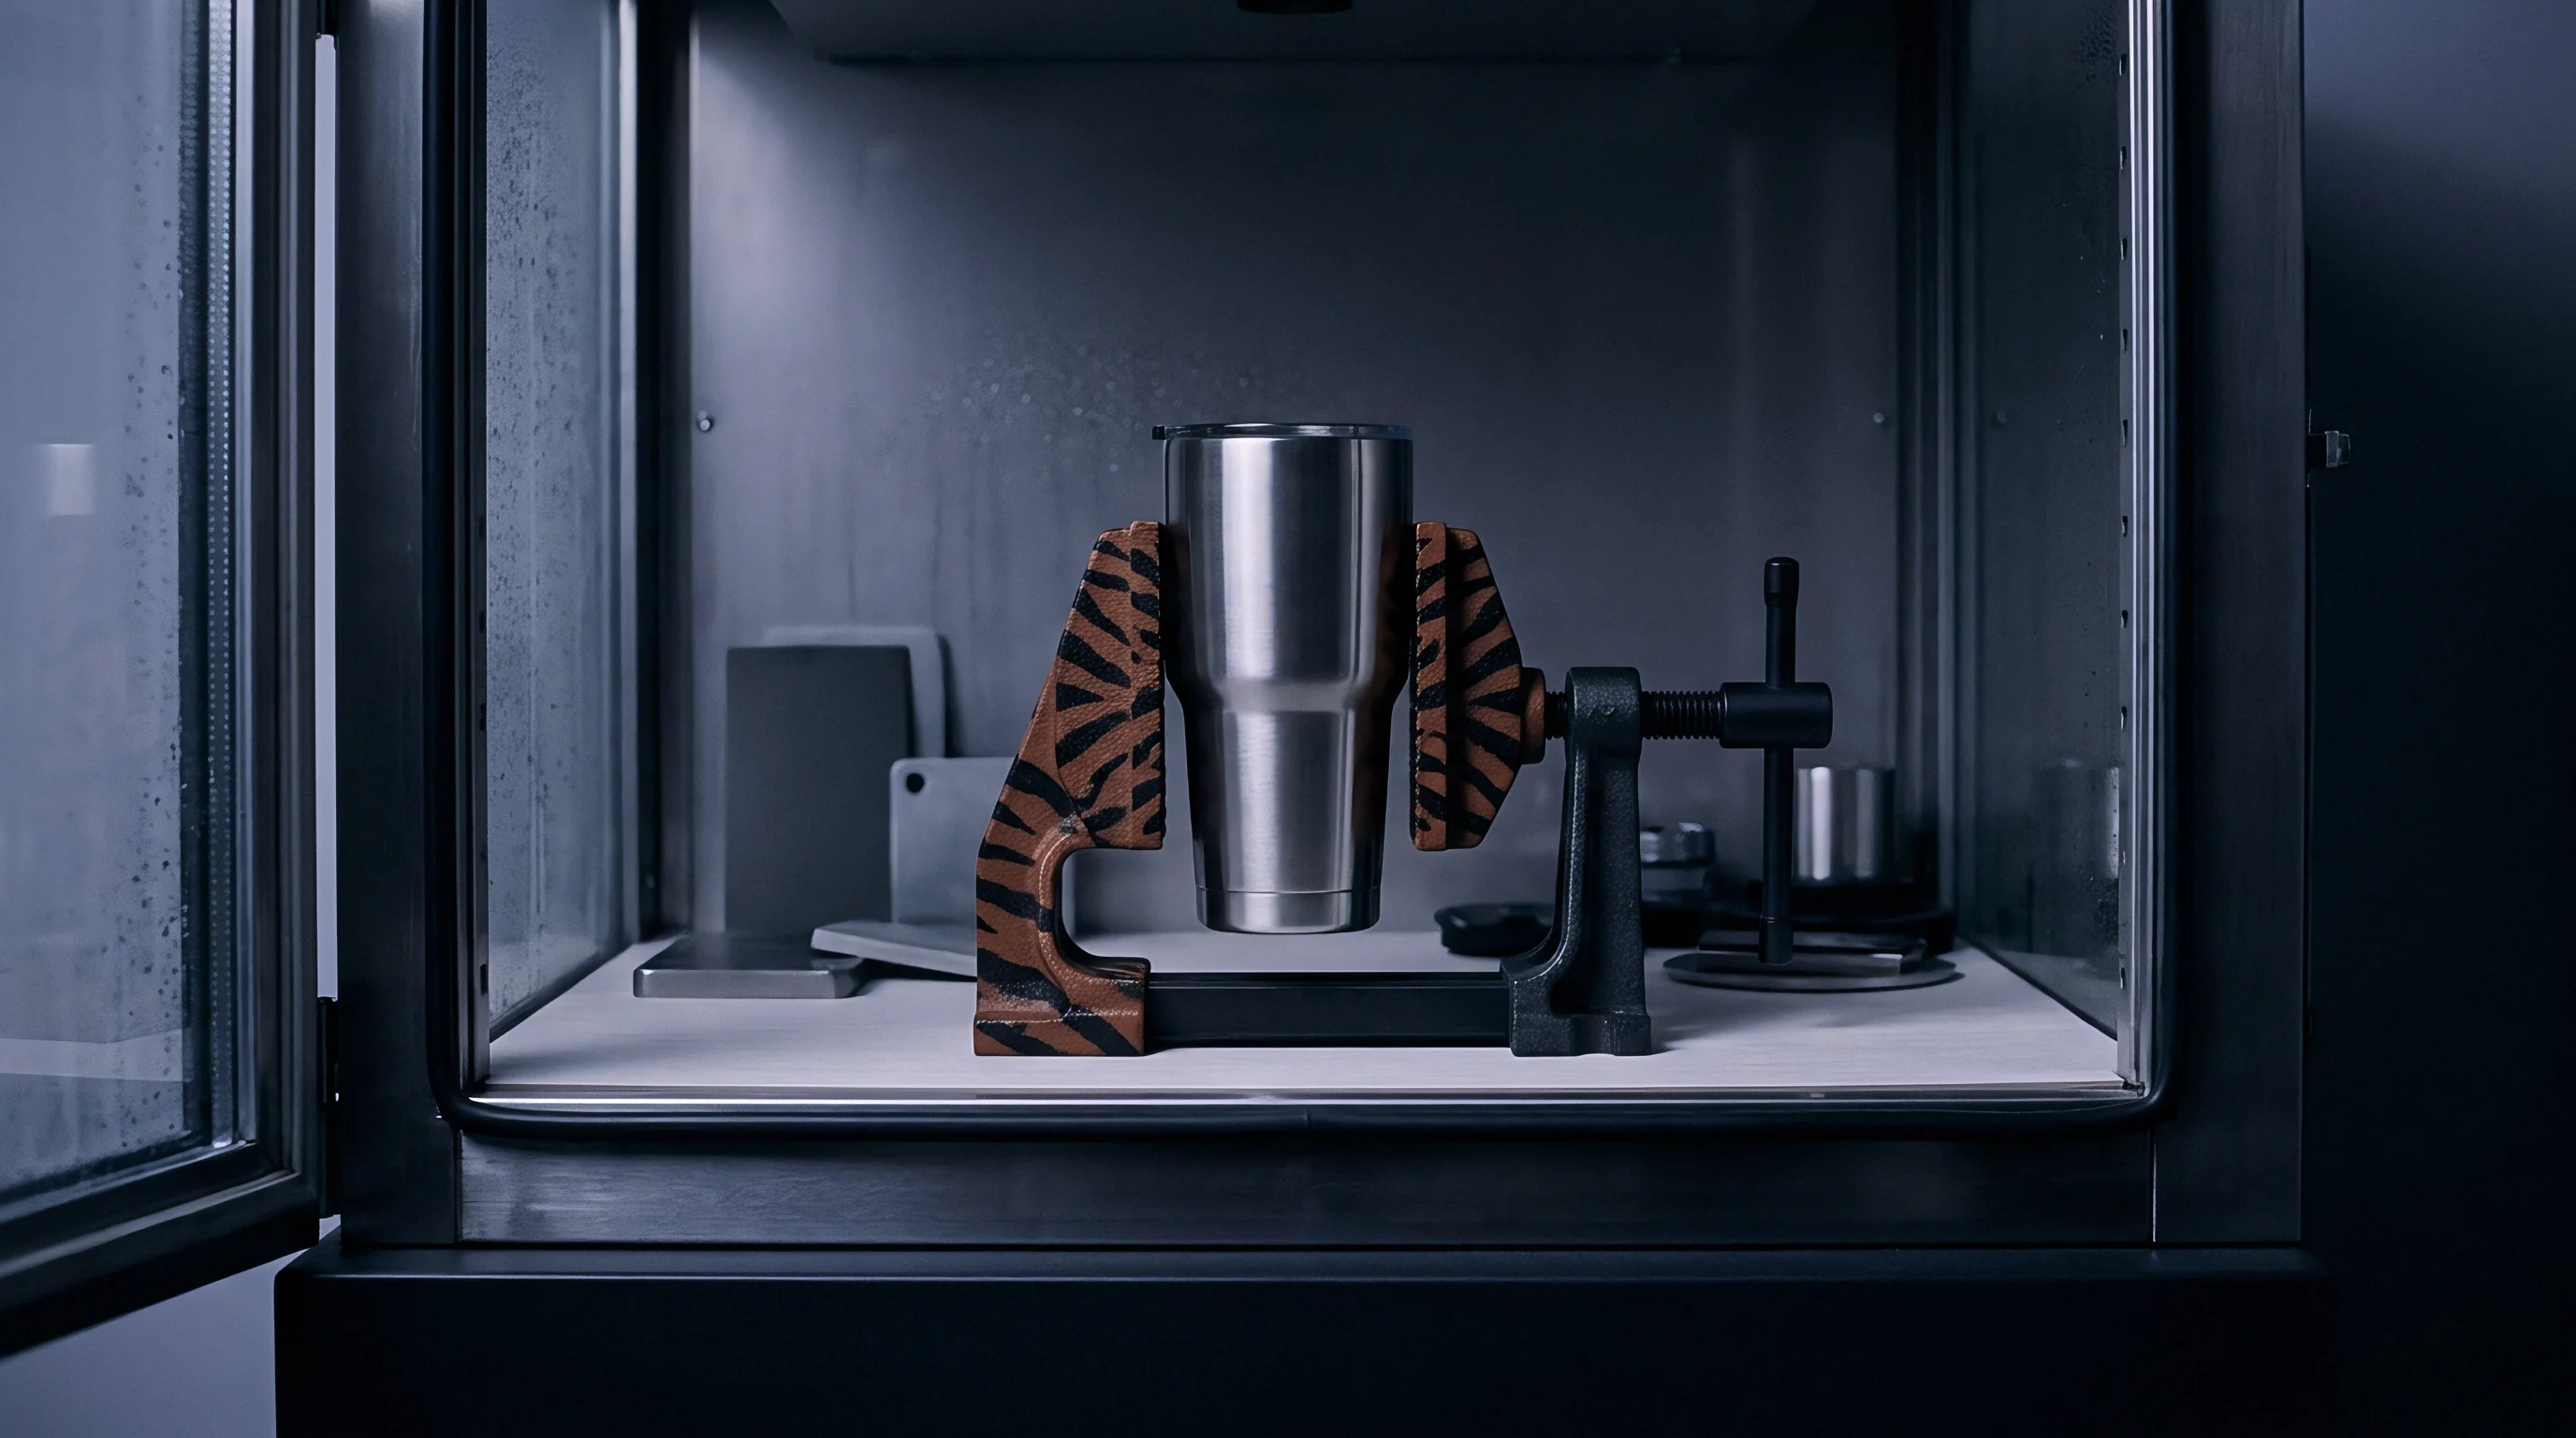
Melt Flow Rate and Rheological Instability
Melt mass-flow rate (MFR) testing follows ISO 1133-1 (Method A or B) or ASTM D1238. For post-consumer polypropylene, the standard condition applies 230 °C under a 2.16 kg load. For post-consumer polyethylene, tests run at 190 °C under 2.16 kg, supplemented by high-load tests at 21.6 kg to calculate the High Load Melt Index (HLMI) and derive the Shear Stress Response (MFR ratio 21.6 kg / 2.16 kg).
This ratio serves as an immediate proxy for molecular weight distribution breadth.
Post-consumer polyolefins subjected to multiple heat histories exhibit distinct rheological shifts. Polypropylene experiences β-scission of the polymer backbone, increasing MFR over successive cycles. Polyethylene undergoes radical-driven chain branching and cross-linking, decreasing MFR while elevating melt elasticity and die swell.
A standard test run records the initial MFR along with the continuous melt stability over a twenty-minute residence time in the barrel. A drift in MFR exceeding fifteen percent during extended barrel residence confirms that the compounder under-dosed the secondary antioxidant package (hindered phenols and phosphites), leaving the polymer vulnerable to degradation during final product moulding.

Differential Scanning Calorimetry for Contamination Detection
Differential Scanning Calorimetry (DSC) conducted according to ISO 11357-3 identifies foreign polymer fractions within the base resin. In recycled high-density polyethylene derived from post-consumer milk bottles, PP contamination from bottle caps and labels represents an operational defect. The presence of polypropylene degrades the low-temperature notched impact strength and Environmental Stress Crack Resistance (ESCR) of the moulded part.
The heating cycle runs from −50 °C to 200 °C at a controlled rate of 10 °C per minute under dry nitrogen. The thermogram resolves distinct endothermic melting peaks: HDPE melts in the range of 128 °C to 134 °C, whereas polypropylene fractions produce a melting peak between 160 °C and 166 °C. Integrating the area under the PP endothermic peak against the theoretical heat of fusion for 100 percent crystalline PP (typically 207 J/g) yields the precise mass percentage of PP contamination.
A differential scanning calorimetry run showing a secondary melting peak at 163 °C identifies polypropylene contamination that reduces low-temperature impact strength in polyethylene grades.
Specifications for high-performance post-consumer blow moulding grades cap polypropylene contamination at 2.0 percent by mass. Batches exceeding 5.0 percent PP contamination produce phase separation, poor weld-line strength, and brittle part drop failures.
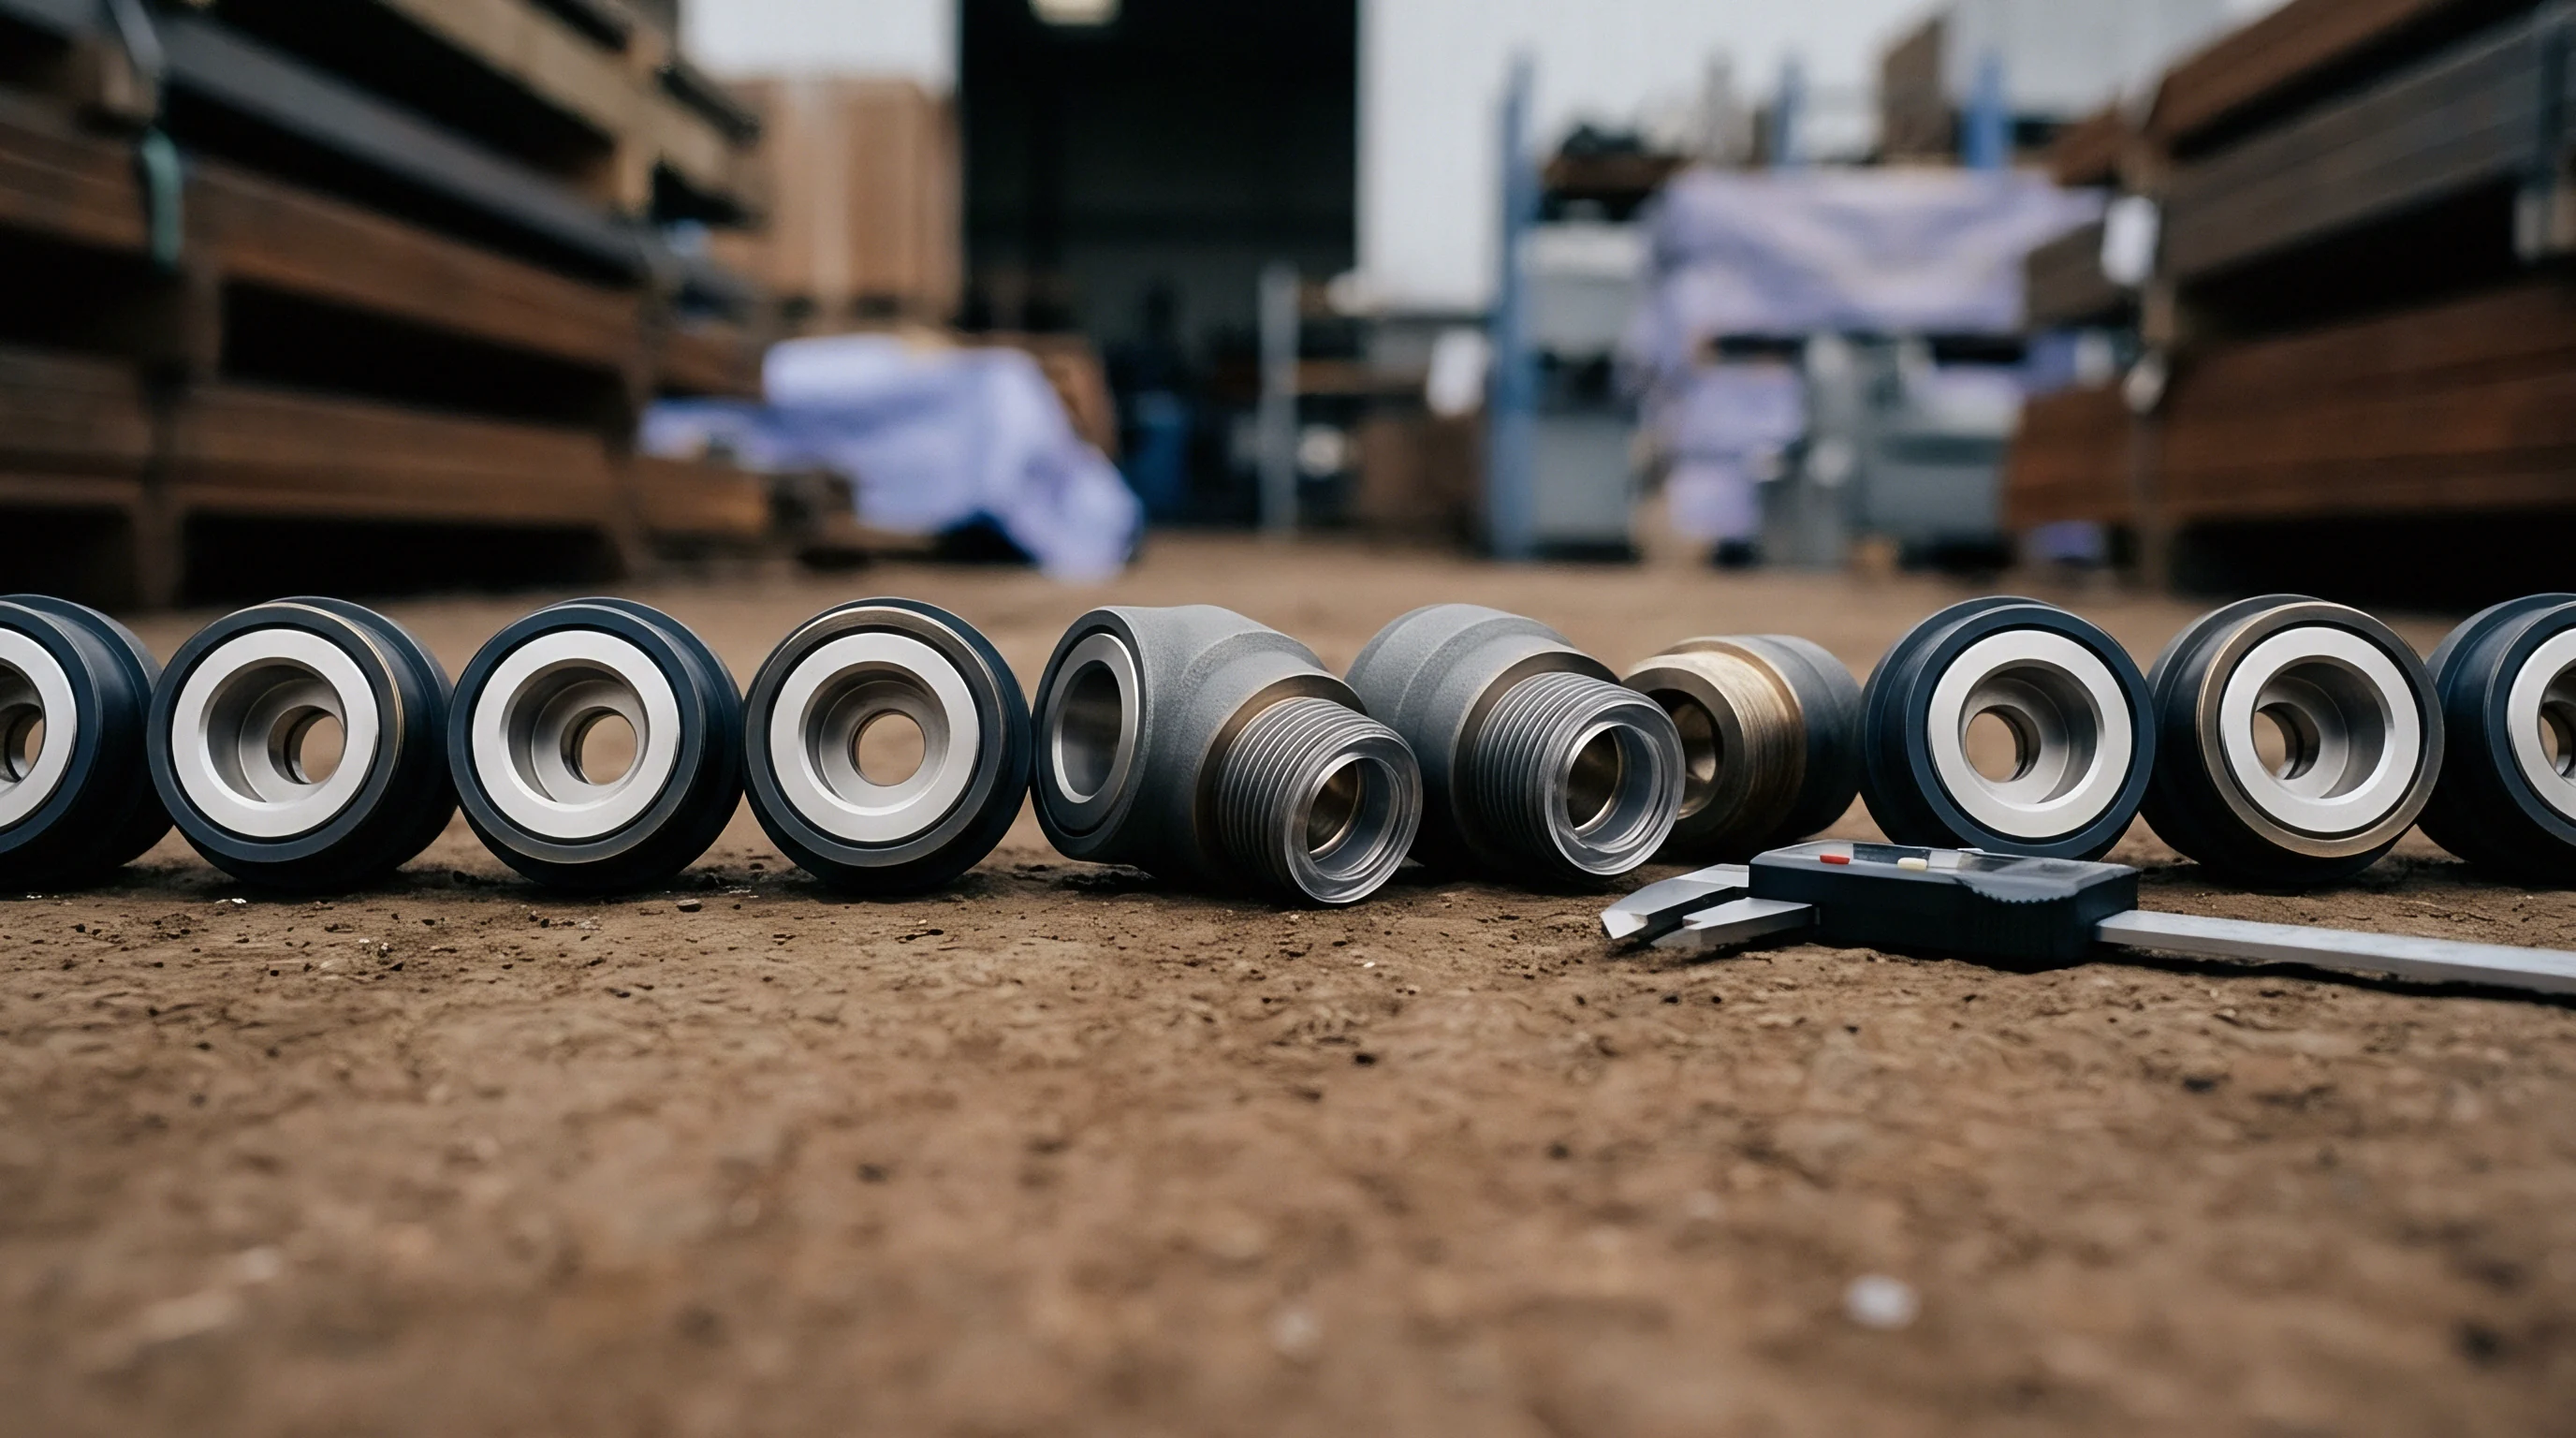
Thermogravimetric Analysis and Ash Content Determination
Inorganic contamination, including mineral fillers (calcium carbonate, talc), masterbatch carrier residues, and processing grit, undergoes quantification via Thermogravimetric Analysis (TGA) per ISO 11358-1 or muffle furnace combustion per ISO 3451-1. The furnace method heats a dry two-gram sample in a porcelain crucible to 600 °C ± 25 °C until all carbonaceous polymer decomposes to carbon dioxide and water vapor.
Virgin natural polyolefins leave an ash residue below 0.05 percent by mass. Clean post-consumer recycling grades show ash levels between 0.2 and 1.5 percent, consisting of residual slip agents, titanium dioxide pigments, and fine road dirt that escaped wash lines. Recyclate compounders sometimes add fine calcium carbonate (CaCO3) as an inexpensive desiccant and density modifier.
If the ash test records three percent residue in a lot ordered as an unfilled natural copolymer, the supplier has adulterated the stream with mineral filler, increasing final part weight and shifting the flexural modulus beyond the design window.
Moisture analysis by Karl Fischer titration or loss-on-drying balances (ISO 15512) serves as the gatekeeper test for condensation polymers like post-consumer polyethylene terephthalate (rPET) or polyamide (rPA). Unfilled rPET flakes hold hygroscopic and surface moisture up to 0.5 percent (5,000 ppm). Extruding rPET without desiccant drying to a moisture ceiling below 50 ppm causes rapid hydrolytic degradation, severing ester linkages, dropping intrinsic viscosity below 0.70 dL/g, and creating brittle preforms with low top-load performance.
| Test Parameter | Standard Reference | Prescribed Test Conditions | Passing Tolerance Limit | Impact of Non-Conformance |
|---|---|---|---|---|
| Melt Mass-Flow Rate (MFR) | ISO 1133-1 Method B | 190 °C / 2.16 kg (HDPE), 230 °C / 2.16 kg (PP) | ± 20% of agreed nominal | Short shots, flash, cycle time drift, erratic fill |
| Polypropylene Contamination | ISO 11357-3 (DSC) | 10 °C/min, 2nd heating cycle, nitrogen atmosphere | ≤ 2.0% mass fraction | Embrittlement, low-temperature drop impact failure |
| Ash / Mineral Content | ISO 3451-1 Method A | 600 °C ± 25 °C, porcelain crucible to constant mass | ≤ 1.5% mass fraction | Increased part density, screw barrel wear, flexural stiffening |
| Polymer Density | ISO 1183-1 Method A | 23.0 °C ± 0.1 °C, immersion gradient column | Agreed target ± 0.003 g/cm³ | Wall thickness variance, volumetric shot calculation errors |
| Intrinsic Viscosity (rPET) | ISO 1628-5 | Ubbelohde viscometer, dichloroacetic acid, 25 °C | 0.78 to 0.84 dL/g | Preform blow blow-outs, low bottle top-load collapse |
Executing this analytical matrix requires calibrated laboratory equipment and disciplined sample preparation. Skipping the secondary melting curve during DSC testing yields misleading baselines, as the polymer’s thermal history from previous reprocessing obscures true melting transitions.
The compounder may argue that variations in ash content represent harmless pigment dispersion. This assertion fails to account for processing reality: abrasive pigments like titanium dioxide accelerate tool steel wear, while unmicronized calcium carbonate particles initiate mechanical cracks under sustained dynamic loads.
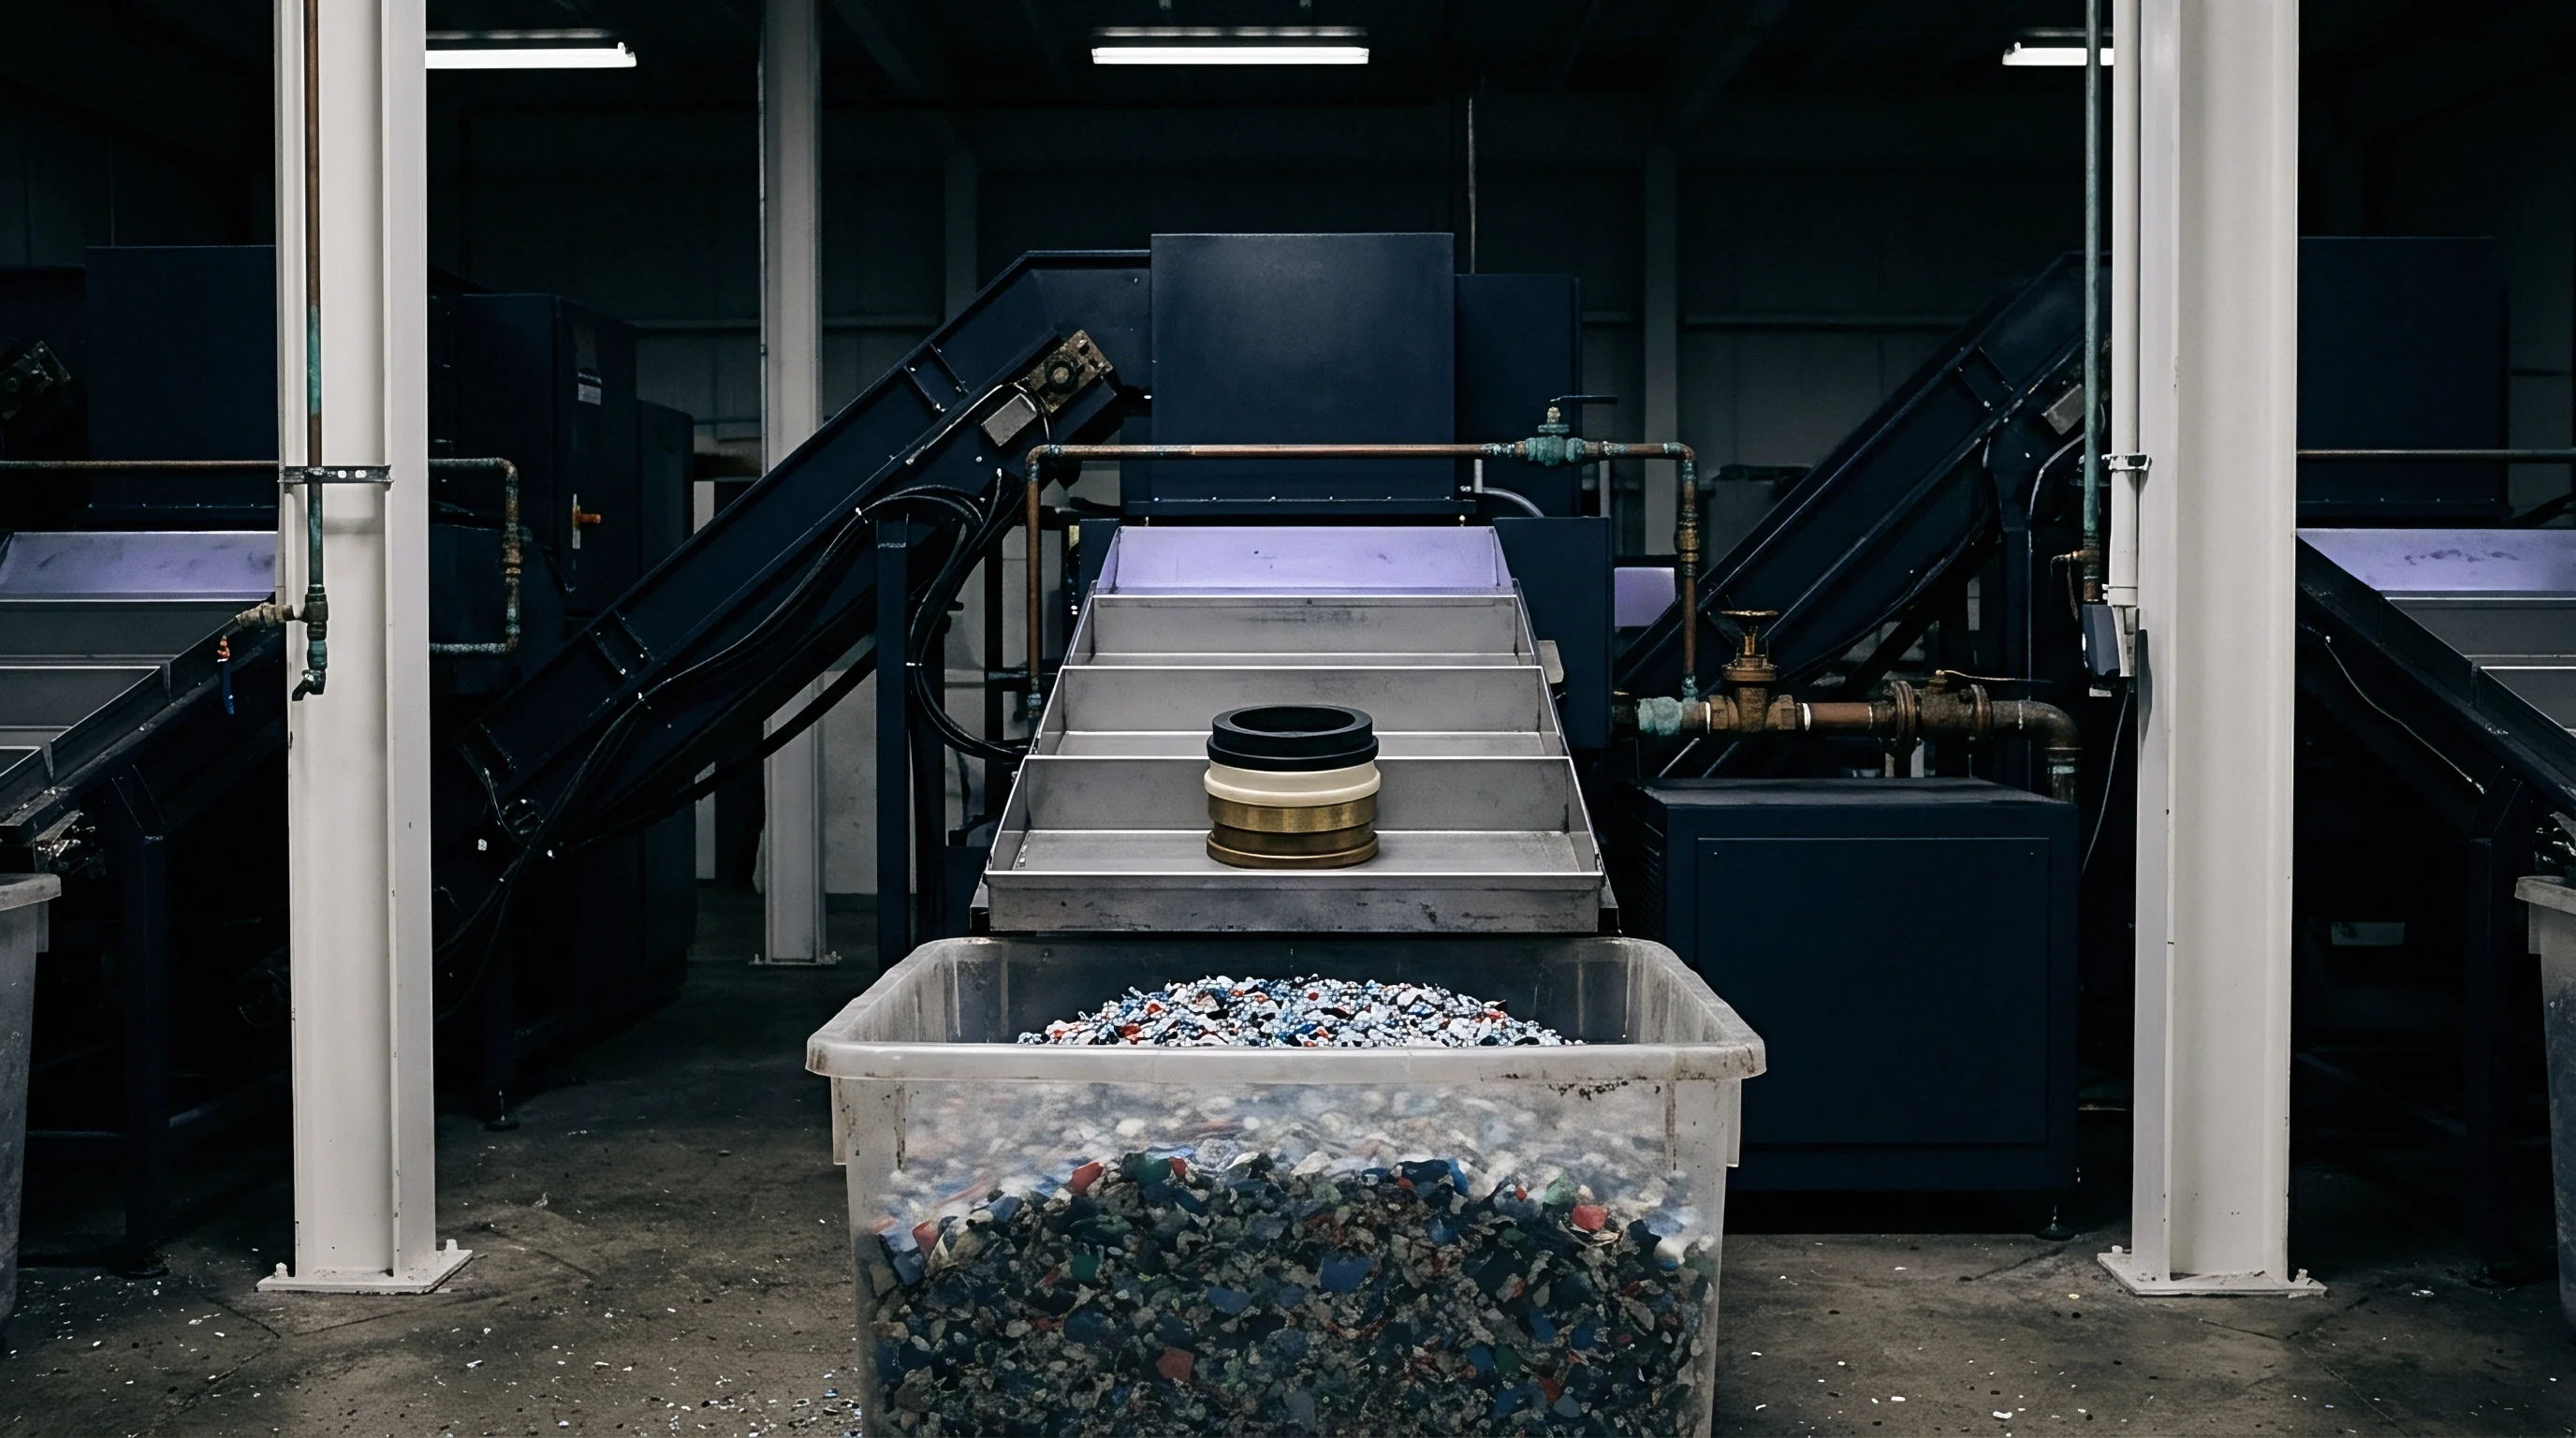

Drift
Understanding quality variation in post-consumer materials requires separating the random intra-lot variance within a single delivery from the systematic inter-lot drift that occurs across monthly shipping schedules. A sourcing contract may define an rHDPE grade with an MFR of 1.2 g/10 min (190 °C, 2.16 kg). Over six months, successive shipments can migrate toward 2.4 g/10 min as municipal bale collection compositions change from winter milk bottles to summer detergent containers.

Are Single-Point Acceptance Windows Sufficient for Process Control?
Single-point acceptance specifications fail to capture long-term rheological drift, allowing borderline material to pass incoming inspection until tool setups fail. An operational lot sampling program evaluates process capability indices (Cpk) dynamically across sequential shipments. Calculating Cpk requires tracking the parameter mean (μ) and standard deviation (σ) against the Upper Specification Limit (USL) and Lower Specification Limit (LSL):
Cpk = min
Virgin polyolefins routinely achieve Cpk values greater than 1.67, confirming a high level of process capability. Post-consumer compounders operate between 0.80 and 1.10. An engineer who relies on a basic Certificate of Analysis (CoA) without running statistical cross-checks accepts batches whose natural distribution overlaps the rejection limits, guaranteeing periodic production drops.
Worked Calculation of Quality Acceptance Risk
Consider a sourcing scenario where an automotive molder procures twenty lots of post-consumer polypropylene copolymer compound over a calendar quarter. The commercial contract defines an MFR limit of 12.0 ± 2.5 g/10 min (USL = 14.5 g/10 min, LSL = 9.5 g/10 min, tested at 230 °C / 2.16 kg per ISO 1133-1).
The quality control laboratory tests a 16-point stratified random sample per 20-ton delivery. The analytical data over five consecutive deliveries reveals the following statistical profile:
- Delivery Lot Alpha yields a sample mean of 11.8 g/10 min with a lot standard deviation of 0.45 g/10 min, producing an acceptable Cpk of 1.70.
- Delivery Lot Beta shifts to a sample mean of 12.4 g/10 min with a broader lot standard deviation of 0.85 g/10 min, lowering Cpk to 0.82.
- Delivery Lot Gamma reports a sample mean of 13.5 g/10 min with an identical standard deviation of 0.85 g/10 min, driving Cpk down to 0.39.
- Delivery Lot Delta holds a sample mean of 14.1 g/10 min with a tight standard deviation of 0.30 g/10 min, placing the distribution near the specification edge with a Cpk of 0.44.
Lot Gamma presents a critical operational hazard. Although the compounder’s Certificate of Analysis quotes an MFR of 13.5 g/10 min (technically inside the 14.5 g/10 min specification ceiling), the true batch distribution reveals that approximately 12 percent of the resin in this shipment exceeds the upper melt index boundary. Molding structural components from this lot introduces flash, structural voids, and reduced izod impact resistance.
Under an acceptance sampling regime using variables evaluation per ISO 3951-1, acceptance hinges on the quality statistic QU:
QU = (USL − x̄) / s
For Lot Gamma: QU = (14.5 − 13.5) / 0.85 = 1.0 / 0.85 = 1.176. For a normal inspection plan at an AQL of 2.5 percent with a sample size of 16, the required critical acceptability constant k equals 1.45. Because the calculated QU (1.18) falls below the threshold constant (1.45), the receiving engineer rejects the delivery despite the mean CoA value falling within the specification window.
Rejection under variables sampling prevents downstream processing disruptions. Returning Lot Gamma saves the moulding floor from extended down-time, excess tool maintenance, and defective finished goods inventories.
A supplier often claims that an elevated melt flow rate poses no harm because the material flows easily into thin-walled tools. This justification overlooks basic polymer physics: higher melt flow in post-consumer streams stems from chain scission and molecular degradation, which reduces elongation at break and degrades long-term stress crack endurance.


Gate
The gate represents the commercial translation of analytical verification: the point of formal transfer of risk where an unverified delivery converts into accepted inventory or a rejected shipment. When incoming inspection identifies a non-conforming lot, the receiving facility implements an unambiguous commercial protocol to protect both process operations and the company’s financial interests.
Clear contractual covenants define the legal grounds for material rejection. Standard commercial terms must specify test methodologies, environmental parameters, and precise sampling frequencies. Without explicit terms, a compounder can challenge a rejection claim by arguing that the buyer used non-standard test methods or inappropriate sample preparation techniques.

Non-Conformance Protocol and Counter-Testing Timelines
Upon detecting a non-conformance via variables sampling, the receiving engineer halts container discharge and files an electronic quarantine hold within four hours. The quarantine notice isolates the transport trailer or seals the individual pallet rows. The buyer transmits an analytical non-conformance notice to the compounder within twenty-four hours, providing complete test records: the raw DSC curves showing extraneous polymer peaks, MFR run logs indicating out-of-spec viscosity, or TGA traces confirming excessive mineral ash.
The quality agreement provides the supplier a strict five-day window to review primary analytical data and accept return freight charges. If the compounder challenges the findings, the parties activate the retained analytical split sample. The archived split, prepared during the initial Jones riffling sequence and stored under dry nitrogen, ships to an agreed ISO/IEC 17025 accredited third-party analytical laboratory.
The independent laboratory’s findings govern the commercial resolution; if the test confirms the out-of-specification result, the vendor reimburses both the testing expenses and freight demurrage costs.
Commercial contracts include specific price-adjustment and lot-disposition clauses to handle off-spec deliveries pragmatically:
- Outright rejection and return applies when polymer contaminants (such as PP in HDPE exceeding 3.0 percent, or PVC in PET exceeding 50 ppm) degrade core mechanical safety properties. The vendor covers round-trip freight and replaces the volume within ten business days.
- Commercial price adjustments apply when properties drift marginally beyond specifications (such as an MFR drift of 15 to 25 percent) without risking catastrophic processing failures. The buyer discounts the invoice by 150 to 300 euros per metric ton to offset necessary cycle-time extensions and stabilizer dosing.
- Sorting and reprocessing recharges cover instances where physical contamination (such as oversized aggregate flakes or degraded color flecks) requires secondary melt filtration or optical sorting. The buyer debits the compounder for all machine hours, labor costs, and scrap losses incurred during cleanup.
Relying on informal, verbal agreements with recycling vendors leaves the processing facility exposed to commercial write-downs. Commercial disputes over recycled resin invariably settle on objective test records and strict adherence to defined sampling protocols. A rigorously structured sampling program, coupled with systematic analytical verification, provides the baseline evidence needed to protect compounding operations, safeguard brand equity, and ensure delivered parts perform reliably in service.