Optimizing Ogden Parameter Regressions across Equal and Unequal Biaxial Deformation Modes
Normalizing residuals across unequal and equal biaxial modes locks Ogden parameters to physical strain paths, preventing corner thinning and costly tooling re-cuts.


Rig
Equal biaxial tension tests expand an elastomeric specimen uniformly along two orthogonal axes, producing identical stretch ratios where principal stretch one matches principal stretch two. Unequal biaxial tension pulls the specimen along those same orthogonal axes at independent rates, generating distinct stretch ratios across the plane. Planar tension fixtures hold one axis fixed at unit stretch while extending the perpendicular axis, creating an intermediate state between simple tension and equibiaxial extension.
True operational parts experience strain paths scattered across the entire biaxial domain rather than neat points along pure deformation paths.
Biaxial tension alters material response. The hyperelastic strain energy function developed by Ogden models rubberlike solids by expressing the strain energy potential as a direct series of principal stretches rather than strain invariants. Regressions calibrated solely against uniaxial tension and equibiaxial extension data fit those two lines accurately, yet the resulting parameter sets diverge when applied to unequal biaxial stretch states.
The parameter set produces unphysical stress spikes or unpredicted softenings along intermediate deformation trajectories.
Unequal biaxial stretch fields generate localized thinning variations exceeding eighteen percent when fitted parameters lack multi-axial planar constraints.
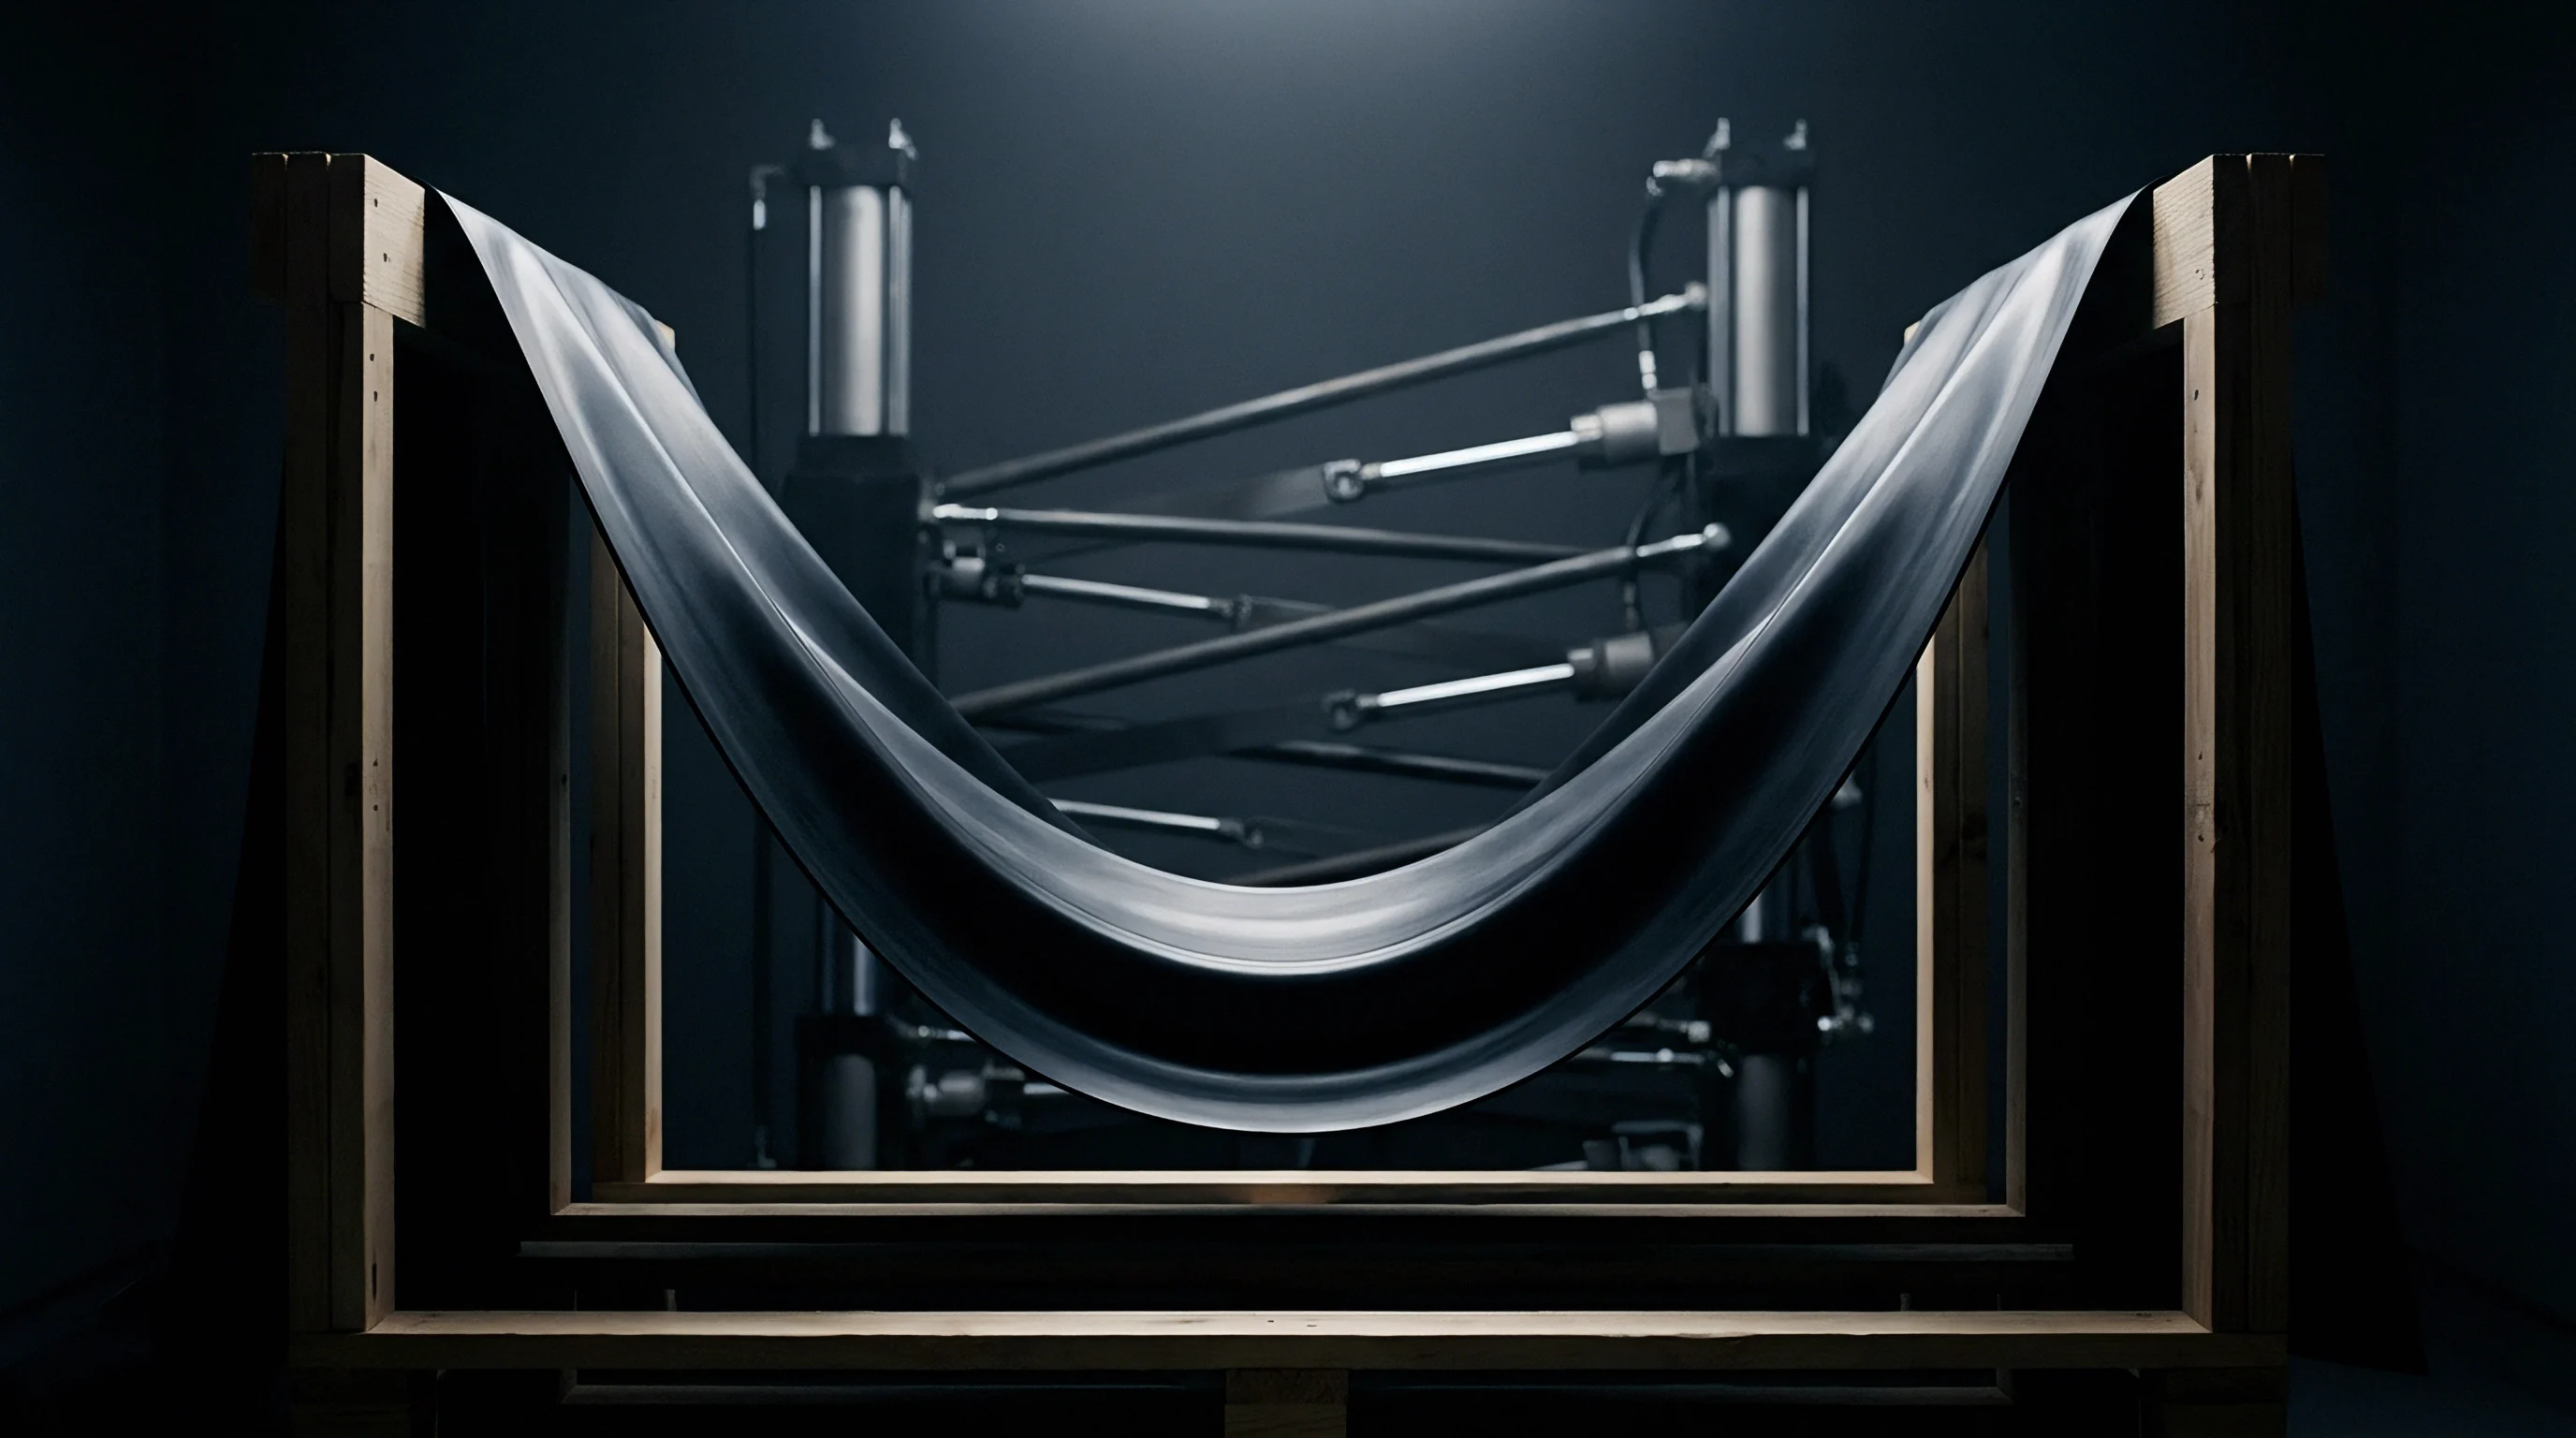
Physical test rigs impose mechanical limits on the measurable stretch domain. Planar cruciform fixtures use independent linear drives with load cells on each arm. The central gauging area of a cruciform rubber specimen experiences shear gradients near the clamped arms that corrupt nominal stress measurements unless optical measurement tracks true strain fields in the central zone.
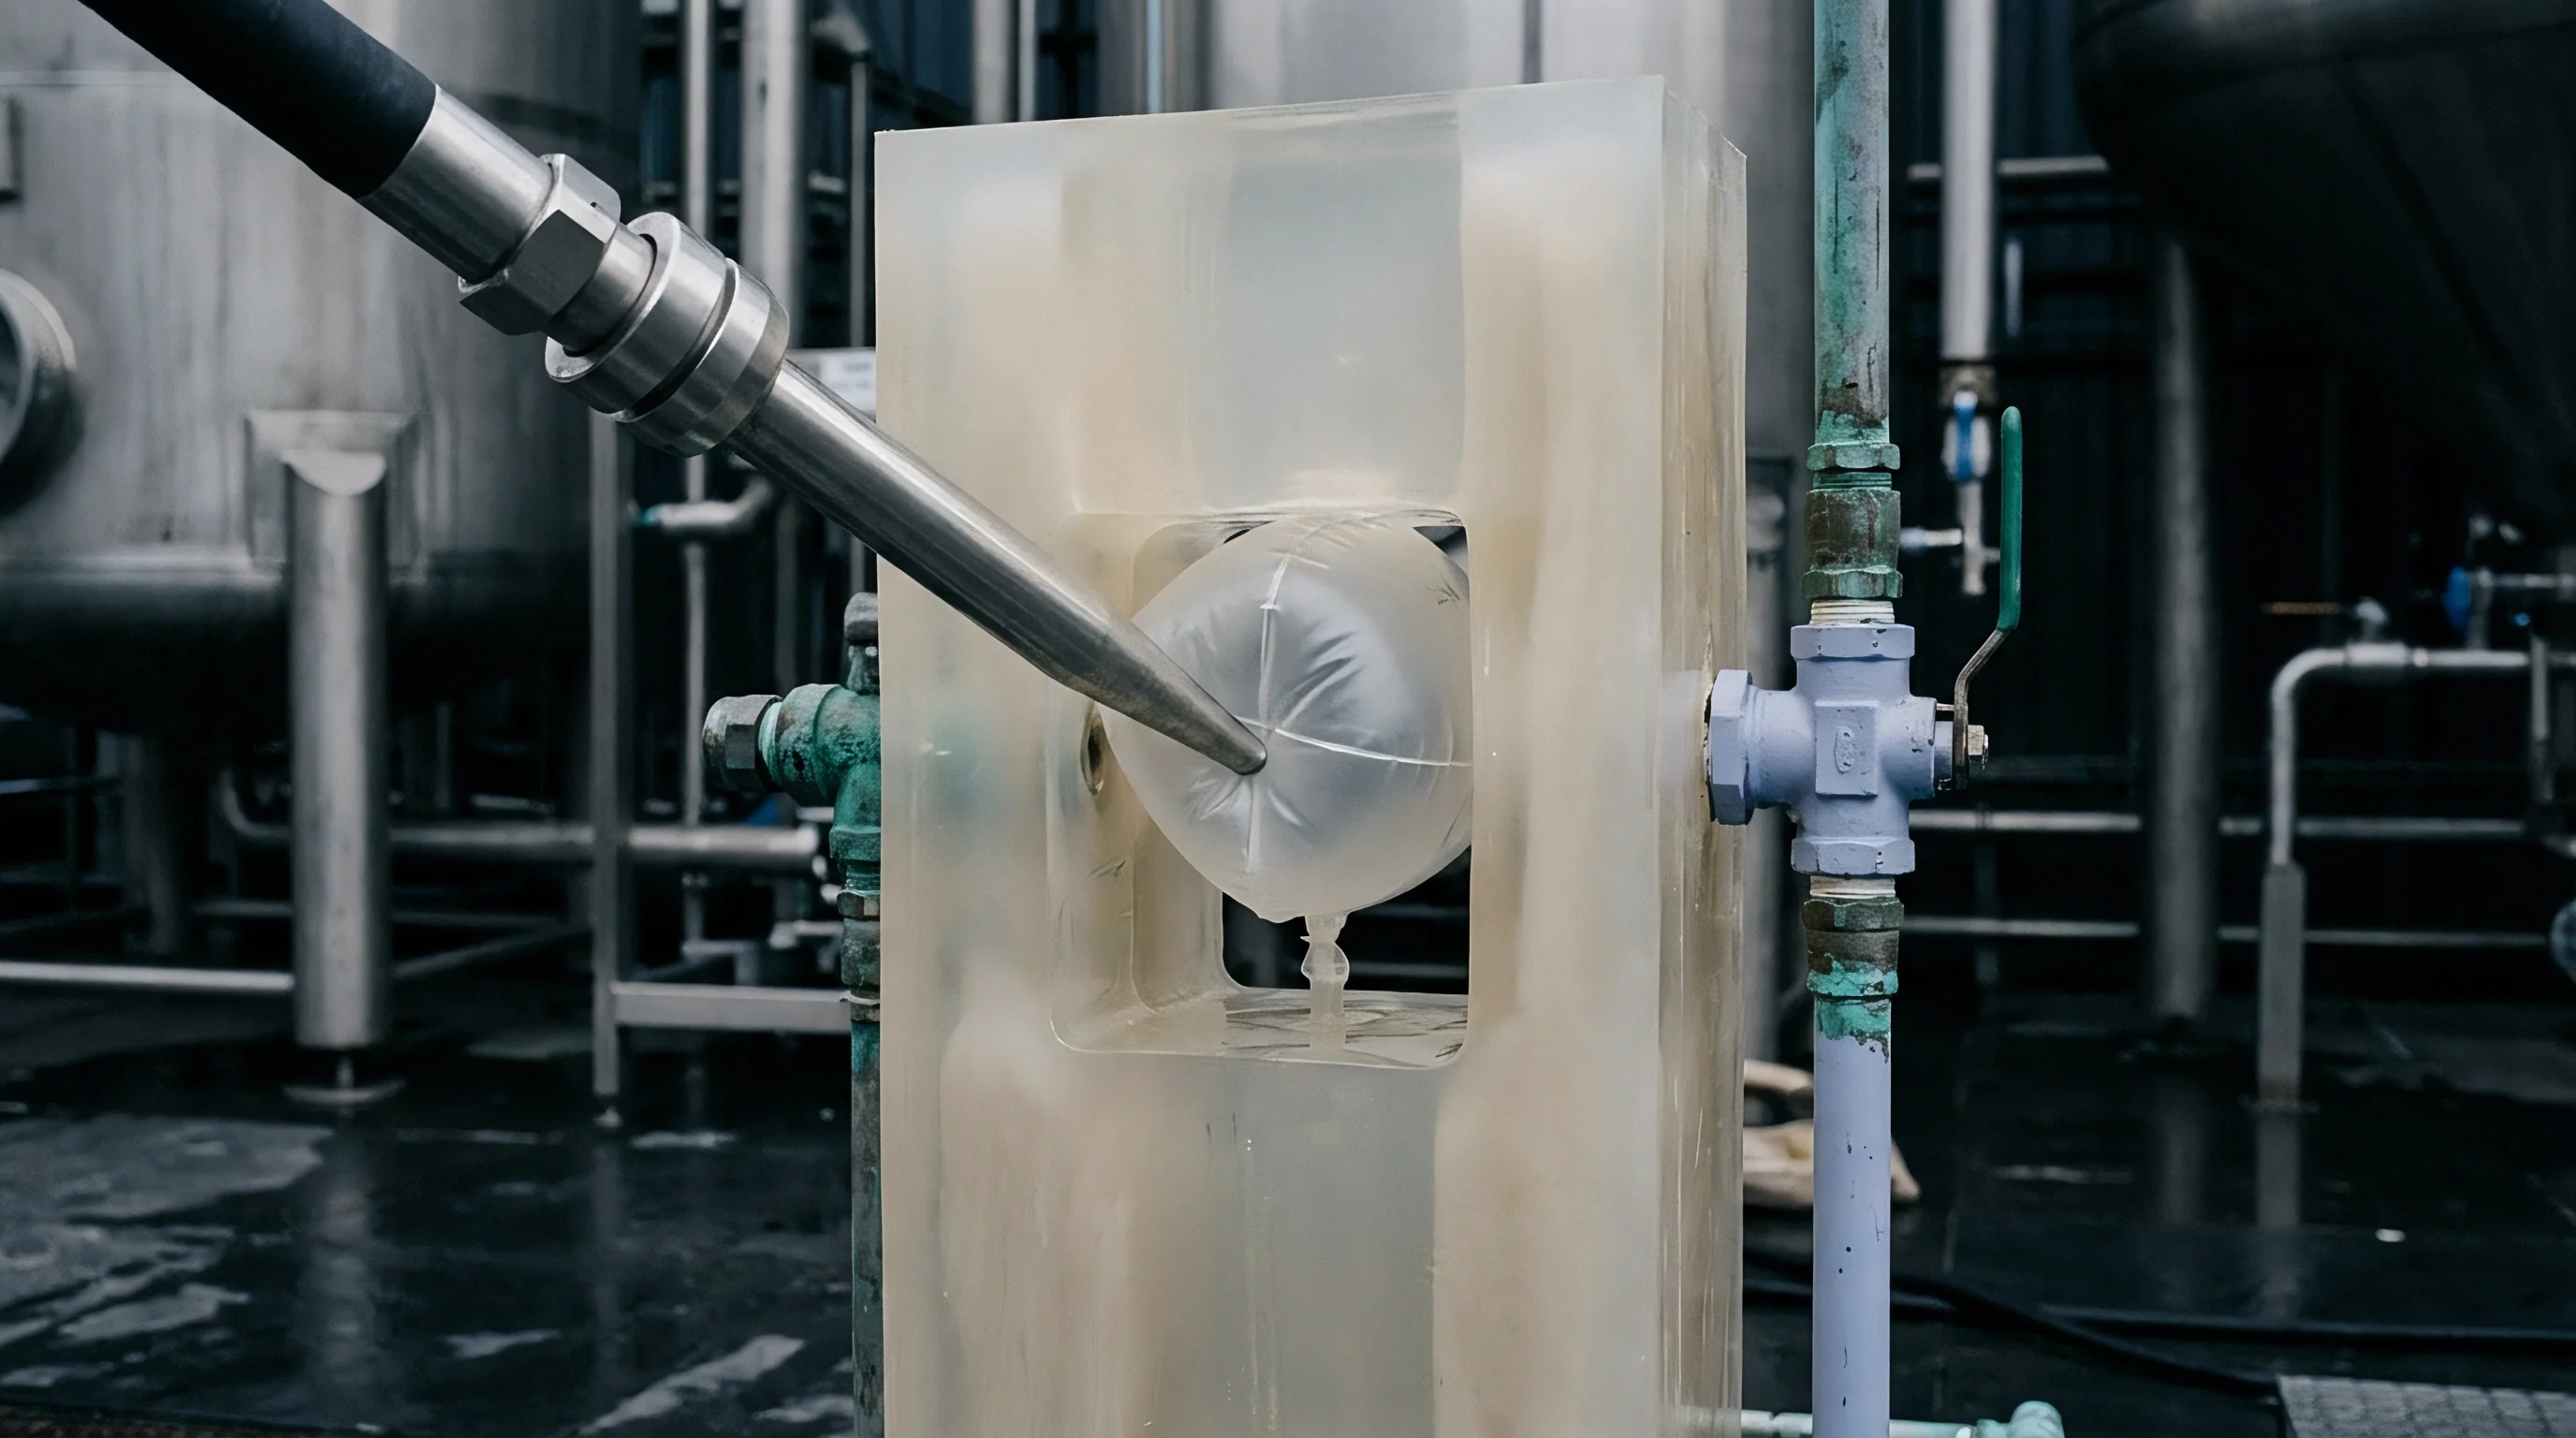
Bubble inflation tests yield equibiaxial states at the pole, but unequal biaxial measurements require elliptical dies that enforce fixed aspect ratios. The tool designer who relies on material cards fitted without unequal biaxial data encounters severe wall thickness deviations during thermoforming trials and blow moulding cycles.
- Cruciform sample slip occurs at high principal stretches when serrated pneumatic clamps pinch elastomeric tabs unevenly across the gripping surface.
- Central shear concentration contaminates nominal stress calculations when the fillet radius between perpendicular cruciform arms drops below four millimeters.
- Strain field non-uniformity develops across the central evaluation zone as crosshead displacement rates diverge between the primary and secondary drive axes.
- Bubble curvature distortion skews calculated principal stresses when elliptical aperture inflation transitions from membrane tension into bending deformation near clamped flanges.
Omitting unequal biaxial data from the parameter identification sequence leaves finite element solvers calculating inaccurate cavity pressures during tool inflation stages. The mould builder cuts cooling lines and venting channels based on simulated wall thickness distributions that fail to match actual part shrinkages. Tool re-machining costs escalate rapidly when cavity wall profiles demand electric discharge machining passes to correct for localized ballooning during production.


Weighting
The Ogden strain energy density potential sums terms containing fractional powers of principal stretches. For an incompressible elastomer, the third principal stretch equates to the inverse product of the first two principal stretches, enforcing the volume conservation condition. The regression objective function minimizes the sum of squared differences between experimental stresses and analytical model predictions across all sampled deformation modes.
Numerical regressions frequently show bias toward equibiaxial or uniaxial data sets when experimental stress ranges differ by an order of magnitude. Equibiaxial stresses routinely reach five times the magnitude of uniaxial stresses at identical stretch levels. An unweighted least-squares objective function allocates disproportionate numerical influence to the high-stress equibiaxial curve, sacrificing fit fidelity along lower-stress unequal biaxial paths.
Which Objective Function Prevents Equibiaxial Bias?
Normalized objective functions divide the residual stress error of each deformation mode by the maximum experimental stress recorded within that specific mode. This normalization scales the residual error dimensionless, equalizing the mathematical penalty across uniaxial, planar, equibiaxial, and unequal biaxial data sets. Manual weighting factors multiply these normalized residuals to reflect the deformation modes dominant in the final production tooling geometry.
| Deformation Mode | Stretch Ratio Range | Peak Nominal Stress (MPa) | Normalized Weight Factor | Mean Relative Error (Percent) |
|---|---|---|---|---|
| Uniaxial Tension | 1.00 to 3.50 | 2.45 | 0.25 | 2.10 |
| Planar Shear | 1.00 to 2.80 | 3.80 | 0.20 | 3.45 |
| Equibiaxial Tension | 1.00 to 2.40 | 9.60 | 0.25 | 1.85 |
| Unequal Biaxial (Ratio 1:1.5) | 1.00 to 2.20 | 6.10 | 0.15 | 4.12 |
| Unequal Biaxial (Ratio 1:2.0) | 1.00 to 2.00 | 7.85 | 0.15 | 4.68 |
Raw test data deceives. A multi-objective genetic algorithm coupled with Levenberg-Marquardt local polishing isolates the global minimum across the coupled error surfaces. Without normalized weighting, the solver forces the Ogden exponent into extreme numerical values to capture the stiffening upturn of the equibiaxial data.
The intermediate stretch states then suffer severe oscillations.
ISO 20753 specimen preparation governs tensile geometries, but biaxial planar testing demands custom cruciform profiles with milled transition fillets to prevent premature border rupture.
The clamp slips under load. Unequal biaxial test runs at fixed stretch ratios of one to one point five and one to two expose whether the Ogden model accurately interpolates the intermediate strain states. When the regression penalizes unequal biaxial deviations alongside pure modes, the fitted parameters maintain consistent predictive capability throughout complex three-dimensional expansions.
Under ISO 16938 provisions for elastomeric membrane testing, tensile results invalidation occurs whenever specimen slippage exceeds zero point five millimeters at the clamp boundary during multi-axial crosshead displacement.
Parameter
Selecting the polynomial order of the Ogden strain energy potential dictates the mathematical flexibility and numerical stability of the structural solver. A first-order model uses a single shear modulus and exponent pair. A third-order model uses three independent pairs of parameters, creating six regression variables that match complex inflection points in filled rubber stress-strain curves.
The initial shear modulus equals half the sum of the products of each parameter pair. The solver halts. When optimization routines run without strict mathematical constraints, individual parameter pairs produce non-physical values.
A negative product of modulus and exponent destabilizes the material tangent stiffness matrix.
| Order Term (p) | Modulus Parameter mu_p (MPa) | Exponent Parameter alpha_p | Modulus Product (MPa) | Drucker Stability Domain |
|---|---|---|---|---|
| p = 1 | 1.185 | 1.750 | 2.074 | Stable to lambda = 4.2 |
| p = 2 | 0.042 | 4.620 | 0.194 | Stable to lambda = 3.8 |
| p = 3 | -0.008 | -2.150 | 0.017 | Unstable at lambda > 2.6 in pure shear |
Drucker stability requires the change in stress dotted with the change in plastic or elastic strain to remain strictly positive throughout the strain space. Rubber memory resists extension. If an unconstrained regression generates parameters that satisfy Drucker stability in simple tension, those same parameters can violate stability criteria during unequal biaxial stretch states.
A material model demonstrating complete stability under pure equibiaxial tension frequently triggers non-positive definite material stiffness matrices under unequal biaxial ratios.
Hessian matrix conditioning governs the speed and robustness of convergence during finite element iterations. Collinear parameter sets produce ill-conditioned Hessian matrices where small changes in input stress yield drastic shifts in predicted parameters. The regression routine must enforce bounds on exponents, keeping them within physically meaningful ranges between negative four and positive ten.
Material testing laboratories often claim that standard uniaxial pull data sufficiently approximates complex expansion states because mathematical invariants link the deformation modes mathematically.


Cavity
Tooling geometry dictates the true deformation history experienced by the polymer melt or rubber preform during forming. Injection blow moulding tools for technical bellows and thermoforming moulds for deep-draw housings force the material through sharp corner radii. In these corner zones, unequal biaxial stretch ratios dominate as the material stretches circumferentially around the mould cavity while drawing axially along the core pin.
Tolerances narrow under heat. When a mould designer commissions a tool based on finite element models fitted purely to uniaxial and equibiaxial test curves, the simulation underestimates the severity of localized wall thinning in corners. The tool steel gets cut to cavity dimensions that leave insufficient material thickness at critical pressure-bearing radii.

Where Does Unequal Stretch Distort Thickness Prediction?
The stretch ratio disparity between axial and circumferential directions creates an unequal biaxial state ranging from one to one point two up to one to three. Planar shear assumptions fail to replicate the true stress state because the minor stretch axis experiences active elongation rather than fixed lateral restraint.
| Cavity Draw Depth (mm) | Local Biaxial Stretch Ratio | Actual Measured Wall (mm) | Uniaxial-Fit Wall (mm) | Optimized Multi-Mode Wall (mm) |
|---|---|---|---|---|
| 25 | 1.15 : 1.00 | 1.82 ± 0.04 | 1.95 | 1.83 |
| 50 | 1.45 : 1.20 | 1.34 ± 0.05 | 1.58 | 1.36 |
| 75 | 1.85 : 1.35 | 0.91 ± 0.06 | 1.24 | 0.93 |
| 100 | 2.40 : 1.60 | 0.58 ± 0.07 | 0.89 | 0.61 |
The discrepancy grows with draw depth. Cavity pressure drops abruptly. At a draw depth of one hundred millimeters, a parameter set lacking unequal biaxial calibration predicts a wall thickness of zero point eight nine millimeters, while the actual physical component thins out to zero point five eight millimeters.
The thin section bursts under burst-pressure qualification testing.
Modifying hardened P20 or 420 stainless steel mould cavities requires wire electrical discharge machining and manual bench polishing. Welding material back onto an undersized core pin introduces thermal stress zones that distort cooling channels. A toolmaker builds the cavity steel to nominal shrinkage factors derived from standard resin data sheets, yet non-uniform biaxial draw produces anisotropic shrinkage across perpendicular directions.
Part warp pulls critical sealing rims outside DIN 16742 tolerance grades.
Corner radii draw ratios dictate local biaxial stress trajectories far more accurately than nominal part thickness assumptions.
A mould cavity cut to dimensions derived from incomplete material models guarantees permanent tooling modifications before first article inspection sign-off.
Ledger
Financial exposure in high-cavitation tooling projects concentrates around cycle time extension and scrap generation caused by wall thickness variation. An eight-cavity injection blow mould for elastomeric diaphragms represents a substantial tooling expenditure. If unpredicted thinning requires extending the cooling cycle by two seconds across a twenty-second baseline, production output drops by ten percent permanently.
Scrap rates compound the loss. The bladder ruptures prematurely. Parts that fall below minimum wall specification fail automated ultrasonic gauge checks at the press side, sending high-grade technical elastomer into the granulator.
Regrind percentages on safety-critical automotive seals are capped by contract at zero percent, turning out-of-spec shots into direct resin write-offs.
- The buyer issues a formal corrective action request upon discovering that first-article wall thickness profiles vary beyond the tolerance band specified under DIN 16742 grade TG6.
- The moulder pulls the eight-cavity tool from the press, stripping cooling manifolds and hot runner plates to expose the damaged core inserts.
- The toolroom re-cuts the core pins via five-axis milling to add steel stock in regions exhibiting excessive biaxial thinning during inflation.
- The quality department runs capability studies across three consecutive production shifts, verifying that process capability index Cpk exceeds one point thirty-three on critical sealing wall dimensions.
Steel changes carry high costs. The amortisation calculation breaks down when re-tooling delays push production launch past contract deadlines, triggering late delivery penalties. Production tooling quotes that omit complete multi-mode material testing transfer the financial risk of geometric error entirely onto the final part price.
Whether modern automated multi-axial test fixtures will reduce testing cycle times sufficiently to make routine unequal biaxial parameter identification standard practice across commercial moulding quotes remains an active debate among tooling engineers and polymer processors.