Optical Profilometry Principles for Non-Contact Mold Surface Metrology
Optical profilometry delivers non-contact 3D areal surface characterization under ISO 25178, preventing cavity damage while certifying tool release forces.

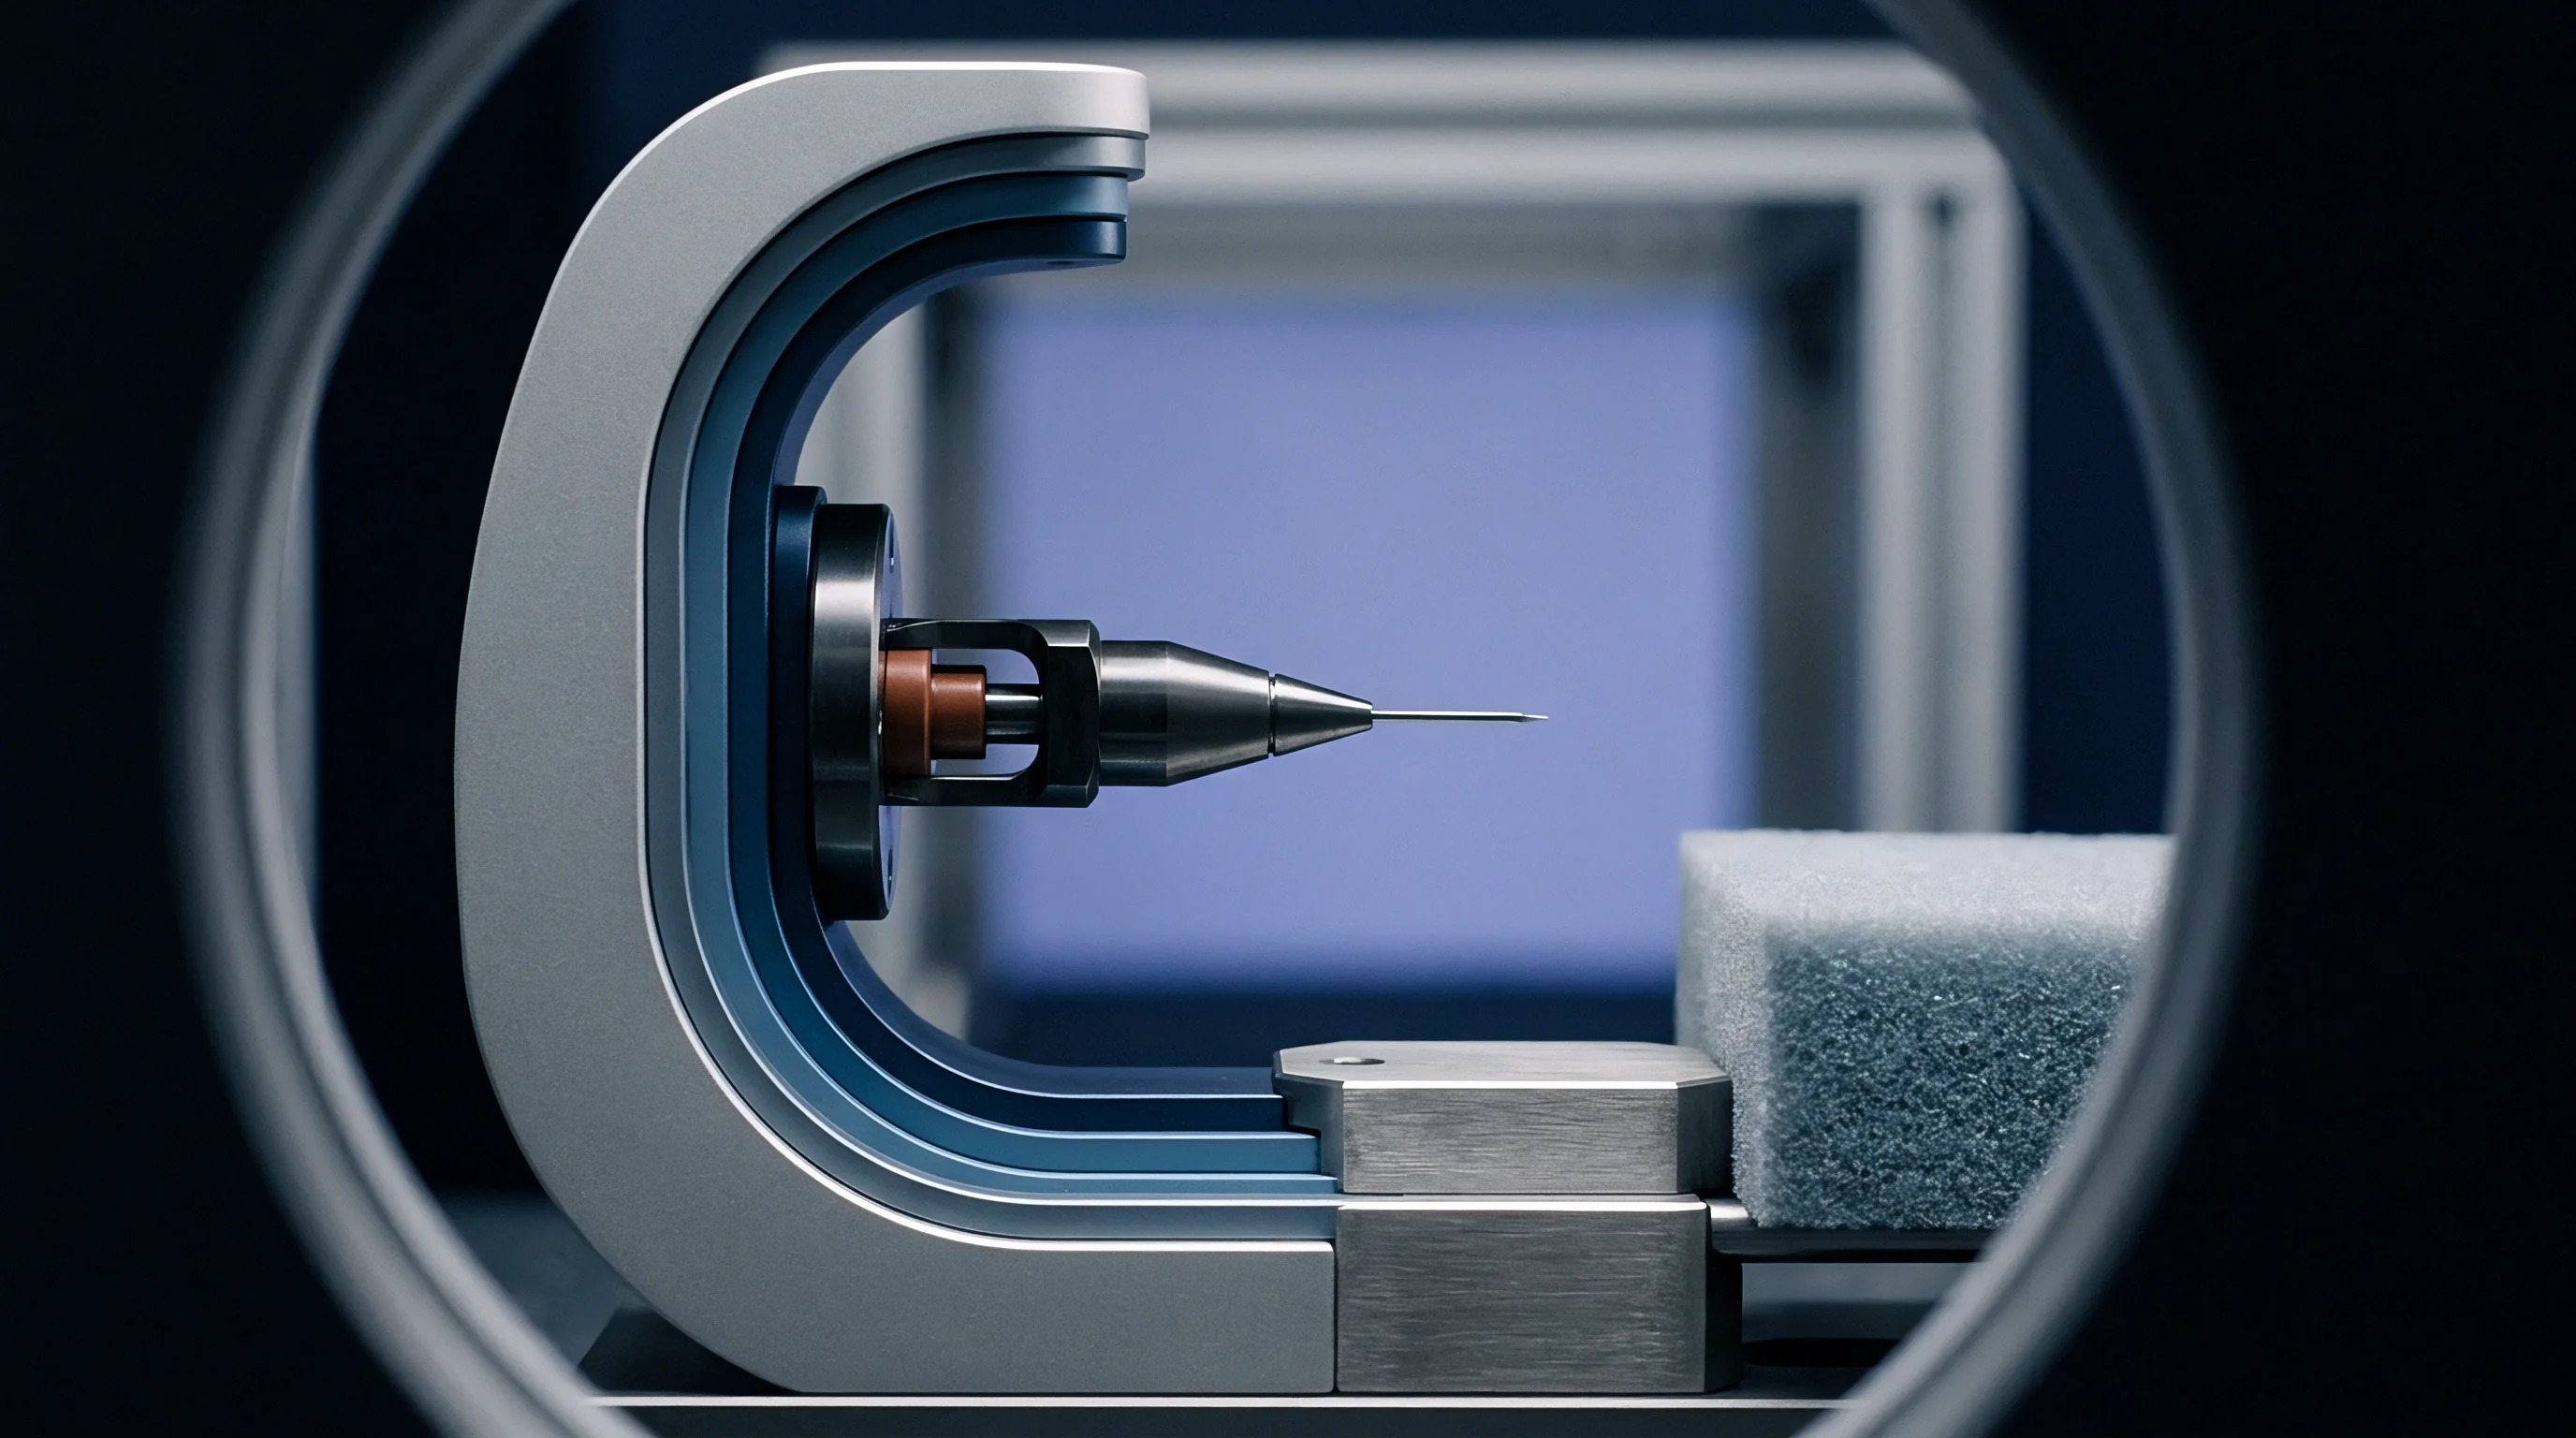
Interferometry
Dragging a mechanical diamond stylus across an SPI A-1 diamond-buffed tool insert creates micro-scratches that destroy specular optical performance. A mechanical probe exerts contact pressures exceeding two hundred megapascals at its two-micrometer tip radius, plowing plastic deformation tracks through hardened tool steels. Non-contact optical methods bypass physical deformation entirely.
Light beams replace diamond styli, recording three-dimensional topography across optical tooling inserts, textured mold cavities, and micro-structured core pins without leaving surface witness marks.
Coherence scanning techniques divide an emission beam into two optical paths inside an interferometer objective. One path reflects from a reference mirror inside the lens assembly, while the second path strikes the mold cavity surface. Light recombination produces constructive and destructive interference fringes precisely when the optical path difference approaches zero.
Vertical stage displacement sweeps this narrow coherence envelope through the entire peak-to-valley height of the cavity insert. High-speed digital sensors record the fringe amplitude envelope at every pixel, converting optical modulation curves directly into absolute height coordinates.
Diamond paste leaves micro-scratches on soft P20.

Optical Profiling Modes for Cavity Inserts
Toolrooms select distinct optical configurations depending on cavity finish, draft slope, and machining history. High-polish mirror cavities require sub-nanometer vertical noise floors. Spark-eroded texture plates demand wider field depths and elevated light acceptance angles.
| Metrology Technique | Vertical Resolution | Lateral Resolution | Maximum Surface Slope | Primary Mold Application |
|---|---|---|---|---|
| Coherence Scanning Interferometry | 0.1 nm | 0.4 µm to 1.2 µm | 10° specular, 45° diffuse | Optical inserts, SPI A-1 mirror finishes |
| Confocal Disc Microscopy | 1.0 nm | 0.2 µm to 0.8 µm | 70° diffuse | Microfluidic core pins, steep ribs |
| Focus Variation Microscopy | 10.0 nm | 0.4 µm to 2.0 µm | 85° textured | EDM textures, VDI 3400 scale patches |
| Contact Diamond Stylus | 1.0 nm | 1.5 µm to 5.0 µm | 45° mechanical | External flat plates, mold base pockets |
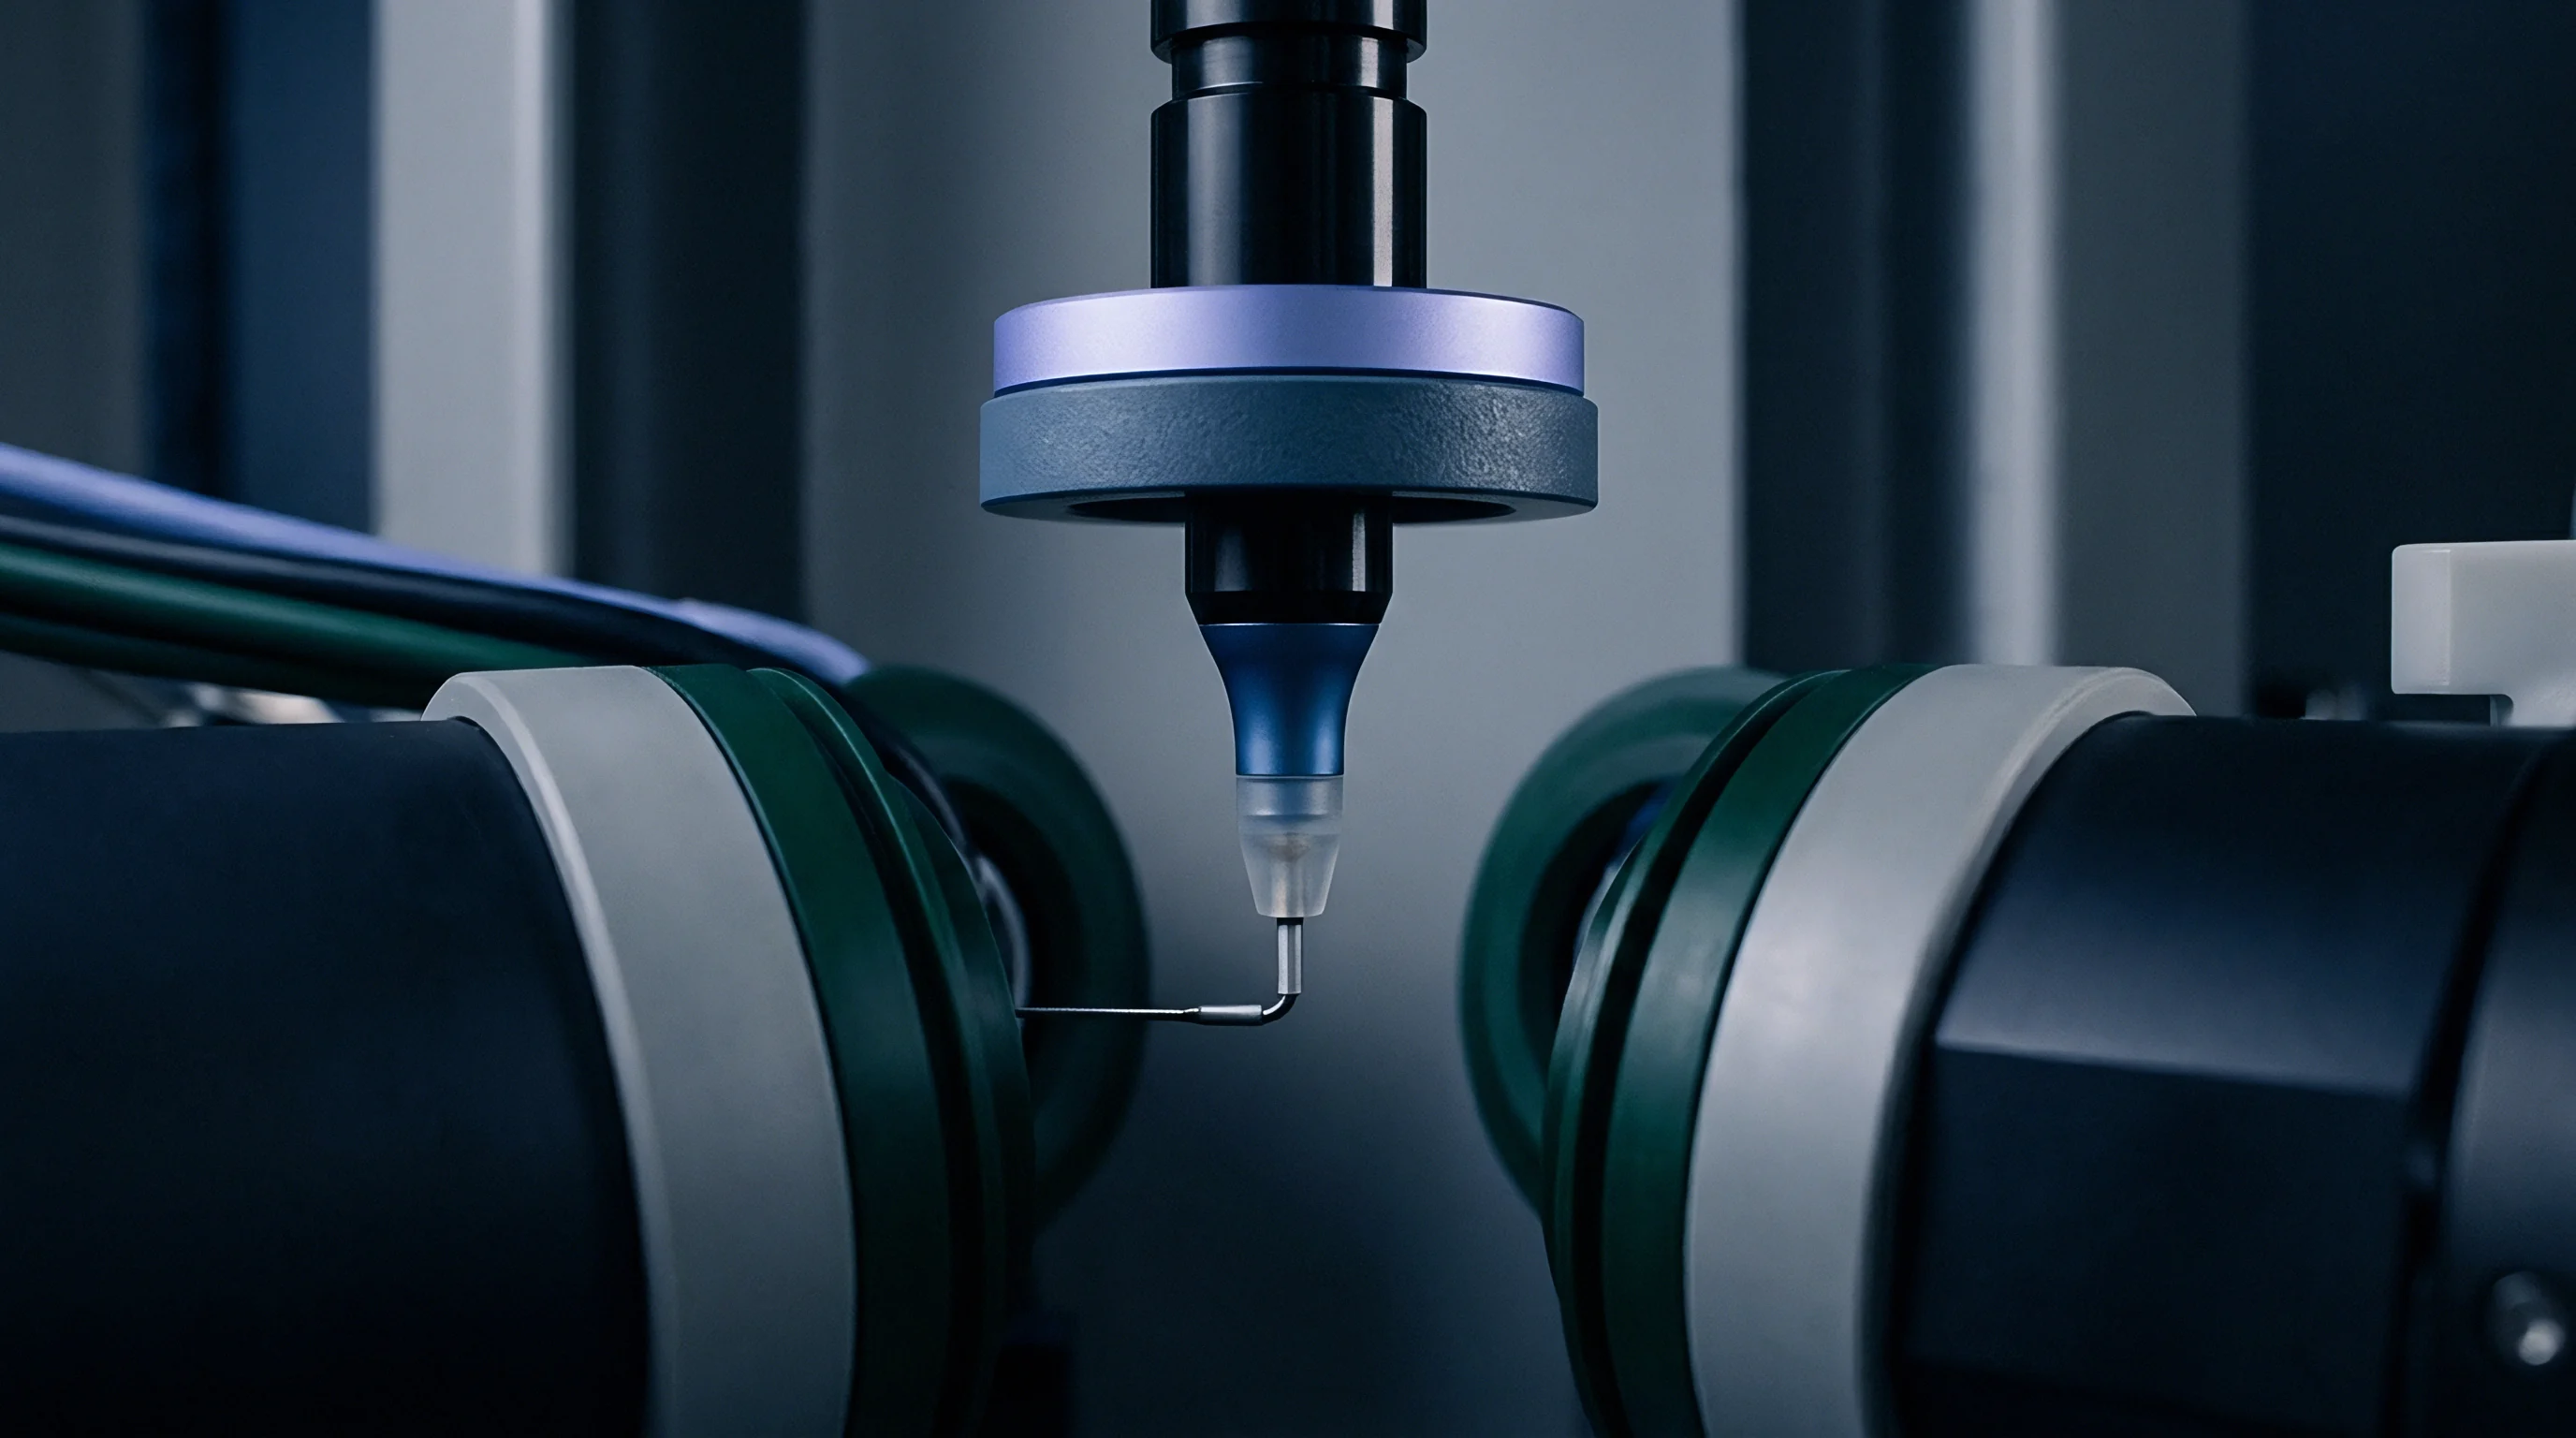
Vertical Separation across Magnification Changes
Mechanical objective design in coherence scanning systems decouples axial measurement accuracy from lateral optical magnification. A five-times magnification objective and a fifty-times magnification objective achieve identical sub-nanometer vertical resolution because axial precision depends solely on the coherence length of the illumination spectrum and the vertical scan encoder increment. Lateral spatial resolution scales directly with objective numerical aperture.
Lower magnification lenses capture large fields of view across multi-cavity plates while maintaining height sensitivity on sub-micrometer lapping marks.
Mirror inserts tolerate zero lateral contact.
Deploying a contact stylus on class-one lens mold cavities creates scratch tracks that propagate directly into every injection shot, forcing immediate cavity re-polishing, geometry recertification, and five-figure toolroom downtime penalties.

Fringe
Interferometric modulation signatures change character as tool surface topography transitions from smooth optical flats to steep sidewalls and textured grain. Monochromatic illumination systems generate repeating sinusoidal wave patterns across the detector array. Phase shifting calculates surface height by capturing discrete frames as an internal piezoelectric actuator translates the reference mirror by calibrated fractions of a wavelength.
This technique records smooth diamond-turned nickel inserts with sub-angstrom vertical repeatability.
Phase ambiguity limits monochromatic phase shifting on steep tool features. Height steps exceeding one-quarter of the source wavelength introduce fringe order confusion, causing two-pi phase wrap errors. White light illumination resolves this ambiguity by combining broad spectral output.
The resulting short coherence length confines fringe formation to a narrow axial zone between one and three micrometers deep, eliminating step-height confusion on milled tool shoulders.
Low numerical aperture objectives drop specular returns on polished tool steel tilted beyond eight degrees.

Is Phase Shifting Reliable across Textured Cavities?
Monochromatic phase calculating algorithms fail when applied to rough EDM surfaces. Random height distributions across spark-eroded craters disperse wavefront phase coherence across adjacent pixels, causing regional data loss. Coherence scanning handles textured molds by tracking the maximum contrast envelope rather than individual phase angles.
The instrument tracks the peak of the interference fringe packet, mapping spark-erosion topography across extensive vertical ranges without phase wrapping artifacts.
- Specular Dropouts arise when polished cavity surfaces tilt beyond the acceptance angle of the objective, deflecting illumination away from the collection optics.
- Phase Wraparound Errors occur on step heights exceeding one-quarter wavelength in monochromatic modes, generating false height steps of half-wavelength increments.
- Batwing Diffraction Spikes appear along sharp step edges where diffraction fringes blend with specular reflections, falsely elevating measured edge heights.
- Ghost Reflections generate secondary interference signals from internal glass surfaces inside objective lenses or transparent protective cover windows.
Light scattering drops across flat lands.
Steep mold flanks complicate interferometric data collection. The maximum detectable slope on a specular polished tool depends directly on the numerical aperture of the objective lens. Numerical apertures around 0.55 capture reflections tilted up to thirty degrees from the optical axis.
Polished surfaces tilted thirty-five degrees reflect light entirely outside the objective entrance pupil, leaving zero data in the topographic point cloud. Textured surfaces scatter light diffusely, allowing higher numerical aperture lenses to record data at steeper nominal inclinations.
The lens numerical aperture sets this limit.
Tool suppliers regularly argue that optical dropouts on steep draft walls represent unmeasurable void anomalies rather than optical collection failure caused by an undersized objective numerical aperture.

Confocality
Pinhole apertures positioned conjugate to the focal plane physically reject out-of-focus light return. Point illumination sources pass through a source pinhole, focus through objective optics onto the tool steel, and reflect back toward a detector pinhole. Rays reflecting from planes above or below the focal plane remain defocused at the aperture plane, blocking their transmission to the optical sensor.
Moving the focal plane through the cavity depth yields sharp intensity maxima precisely when each surface coordinate crosses the focal position.
Spinning Nipkow discs equip confocal systems with thousands of pinholes arranged in Archimedean spirals. Parallel pinhole arrays sweep across the entire field of view simultaneously, capturing full-field optical slices at video frame rates. Laser scanning confocal heads replace physical pinhole discs with vibrating galvanometric mirrors and photomultiplier tubes, achieving elevated lateral contrast on micro-rib inserts and deep connector pockets.
Vertical resolution reaches one nanometer on steel finishes, while lateral resolution resolves micro-features down to two hundred nanometers.
Pores swallow the incoming beam.

Do Focus Variation Limits Restrict EDM Mapping?
Focus variation combines low depth of field objectives with white light illumination, determining surface height from optical contrast rather than pinhole filtering or interferometric fringe envelopes. The sensor moves along the optical axis, gathering continuous color frames. Algorithms compute local image contrast across neighboring pixel windows.
Contrast peaks identify the exact vertical focus coordinate for each spatial point. This mechanism requires sufficient surface micro-texture to calculate contrast variations across pixel groups.
- Mount the cavity block rigidly on the vibration-isolated leveling stage to prevent sub-micron axial drift during acquisition.
- Select illumination balance between coaxial polarized light and ring-light arrays to expose deep tooling recesses without saturating polished plateau regions.
- Set the vertical scan boundaries two micrometers beyond the highest burr and lowest spark crater visible in live video mode.
- Execute the axial scan at constant vertical increments matching the optical depth of field of the chosen objective lens.
- Inspect the reconstructed point cloud for unmeasured pixel clusters, adjusting ring-light illumination angles on steep draft flanks to eliminate void patches.
Coaxial illumination misses steep draft angles.
Coarse spark-eroded tool steels scatter light diffusely enough to favor focus variation over coherence scanning.
Spark-eroded mold surfaces matching VDI 3400 grades from eighteen to thirty-six contain steep crater walls, re-melted globules, and porous micro-cracks. Focus variation maps these rough topographies across vertical ranges exceeding two millimeters without vertical scan range penalties. Extreme specular finishes defeat focus variation because zero-texture mirror flats yield zero contrast variation across adjacent pixels.
Toolrooms measuring diamond-lapped SPI A-1 inserts must choose coherence scanning interferometers or laser confocal sensors capable of processing pure specular reflections.
How do hybrid optical profilers balance calibration errors when combining confocal imaging and focus variation on one continuous mold insert containing both mirror optical lands and rough spark-eroded shut-off seals?

Roughness
Two-dimensional surface profiles under ISO 4287 record single linear traces across mold cavities. A diamond stylus draws a straight line across tool steel, generating traditional roughness parameters such as Ra and Rz. This approach misses directional machining lay from end mills, skips localized pitting from wire EDM, and overlooks sink marks from selective hand polishing. A single linear trace over an EDM spark crater reports low roughness if the stylus traverses a flat plateau, mischaracterizing the demolding resistance of the tool.
Areal surface texture parameters under ISO 25178 evaluate complete three-dimensional surfaces, capturing topographic features across defined spatial boundaries. Arithmetical mean height Sa represents the average height deviation across the entire measured surface. Root mean square height Sq provides statistical weighting to high peaks and deep pits.
Maximum height Sz quantifies the vertical distance between the highest peak and the deepest valley within the field of view. These areal metrics eliminate orientation bias, delivering reliable quality control on milled, turned, and spark-eroded tool inserts.
Areal parameters supersede linear traces.
| Mold Surface Finish | Machining Process | Target Sa | Target Sz | Developed Area Ratio Sdr | Core Release Behavior |
|---|---|---|---|---|---|
| SPI A-1 Optical | #3 Diamond Buff | 0.008 µm | 0.060 µm | 0.02 % | Vacuum sticking on high-gloss parts |
| SPI A-2 Semi-Gloss | #6 Diamond Buff | 0.025 µm | 0.180 µm | 0.08 % | Balanced release, minimal marks |
| SPI B-1 Fine Paper | 600 Grit Silicon | 0.080 µm | 0.650 µm | 0.45 % | Low sliding friction along core draw |
| SPI C-1 Stone | 600 Grit Stone | 0.220 µm | 1.800 µm | 1.80 % | Moderate mechanical interlock risk |
| VDI 3400 Ref 24 | EDM Spark Erosion | 1.600 µm | 11.200 µm | 14.50 % | Demands two to four degrees draft |
| VDI 3400 Ref 33 | Coarse Spark Erosion | 4.500 µm | 28.500 µm | 38.00 % | Severe mechanical drag on release |

Areal Functional Parameters and Ejection Forces
Functional volume and height parameters describe how mold topography interacts with molten and cooling thermoplastics. Reduced peak height Spk measures the upper asperities that undergo rapid initial wear during production cycles. Core roughness depth Sk characterizes the load-bearing plateaus that support sliding friction.
Reduced valley depth Svk quantifies lubricant retention valleys or localized pockets that create vacuum seals during component demolding.
Developed interfacial area ratio Sdr measures the additional surface area contributed by micro-texture relative to a perfectly flat plane. Smooth optical inserts exhibit Sdr values below 0.05 percent. Highly textured EDM surfaces exhibit Sdr values between ten and forty percent.
When polymer melt solidifies under forty megapascals of pack pressure, the resin flows into microscopic valleys, mechanically locking onto high-Sdr steel. Ejection pins must overcome both sliding Coulomb friction and shear resistance across locked micro-asperities.
Ejection forces spike immediately.
Contractual acceptance under ISO 25178-2 binds the toolmaker to areal topographic limits rather than single-trace averages that disguise directional machining marks.

Worked Calculation of Release Shear Resistance
Take an eight-cavity injection mold running medical grade polycarbonate tubes with thirty-millimeter core pin engagement lengths and twenty-millimeter diameters. Core surface area per pin totals 1,885 square millimeters. Total engaged tool steel across eight pins reaches 15,080 square millimeters.
Assume a pack pressure of fifty megapascals and a coefficient of friction of 0.28 between polycarbonate and hardened 1.2343 tool steel. Solidification shrinkage of 0.6 percent applies a compressive hoop stress of twelve megapascals against the core pins at mold open.
Linear profiling reports an acceptable Ra of 0.15 micrometers on both pin sets. Optical profilometry under ISO 25178 reveals distinct areal micro-structures across two finishing vendors:
Vendor A achieves an Sdr of 0.4 percent with an Spk of 0.08 micrometers using orbital diamond paste polishing. Vendor B achieves an Sdr of 6.8 percent with an Spk of 0.65 micrometers using directional paper lapping parallel to the parting line. Compressive normal force per pin equals normal stress multiplied by contact area: twelve megapascals multiplied by 1,885 square millimeters yields 22,620 newtons.
Standard sliding resistance per pin for Vendor A equals normal force multiplied by friction coefficient, adding negligible micro-asperity shear resistance: 22,620 newtons multiplied by 0.28 equals 6,333 newtons. Total eight-pin ejection force equals 50.6 kilonewtons.
Vendor B presents an Spk of 0.65 micrometers across an Sdr of 6.8 percent. Polycarbonate melt locks into the directional micro-grooves, requiring mechanical shear of polymer asperities during ejection. Shear strength of cooling polycarbonate at ninety degrees Celsius equals thirty-two megapascals.
Interlocking area equals core area multiplied by effective Sdr fraction, contributing an additional 4,100 newtons of mechanical shear force per pin. Ejection force per pin rises to 10,433 newtons. Total ejection load across eight cavities reaches 83.5 kilonewtons, exceeding the tool ejector plate rating of sixty-five kilonewtons.
Parting lines open under flash pressure.
Ejection pins push through thin-walled parts when demolding loads climb beyond mechanical yield limits. Parts dish, ejector pins leave white stress bloom marks, and automated robot take-out arms drop parts during cycle interruptions. Sdr verification on optical profilometers detects mechanical interlock hazards before tools ship from the moldmaker.
Release friction scales with developed interfacial area.
Purchase orders specifying mold cavities under ISO 25178-2 section 4.2 obligate toolmakers to deliver qualified Sa, Spk, and Sdr areal data files before tool sign-off payments release from escrow.


Fidelity
Replication efficiency measures how precisely molded plastic reproduces the microscopic topography of the cavity steel. Molten polymer touches cold mold steel during the injection phase, forming an instant frozen skin layer. The thickness of this solid layer and the applied cavity packing pressure determine whether the polymer replicates sub-micrometer polish marks or freezes across peak plateaus.
Measuring both the cavity insert and the finished plastic part on an optical profiler quantifies replication ratios across diverse polymers and mold temperatures.
Amorphous polymers like polycarbonate, polymethyl methacrylate, and cyclic olefin copolymers duplicate tool surface features with high fidelity. High glass transition temperatures and absent crystallization exotherms allow sustained packing pressure to drive the rubbery skin into microscopic tool asperities. Cyclic olefin copolymers replicate optical diffractive gratings with features below two hundred nanometers when mold temperatures remain near tool deflection limits.
Steel retains heat unevenly.
Semi-crystalline resin crystallization shrinkage separates the skin from mold micro-features before cavity pressure transfers the complete tool finish.
Polymer Morphology and Surface Reproduction
Semi-crystalline polymers such as polypropylene, polyoxymethylene, and polyamide present lower replication fidelity under standard injection cycles. Volumetric shrinkage during crystallization pulls the contracting melt away from tool cavity walls during the holding phase. Polypropylene molded against an SPI A-1 diamond-buffed insert exhibits a duller surface finish than the steel insert because secondary crystallization spherulites scatter incident light.
Thermal shrinkage distorts fine sub-micron gratings.
Adding glass fiber reinforcement degrades replicated surface finish further. Fibers suspended in the melt front freeze against cavity surfaces, creating silver streaking and micro-roughness. An optical profiler mapping a PBT-GF30 electrical connector mold measures an Sa of 0.12 micrometers on the tool steel, while the molded part exhibits an Sa of 0.85 micrometers due to exposed surface glass fibers.
S136 stainless resists corrosive fluoropolymers.
Cavity wear shifts gloss over time.
Wear Monitoring across Production Life
Optical metrology tracks cavity deterioration throughout high-volume injection runs. Glass-filled resins, flame retardant additives, and corrosive fluoropolymers abrade tool steels, round sharp EDM peaks, and pit diamond-buffed optical inserts. Periodic profilometer scans of dedicated witness areas on the mold core identify abrasive wear patterns before flash forms on parting lines.
Abrasive resin scouring flattens Spk peaks while widening valley depths over two hundred thousand shots. Optical monitoring tracks tool asset degradation across production shifts, timing preventive tool maintenance before out-of-spec surface gloss forces part rejections.
Mold polish wears down faster when resin injection pressure runs high.