Multi Cavity Injection Tooling Qualification Protocols
Qualifying multi-cavity injection tools demands decoupled process windows, rigorous cavity-to-cavity Cpk analysis, and verified rheological runner balance.
Runner
In high-cavitation tooling, melt distribution dictates volumetric filling uniformity before the cavity gates freeze. Symmetrical geometric layouts with equal flow lengths from sprue to gate do not guarantee balanced volumetric fill across high-cavitation moulds. Shear thinning across the runner network generates non-uniform viscosity profiles within the molten polymer core.
High shear rates near the runner walls elevate melt temperature and lower local viscosity, whereas the central core stays cooler and more viscous. When a primary runner splits into symmetrical secondary channels, this thermal and shear gradient separates unevenly, concentrating hotter material in inner cavities and cooler material in outer cavities.
Quantifying shear induced melt imbalance demands temperature and pressure measurements taken at individual gates across symmetrical branches. In a 32-cavity cold runner tool processing unfilled polypropylene at a melt temperature of 230 degrees Celsius, viscosity variance between inner and outer runner branches generates weight variations exceeding 4.2 percent across cavities despite identical steel dimensions. Correcting this imbalance requires artificial rheological balancing.
Machining differential channel depths or applying melt-flipper inserts redistributes high-shear boundary layers evenly into downstream branches before the final gate entry.
| Layout Configuration | Flow Length Ratio | Shear-Induced Viscosity Spread | Fill Imbalance Band | Correction Method |
|---|---|---|---|---|
| Standard Geometric H-Pattern (16 Cavities) | 1.00:1 | 12.5% to 18.0% | 3.5% to 6.2% | Melt rotation inserts at secondary junctions |
| Balanced Radial Layout (8 Cavities) | 1.00:1 | 1.5% to 3.0% | 0.8% to 1.4% | Direct runner sizing adjustments |
| Branching Fishbone Layout (32 Cavities) | 1.45:1 | 22.0% to 31.0% | 8.0% to 14.5% | Differential sub-runner depth profiling |
| Optimum Mold-Master Pattern (64 Cavities) | 1.00:1 | 15.0% to 24.0% | 4.0% to 7.5% | Multi-level melt flip geometry and core inserts |
Cold runner waste grows exponentially with cavitation count. Hot runner valve gate systems eliminate cold sprue scrap, but introduce thermal zones that demand independent temperature controls. Hot runner tip temperature variances above 3 degrees Celsius alter melt viscosity sufficiently to throw dimensional tolerances out of specification across adjacent cavities.
Hot runner nozzle tip thermal deviations exceeding 3 degrees Celsius cause cavity-to-cavity volumetric fill variation beyond 2.5 percent in thin-wall polyolefin components.
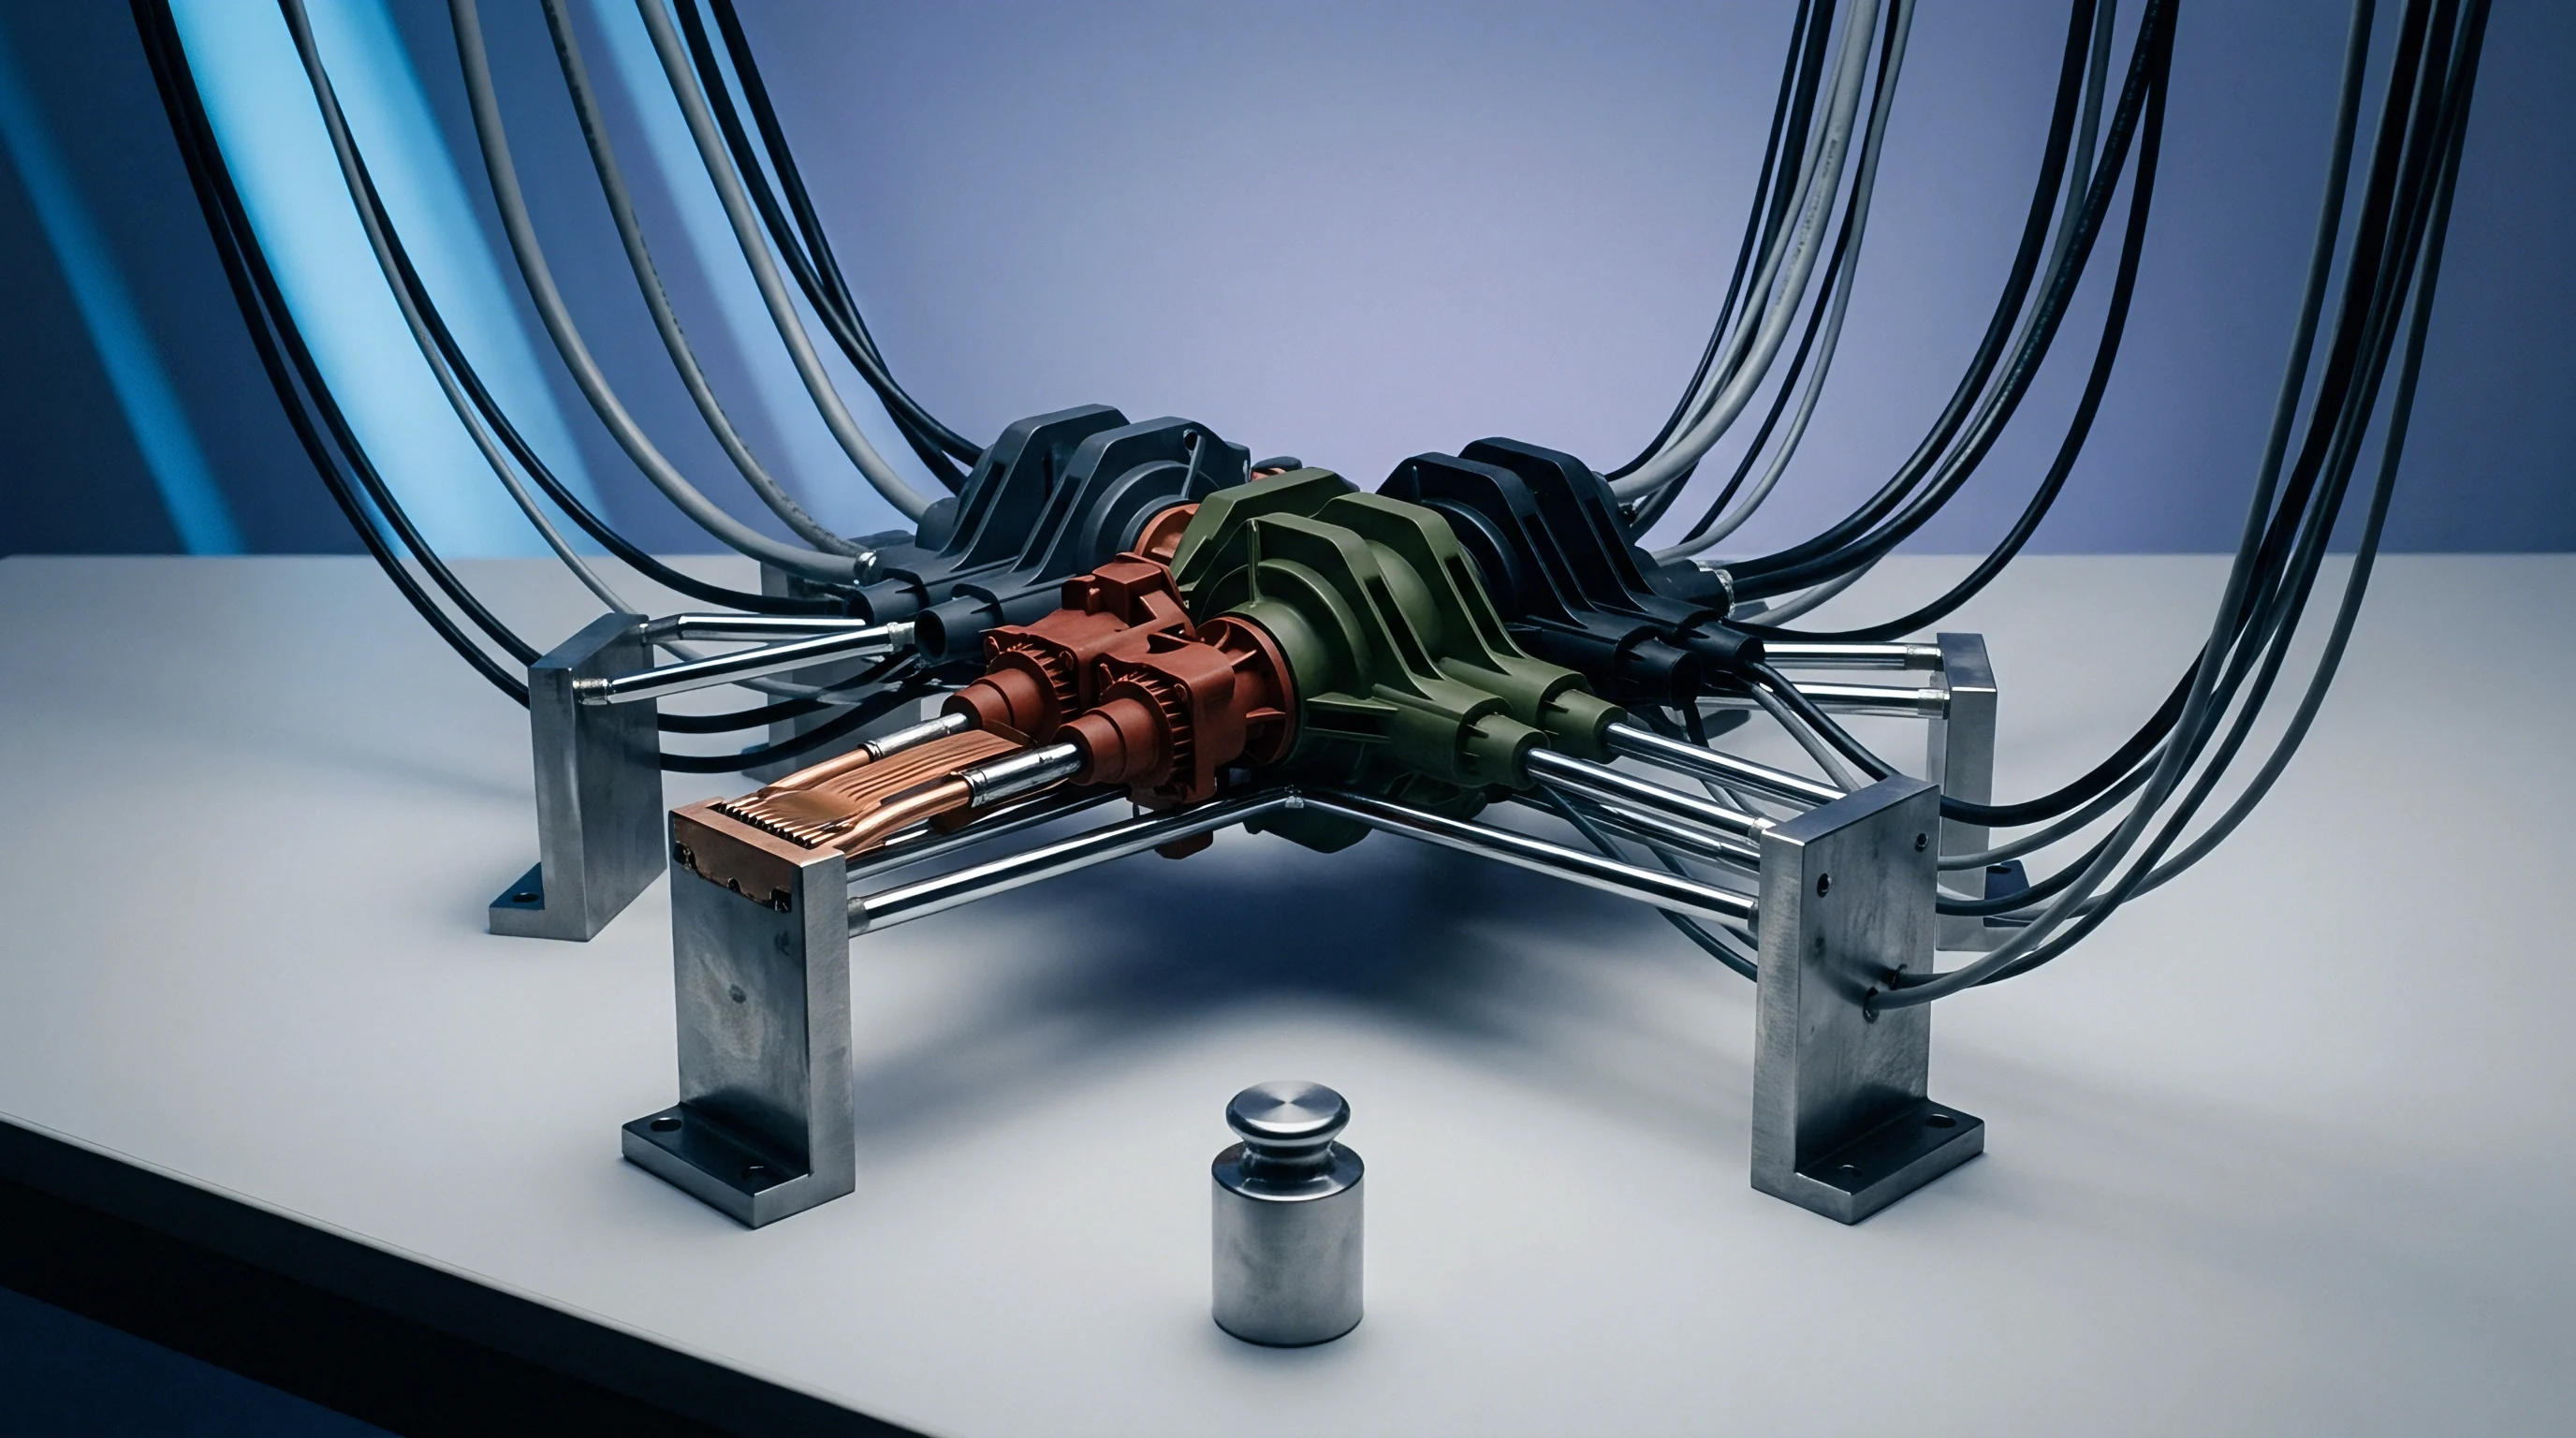
Hot runner manifolds must maintain uniform thermal profiles across all drop locations under maximum machine throughput. Static thermal simulation models fail to capture the transient heat loss during high-speed injection cycles. Physical validation uses multi-channel thermocouple logging embedded within the manifold block near each nozzle drop during actual processing conditions.
Tooling vendors frequently attribute outer cavity short shots to localized resin gas accumulation rather than shear induced thermal imbalance across the manifold branches.


Decoupling
Process window qualification relies on separating the injection phase into speed-controlled filling, pressure-controlled packing, and time-controlled holding. Decoupled moulding isolates material viscosity changes from press hydraulics. Stage one fills 95 to 98 percent of total part volume purely through ram velocity, transferring to hold pressure via screw position.
This transition point prevents peak pressure spikes that flash parting lines or stress delicate core pins.
Scientific Injection Process Setup
Establishing a robust process window starts with dynamic viscosity curves across varying injection velocities. Injection velocity increases until effective viscosity reaches a stable plateau. Operating within this asymptotic region minimizes the impact of melt viscosity fluctuations caused by regrind loading or resin batch variations.
Gate seal determination follows velocity selection through incremental holding time studies while logging part mass per cavity.
Peak cavity pressure measurements provide direct verification of volumetric fill stability. Piezoelectric transducers mounted behind ejector pins at the last-to-fill cavity regions record pressure transfer through the frozen outer shell. High-cavitation tooling requires sensor coverage across designated reference cavities to verify simultaneous pack transfer across all active drops.
The toolmaker completes a three-stage trial sequence during tool prove-out:
- Rheology Curve Mapping Viscosity versus shear rate is plotted using fast-to-slow injection speeds to select maximum flow rate without polymer degradation.
- Cavity Balance Evaluation Short shot study identifies filling order at 80 percent volumetric fill, establishing initial cavity balance percentages across all positions.
- Gate Seal Determination Hold time increments upward by 0.5-second steps until part weight stabilizes across three consecutive shots, confirming gate freeze time.
- Process Window Mapping Upper and lower bounds for melt temperature, pack pressure, and velocity are established to yield dimensional compliance across all cavities.
Short shot steps show the progressive filling pattern across the tool grid. Cavities filling prematurely experience excessive pack pressure, driving localized internal stress and warpage in finished components. Standard qualification criteria limit fill balance variance to under 5.0 percent across all cavities at 90 percent volumetric shot volume.
ISO 294 specification governs test specimen moulding protocols, dictating holding pressure transfer within 10 milliseconds of volumetric transfer position.
Screw recovery speed and back pressure settings directly govern melt homogenization during cooling. High back pressure improves thermal stability within the barrel, but increases resin temperature through shear heating, shifting cooling cycle duration upward.
Process stability relies on holding gate seal time constant across every production cavity regardless of local wall thickness variations.


Variance
Cavity-to-cavity dimensional uniformity defines whether a multi-cavity tool achieves production release. Measuring 32 or 64 individual mouldings per shot across critical drawing dimensions generates data for capability metrics. Part geometry, resin shrinkage characteristics, and tool steel tolerances combine into total process variance.
Statistical Analysis of Multi-Cavity Data
Evaluating Cpk values requires isolating within-cavity variance from cavity-to-cavity variance. Calculating a single overall Cpk across all cavities combined hides localized tool defects. An acceptable overall Cpk can obscure two individual cavities failing drawing limits, creating silent quality risks during high-volume production runs.
DIN 16742 standardizes moulding tolerances based on material shrinkage categories and cavity steel accuracy grades. For a polypropylene part with a critical feature size of 25.00 mm under Tolerance Group TG6, total allowable variation equals plus or minus 0.14 mm. A 16-cavity tool must demonstrate individual cavity Cpk values above 1.33, while total tooling performance across all cavities demands a Ppk above 1.67 during validation.
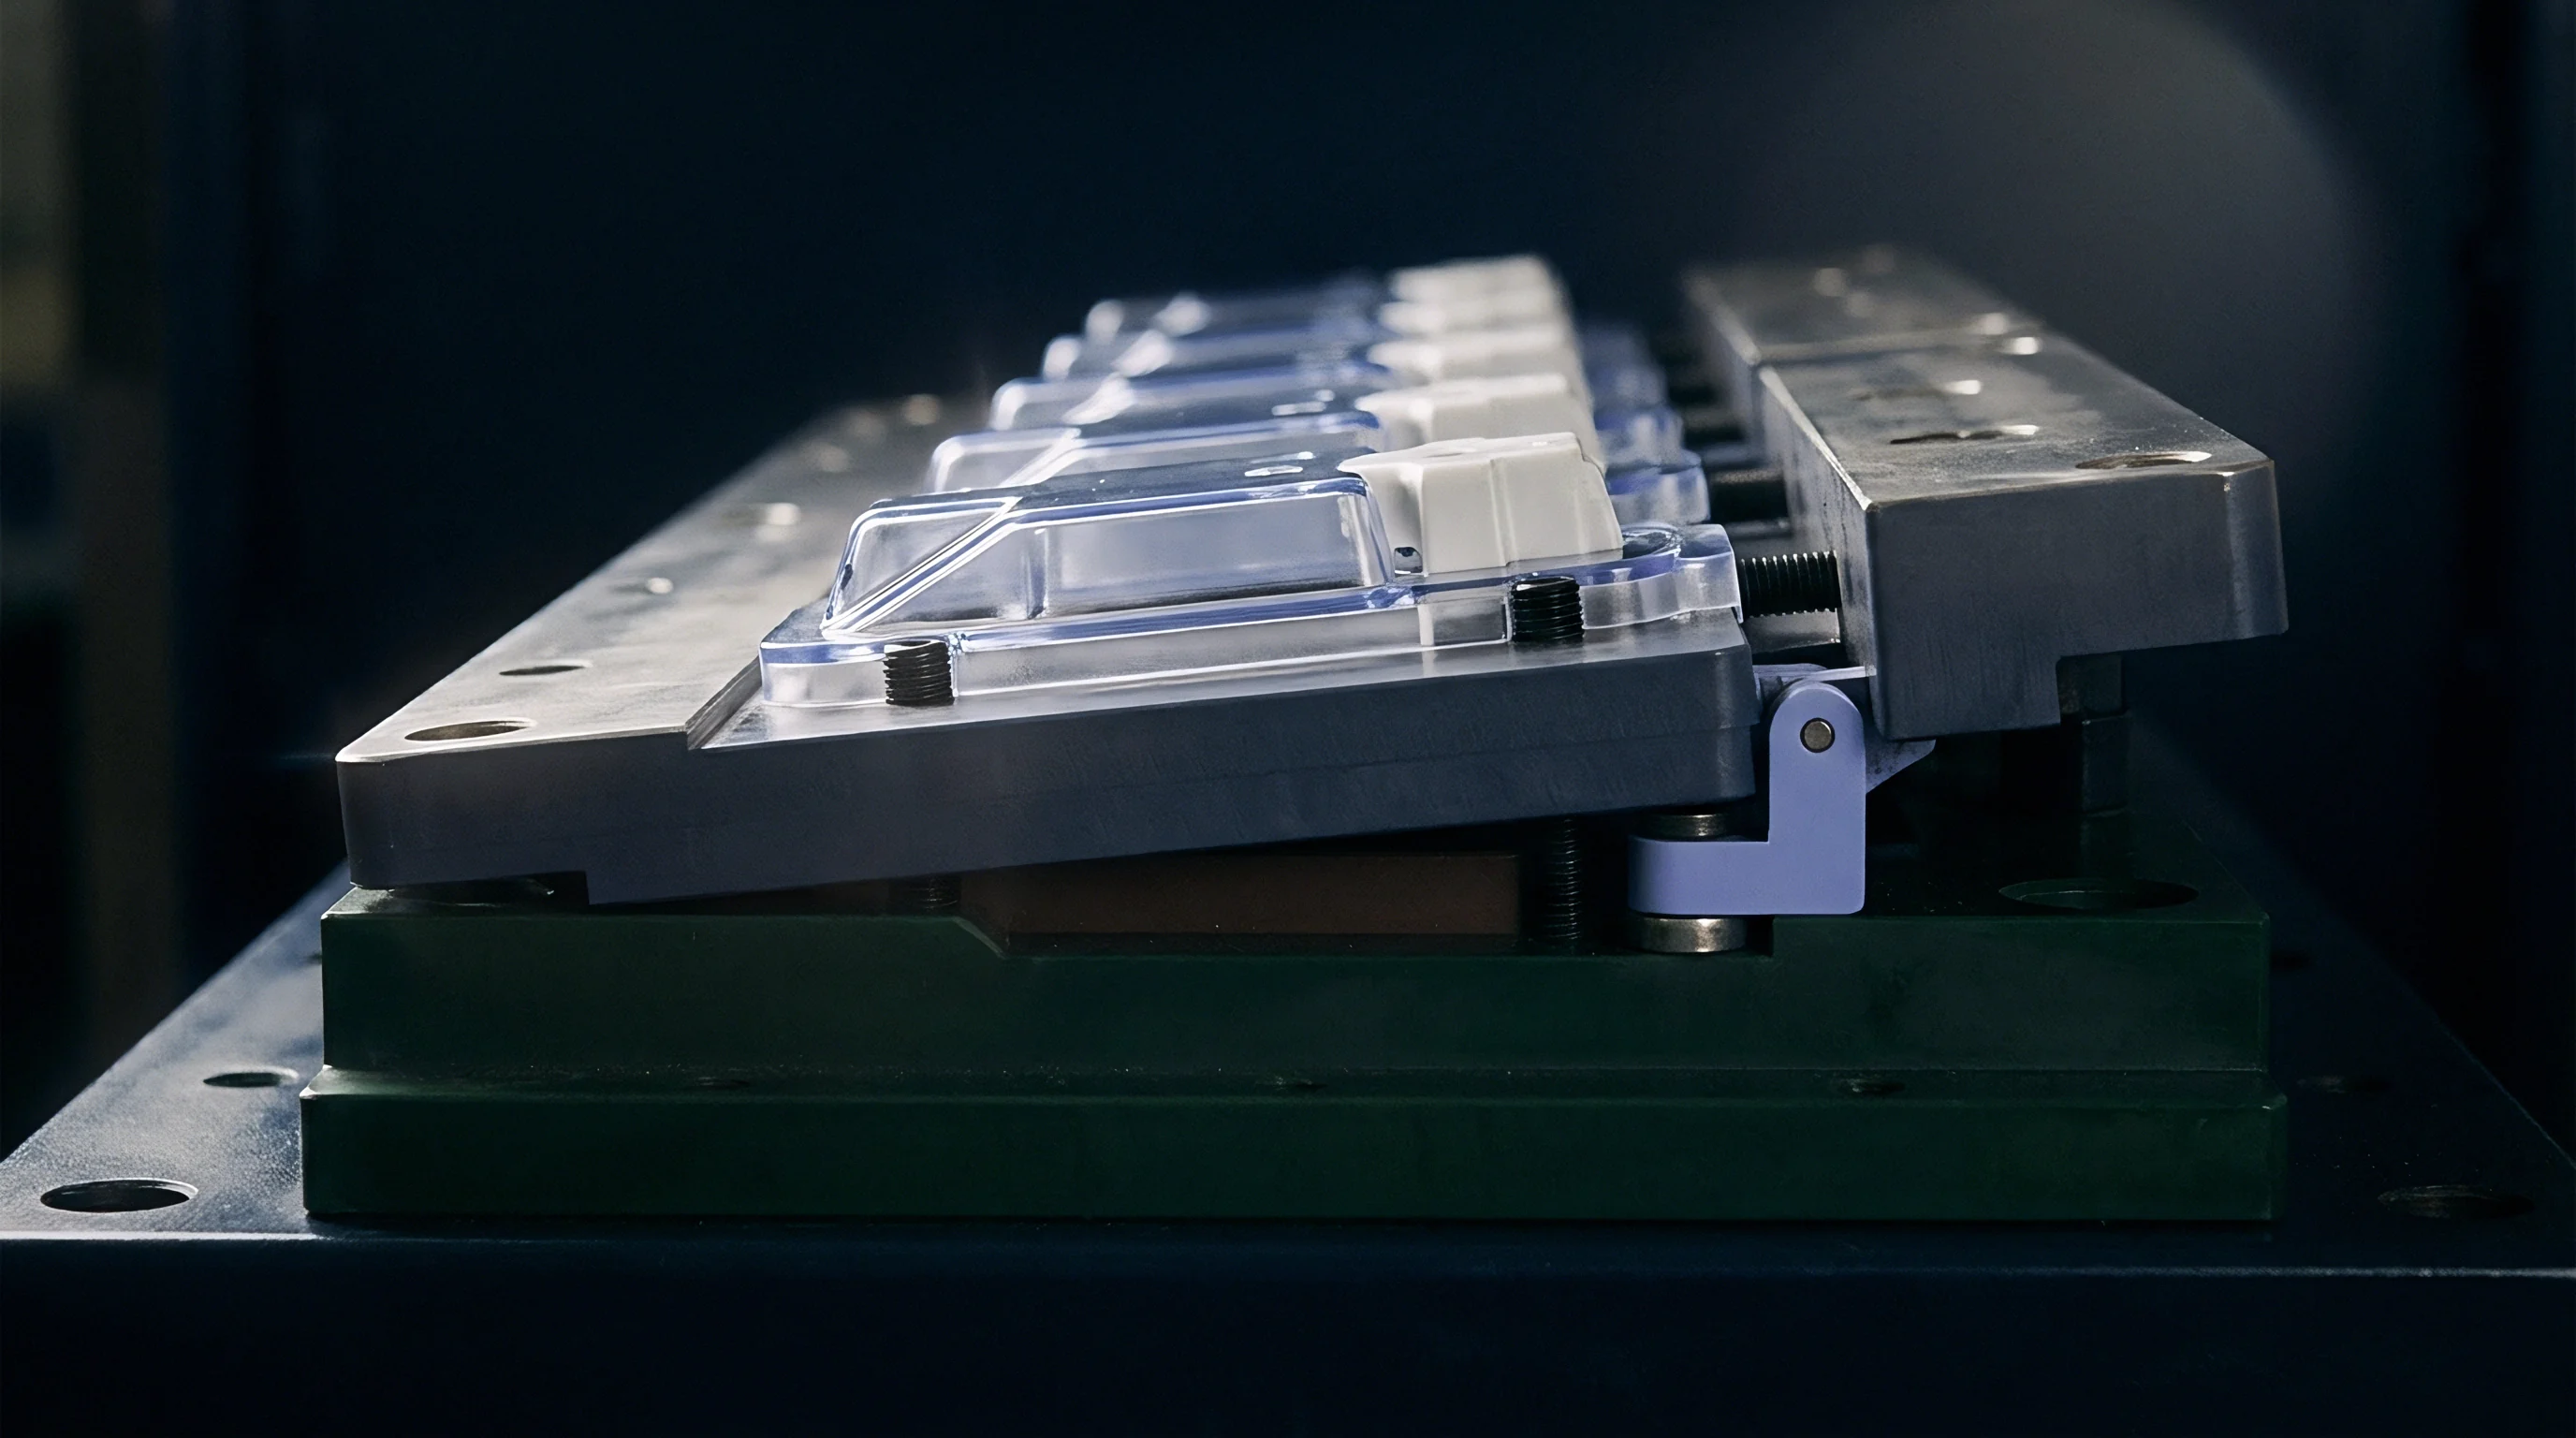
How Much Cavity Variation Triggers Tool Rejection?
Dimensional spread across cavities exceeding 20 percent of total engineering specification bandwidth triggers steel modification or cavity lockout protocols. When four cavities in a 32-cavity tool consistently produce outer diameters 0.08 mm larger than the median across all cavities, packing pressure or cooling circuit performance is uneven. Remediation requires toolroom intervention to polish gates or adjust localized cooling flow.
Part weight metrics serve as a rapid surrogate for comprehensive dimensional inspection during production runs. Weighing complete shot sets on high-precision analytical balances identifies subtle filling imbalances before dimensional drift exceeds engineering control limits.
| Dimension ID | Target Nominal (mm) | Tolerance Band (mm) | Mean Cavity Range (mm) | Lowest Cavity Cpk | Overall Tool Ppk |
|---|---|---|---|---|---|
| Outer Diameter A1 | 12.500 | ±0.050 | 12.482 – 12.518 | 1.42 | 1.71 |
| Wall Thickness T2 | 1.800 | ±0.030 | 1.778 – 1.815 | 1.18 | 1.45 |
| Overall Height H1 | 45.200 | ±0.100 | 45.140 – 45.230 | 1.55 | 1.88 |
| Hole Pitch P1 | 22.000 | ±0.040 | 21.972 – 22.025 | 1.05 | 1.31 |
Thermal imaging during part ejection identifies localized heat retention across cavity blocks. Temperature differences greater than 5 degrees Celsius between cavity cores indicate plugged cooling passages or poor tool steel thermal conductivity.
Uncorrected dimensional variance across cavities forces operators to run wider tolerance windows, increasing scrap rates and extending unit production times beyond quote models.

Dossier
Formal qualification documentation packages validate that tooling, processes, and products comply with engineering specifications. The qualification dossier provides the permanent technical evidence supporting commercial handoff from toolmaker to production facility. Installation Qualification (IQ), Operational Qualification (OQ), and Performance Qualification (PQ) structure the verification sequence.
IQ verifies machine compatibility, utility supplies, and physical tool construction against drawing specifications. Steel certifications, hot runner wiring schematics, surface finish measurements, and cooling circuit flow rate logs form the baseline documentation. Water flow through individual cooling loops must meet turbulent flow thresholds, corresponding to Reynolds numbers above 4000.
OQ establishes process repeatability under deliberate operational stress. Running the tool at upper and lower process parameters tests window limits. Three consecutive production runs executed at nominal process settings verify tool reliability across shift changes.
PQ runs confirm long-term production capability under continuous operational conditions. A standard PQ protocol requires running continuous production for a minimum of 8 to 24 hours without parameter adjustments or manual intervention, capturing minimum sample sizes across all active cavities.
- Verify core pins, slide components, and ejector mechanisms match tool assembly drawings and surface hardness specifications.
- Connect water manifolds and log pressure drops plus flow rates for each individual circuit to confirm turbulent heat transfer.
- Execute high-speed pressure sensor calibration and verify signal integration with machine control units.
- Perform short shot fill studies from 50 percent to 98 percent volumetric fill, recording weight profiles per cavity.
- Run complete process window mapping across injection speed, melt temperature, pack pressure, and cooling duration.
- Collect full shot sets across 30 consecutive cycles at nominal process parameters for statistical dimensional evaluation.
- Compile inspection reports, capability calculations, tool drawings, and maintenance schedules into the permanent qualification file.
Qualification protocols for automotive and medical moulding demand full multi-cavity statistical release documentation before commercial tool sign-off.
Quality documentation relies on full traceability linking physical components to specific cavity numbers. Cavity identification numbers electro-discharge machined or laser engraved directly into part show surfaces enable immediate defect tracking during assembly operations.
Standard quality agreements specify that any unscheduled tool modification or cavity repair executed after dossier sign-off invalidates process approval and requires full re-qualification testing.

Crate
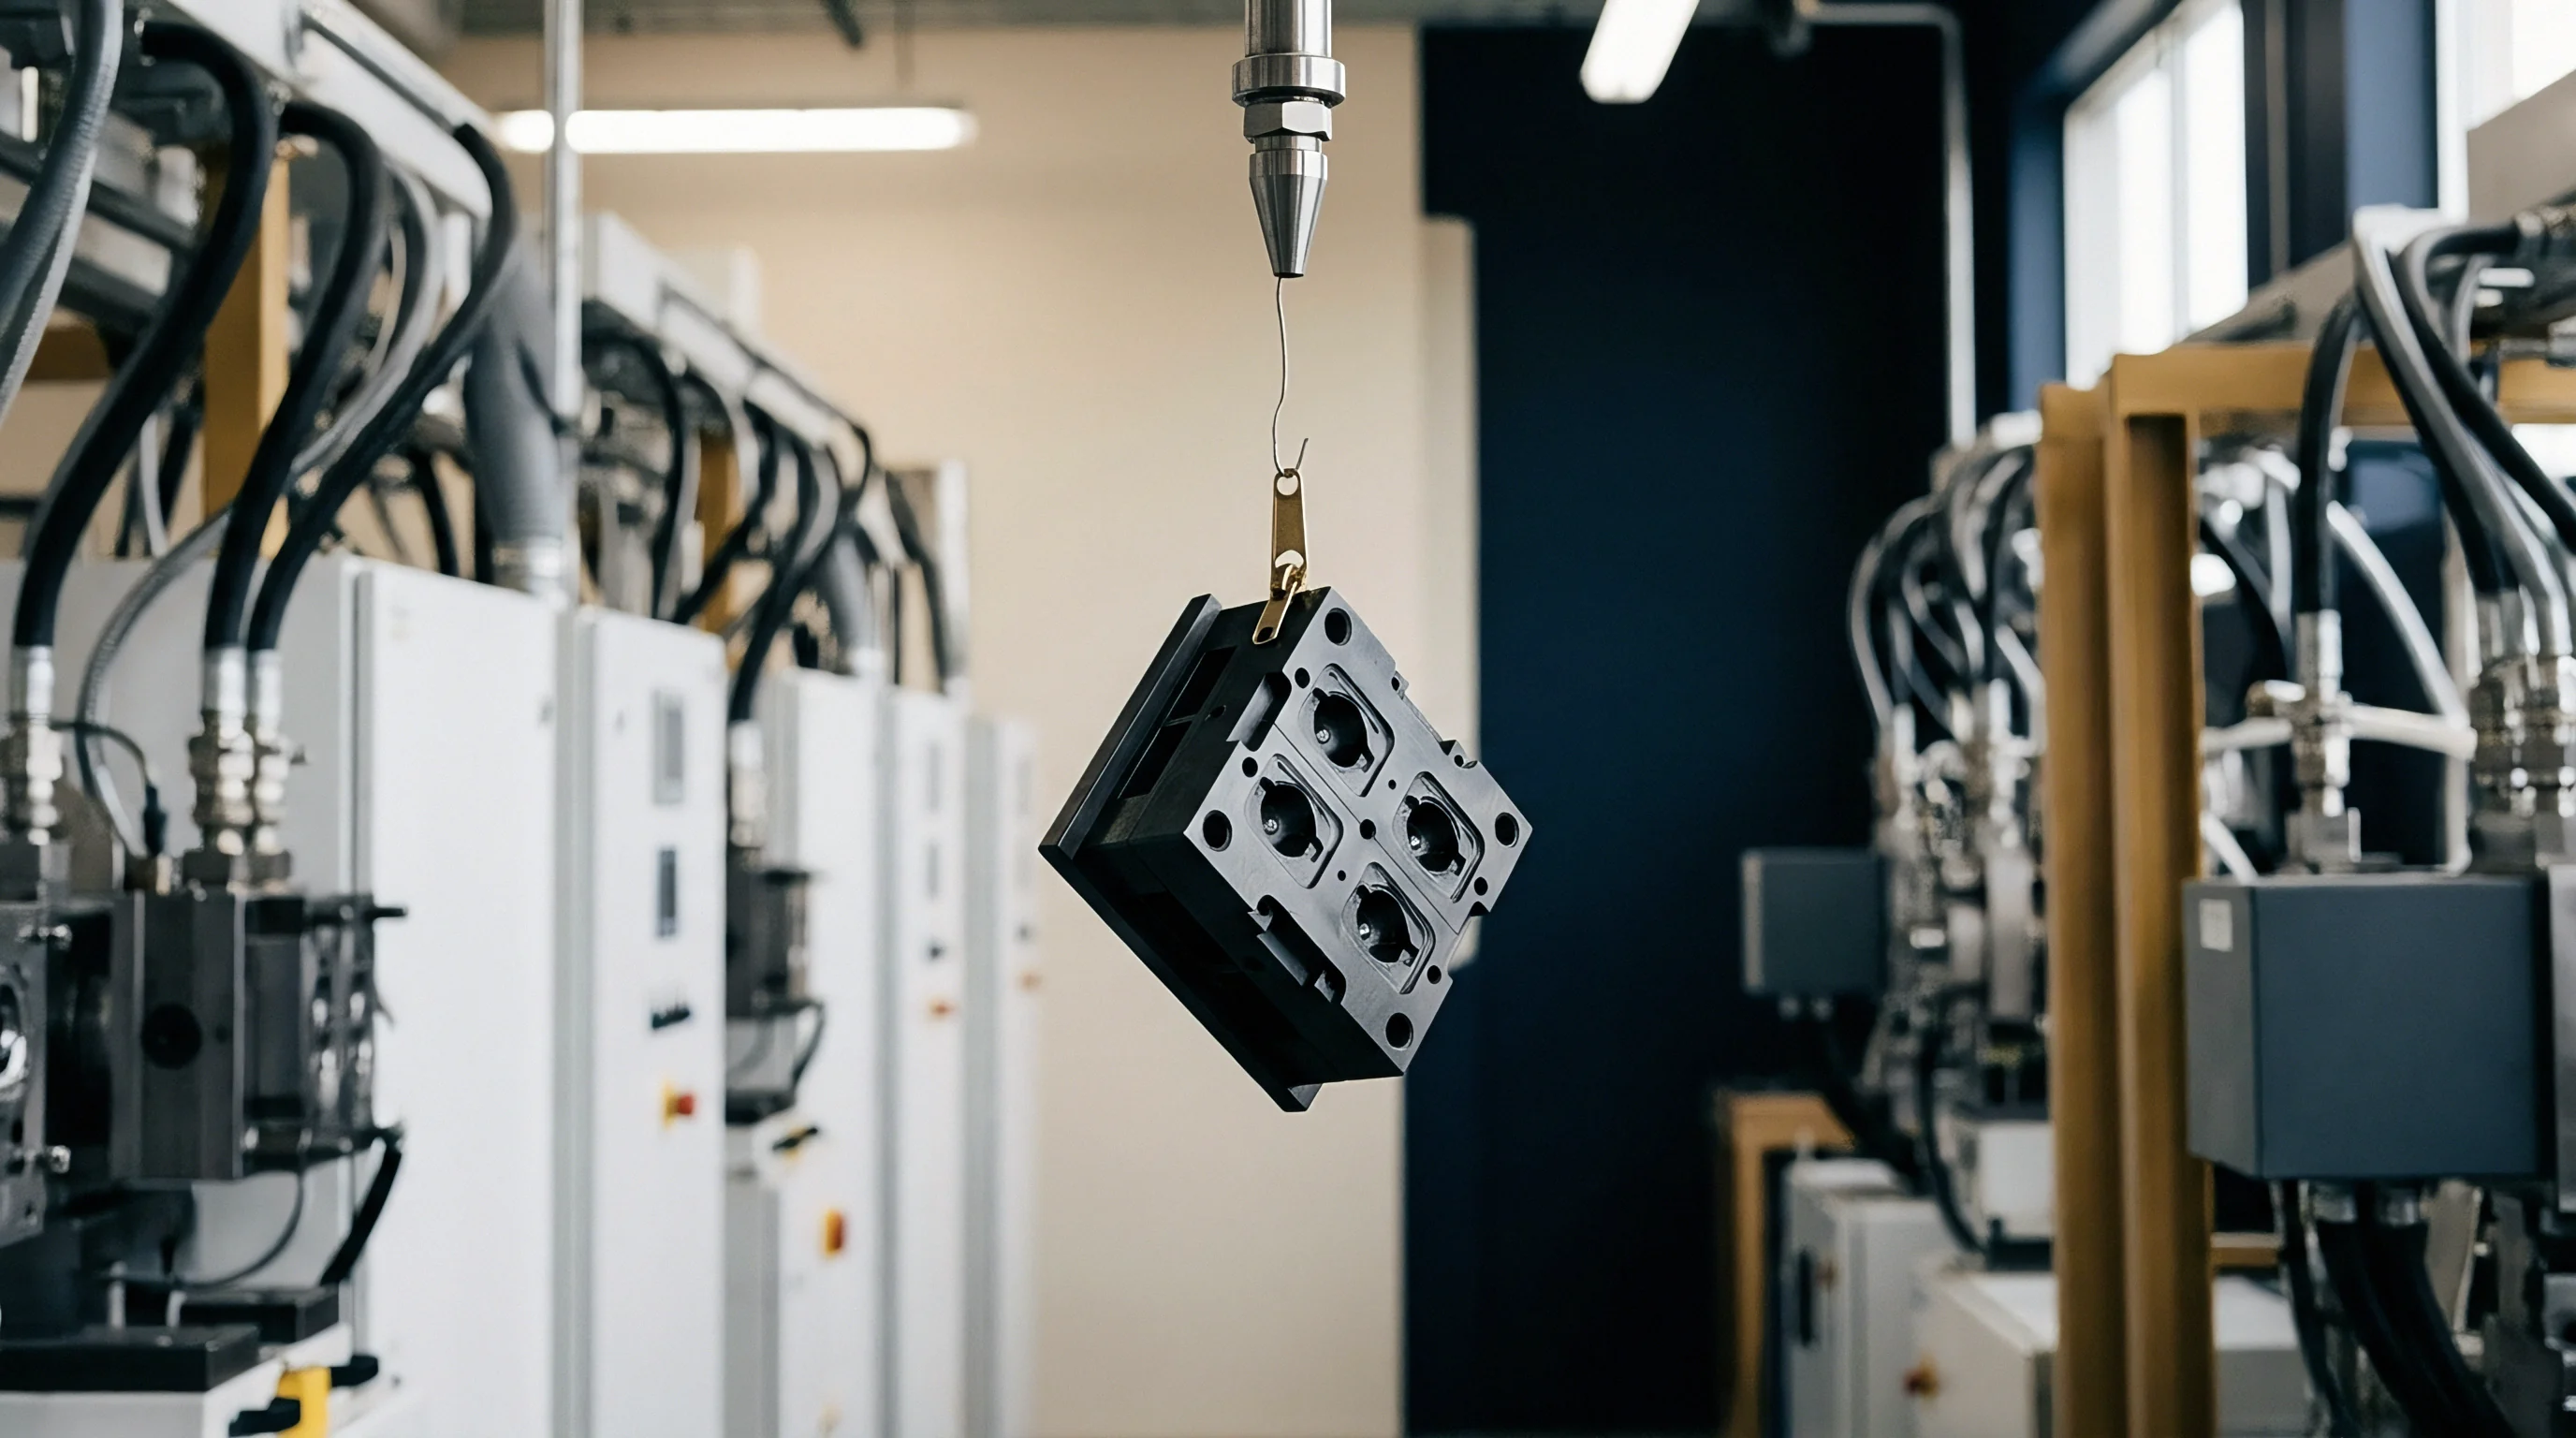
Tool transfer protocols govern physical delivery and commissioning when a qualified multi-cavity mould moves from the toolmaker’s shop floor to the production site. Vibration during intercontinental transit, corrosion during ocean freight, and thermal contraction induce physical alterations in delicate tool components. Protective packaging standards dictate anti-corrosion VCI barrier wraps, desiccant packs, and rigid steel crate transport frames.
Pre-Shipment Inspections and Spare Component Provisioning
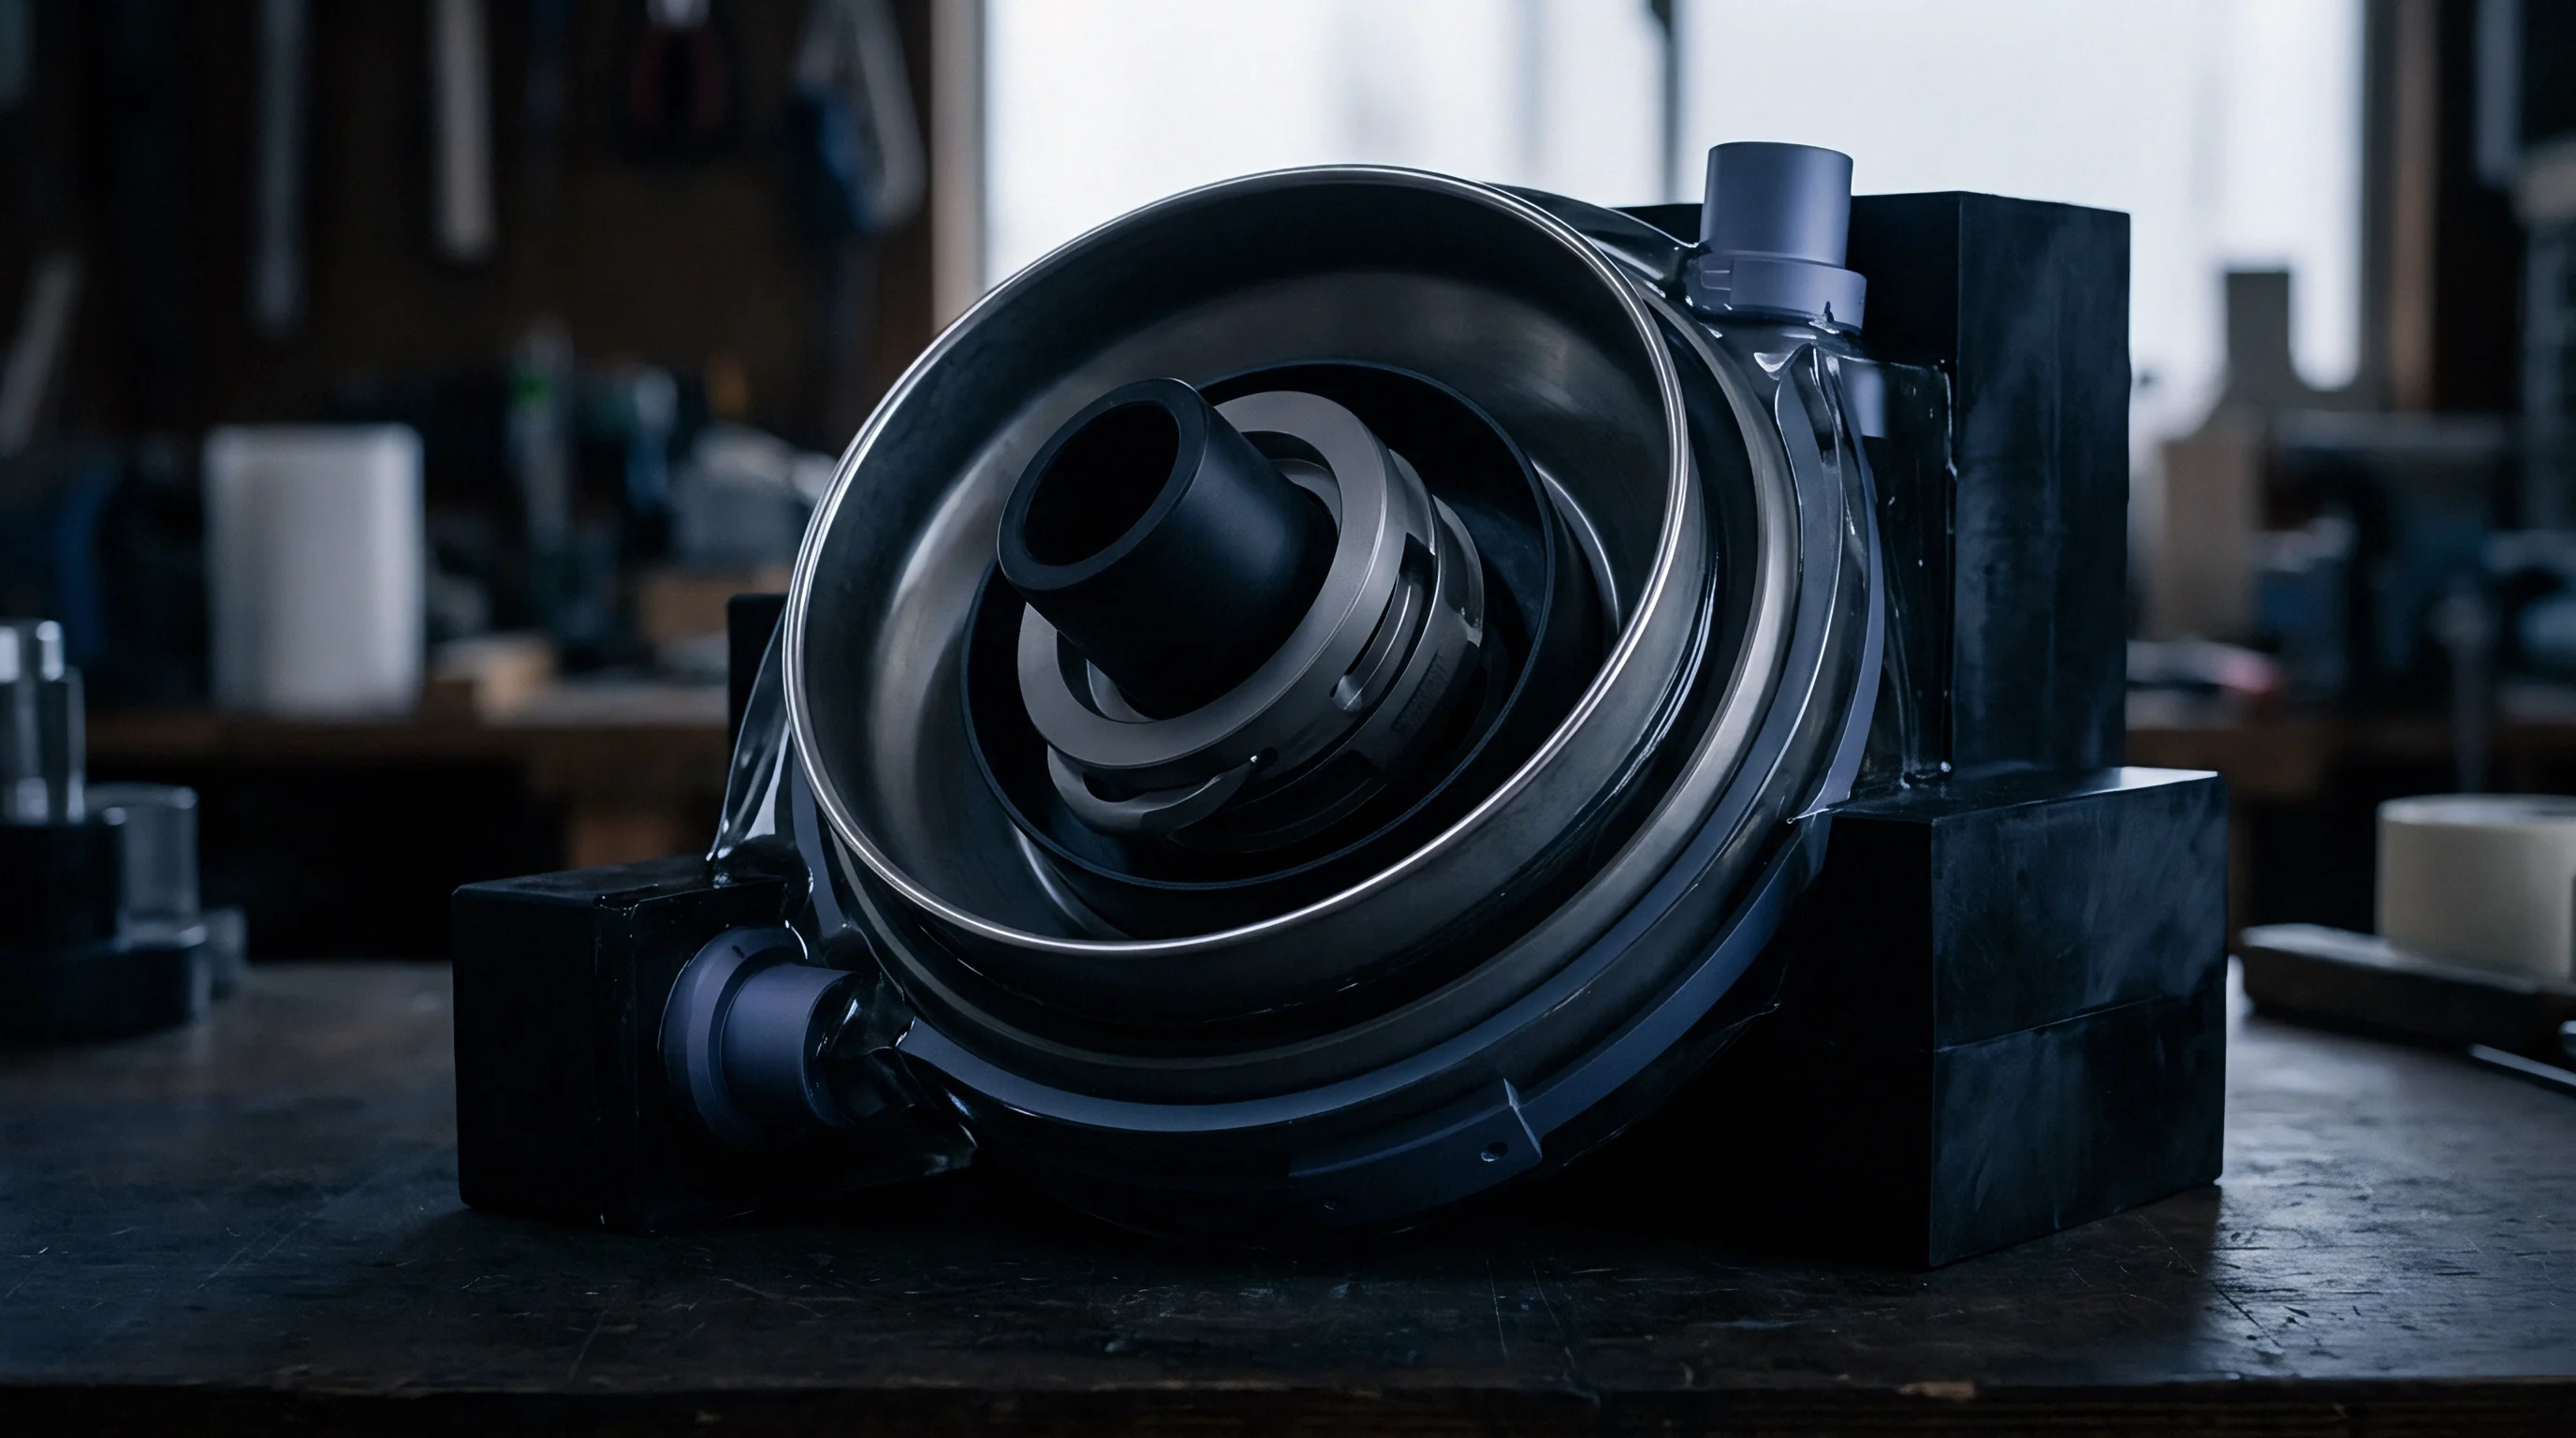
Tooling sign-off at the mold maker requires running a dry cycle inspection before boxing. Slide locks, return pins, and mechanical latches are locked in transit positions. Water channels are blown clean with compressed air and pressurized with nitrogen to expel residual fluid that causes internal cooling line corrosion.
Spare parts kits shipped with high-cavitation tooling mitigate downtime during volume production. Interchangeable core pins, gate inserts, heater bands, thermocouples, and ejector pins require pre-fitting during initial tool manufacturing to guarantee true drop-in replacement without hand fitting.
Commissioning at the receiver facility replicates the factory acceptance trial parameter for parameter. Matching oil temperatures, water flow rates, back pressure settings, and injection velocities validates process transferability across different machine models.
The operational handover checklist requires recording:
- Platen Clamping Forces Tie-bar strain gauge measurements ensure balanced clamp force distribution across the tool shut-off surfaces.
- Cooling Circuit Differential Pressure Inlet and outlet pressure gauge values are logged for every circuit to confirm zero blockage during shipping.
- Hot Runner Insulation Resistance Megohmmeter testing checks drop heaters for moisture ingress prior to applying thermal power.
- Ejector System Alignment Hydraulic ejector plate actuation is verified for smooth travel throughout maximum stroke length.
Discrepancies in machine hydraulics, screw geometry, or clamp deflection between development and production presses often require fine-tuning process parameters to reproduce original dimensional results.
How do production facilities verify that structural steel alignments and shut-off face clearances remained intact after ocean transport without completely dismantling the core and cavity plates?

Yield
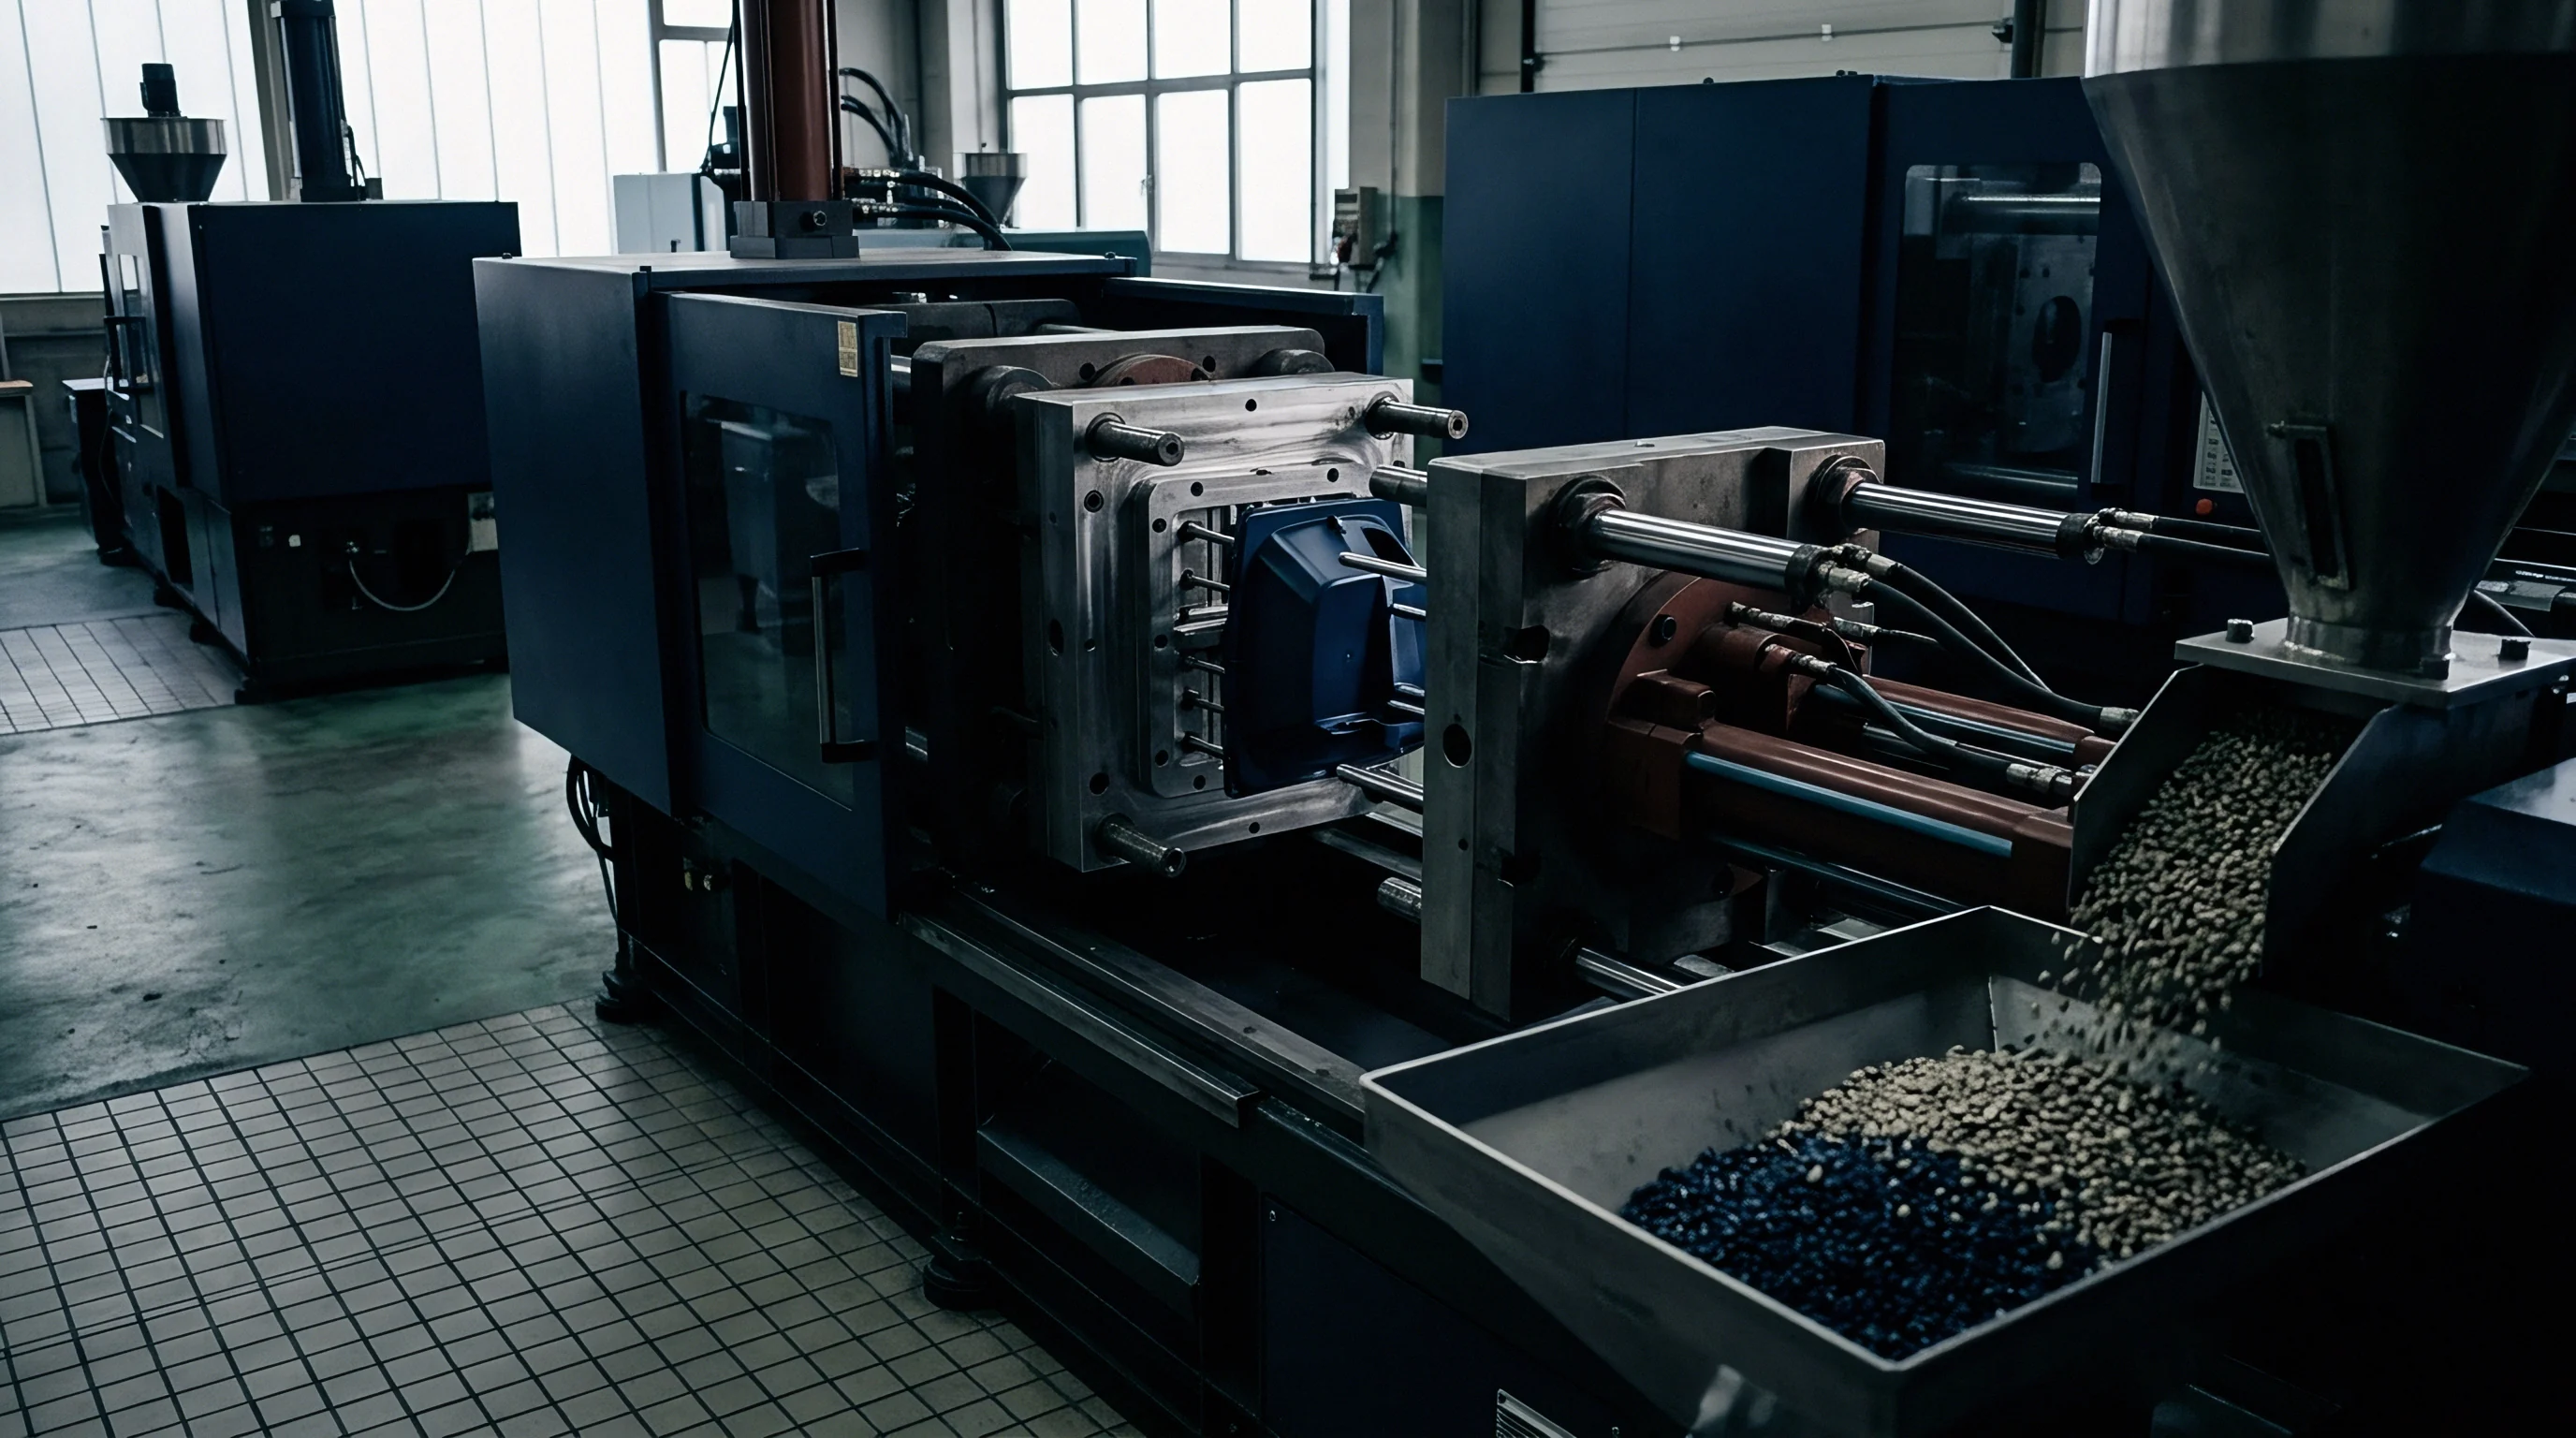
Commercial viability in multi-cavity injection moulding depends directly on net usable output rather than theoretical cavity count. Operating a 32-cavity tool with two cavities blocked out due to flash or core pin bending drops total output by 6.25 percent while running identical machine hourly rates. Tooling investment payback models break down when unbudgeted cavity lockouts extend overall production run times.

Economics of Cavitation Scaling
Selecting cavitation levels involves evaluating tooling capital cost against unit piece price reduction across total product lifecycle volume. Doubling cavitation from 16 to 32 cavities increases initial tooling expenditure by approximately 65 to 80 percent due to manifold complexity and precision machining demands. Overall cycle time typically increases slightly in higher-cavitation tools due to larger runner volume and complex cooling paths.
Consider a component produced at a volume of 5,000,000 units annually in a resin costing 2.80 USD per kilogram. The part mass is 12.0 grams. Comparing a 16-cavity tool running at an 11.5-second cycle time against a 32-cavity tool running at a 12.8-second cycle time reveals the underlying operational mechanics.
| Evaluation Metric | 16-Cavity Option | 32-Cavity Option | Variance Impact |
|---|---|---|---|
| Initial Tooling Capital Cost | $115,000 | $198,000 | +$83,000 outlay |
| Press Clamping Force Class | 200 Tonne | 400 Tonne | Higher machine hour rate |
| Press Machine Rate ($/hr) | $45.00 | $72.00 | +$27.00 per hour |
| Base Cycle Time (seconds) | 11.5 s | 12.8 s | +1.3 s cycle duration |
| Gross Hourly Part Output | 5,008 units | 9,000 units | +79.7% production rate |
| Direct Processing Cost per 1k Units | $8.98 | $8.00 | -$0.98 per 1k units saved |
| Annual Operating Machine Hours | 998 hours | 555 hours | 443 machine hours liberated |
| Scrap Rate Allocation Assumption | 1.5% overall | 3.2% overall | Higher multi-cavity scrap risk |
Evaluating this comparison demonstrates that higher cavitation yields lower machine hours and frees press capacity, but requires substantially higher initial capital investment and carries elevated scrap risks. When a single cavity fails in a 32-cavity tool, sorting good parts from defective parts requires automated vision systems or dedicated multi-cavity handling robotics at press side, adding downstream capital equipment costs.
Mould maintenance cycles scale with total accumulated cycles rather than unit volume. High-cavitation tooling demands scheduled preventative maintenance to clean vents, replace worn ejector sleeve assemblies, and refurbish hot runner tips, representing an ongoing operational expense line item that must be factored directly into landed piece price models.