Dynamic Viscosity Curve Generation and Transfer Point Calibration in Technical Molding
Calibrating transfer points via press-side viscosity curves optimizes fill pressure, cuts part mass variation, and locks in DIN 16742 tolerance bands.


Shear
Melt behavior inside an injection molding barrel depends on polymer chain entanglements under mechanical velocity. As screw speed advances resin through the nozzle, sprue, and runner system, molecules uncoil and align parallel to the direction of flow, dropping fluid resistance. This non-Newtonian shear-thinning response means material viscosity changes rapidly at varying fill speeds.
Establishing an accurate press-side viscosity curve requires measuring the exact dynamic pressure drop across the nozzle orifice at incremental shot velocities.
Laboratory capillary rheometers provide standardized material datasheets, yet these static figures fail to replicate the complex thermal histories and rapid compression stages encountered inside a production press. Screw geometry, check ring clearances, barrel heating profiles, and nozzle tip friction introduce shear energy that alters resin resistance prior to cavity entry. Generating an in-mold viscosity curve directly on the production injection machine accounts for these physical variables, establishing a reliable baseline for process optimization.

Rheological Characterization on the Production Floor
Polymers exhibit non-Newtonian flow mechanics where apparent fluid resistance decreases as injection velocity rises. At low injection speeds, polymer chains remain tangled, offering high resistance to flow. As velocity increases, shear stress breaks temporary intermolecular bonds, causing a sharp drop in apparent viscosity.
At ultra-high injection rates, molecular alignment reaches a saturation limit where viscosity plateaus into an upper Newtonian regime.
Determining the transition point between the steep shear-thinning region and the flat plateau defines the stable process window. Technical molding demands operating within this plateau region. Minor velocity fluctuations inside the plateau create negligible viscosity changes, insulating part dimensions from machine hydraulic drift.
Apparent shear rate inside a circular nozzle passage calculates through physical flow velocity and passage radius:
γ = 4Q / (π · r³)
Where γ represents wall shear rate in reciprocal seconds, Q represents volumetric flow rate in cubic millimeters per second, and r represents internal nozzle radius in millimeters. Effective viscosity calculates simultaneously:
η = (ΔP · r) / (2 · L · γ)
Where η represents apparent viscosity in Pascal-seconds, ΔP represents dynamic injection pressure drop in Megapascals, and L represents effective nozzle land length in millimeters.
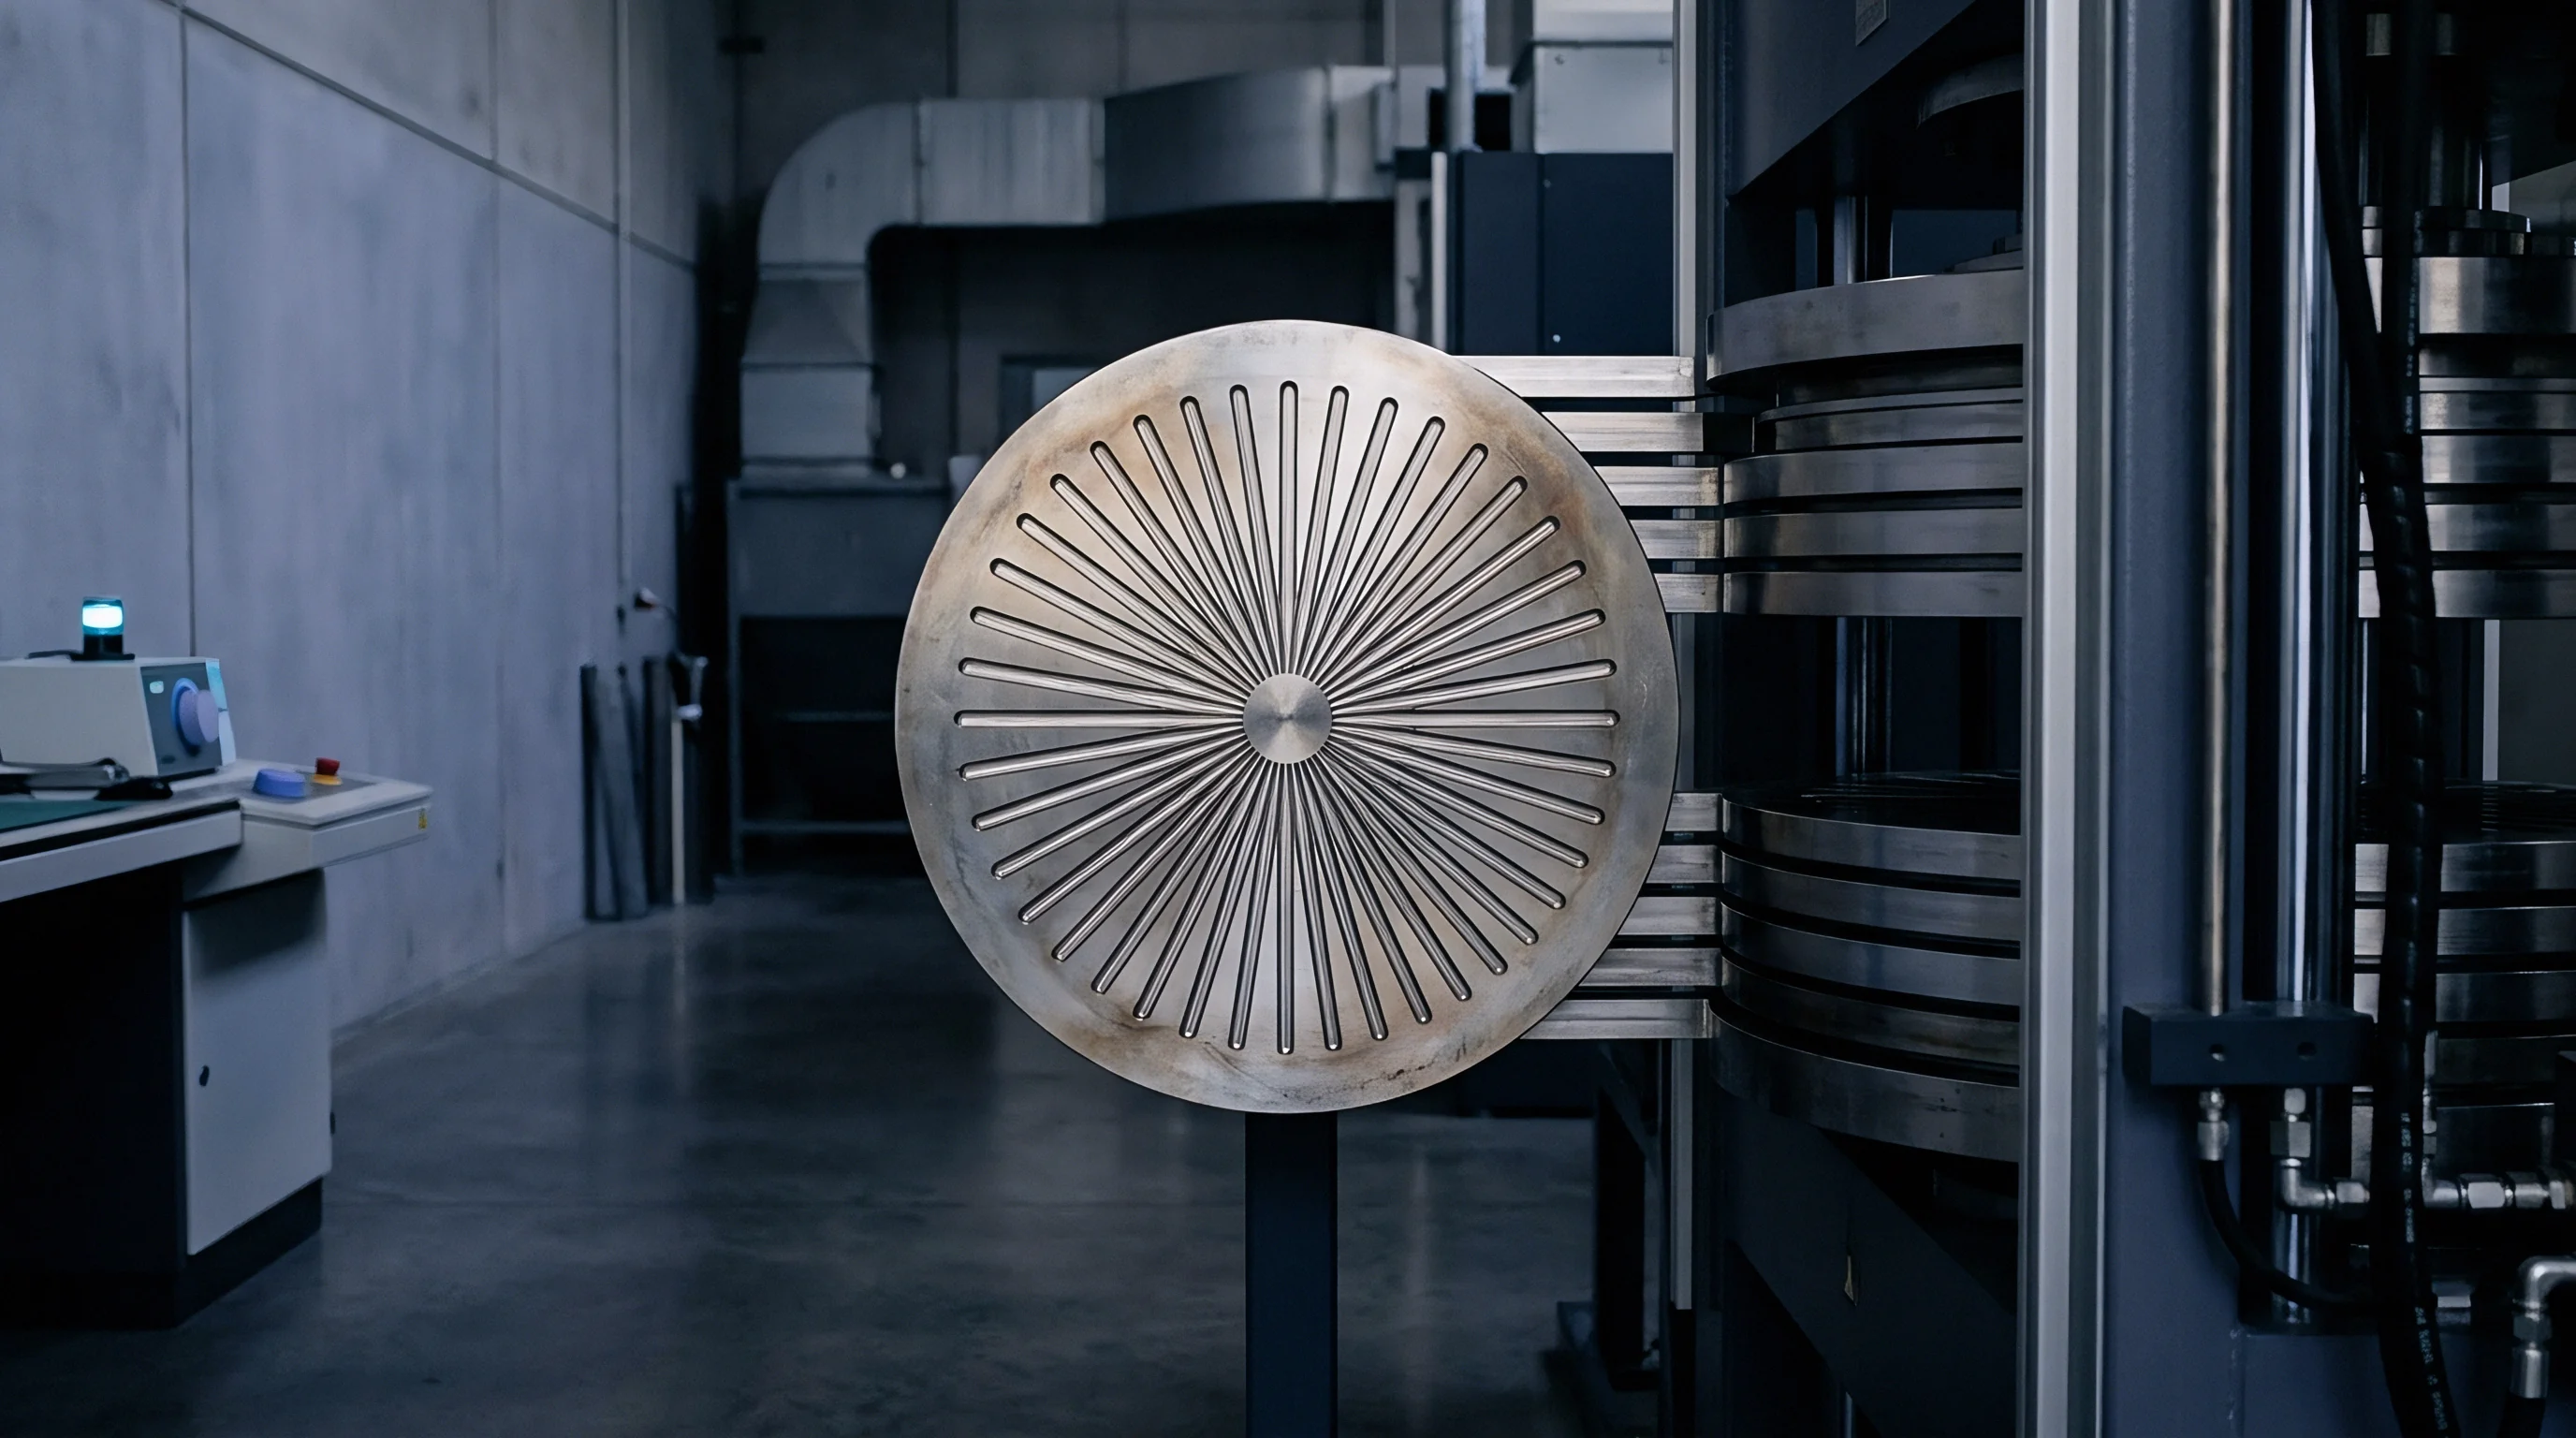
Data Collection during Injection Velocity Steps
Profiling melt flow requires running incremental injection speed stages on an unsealed tool or through an open barrel. The operator sets the machine injection stroke to fill 95 percent of the part volume without applying hold pressure. Starting at a minimum injection velocity of 10 millimeters per second, the press injects material while recording peak hydraulic or melt pressure.
The velocity increases systematically across ten discrete steps up to machine maximum speed, typically 250 millimeters per second.
Calculating shear rate and apparent viscosity for each speed step yields raw data points that map the resin viscosity curve. Plotting shear rate on the horizontal logarithmic axis and apparent viscosity on the vertical logarithmic axis reveals the characteristic flow response of the specific resin lot.
- Purge the barrel thoroughly and verify melt temperature stability using a calibrated immersion thermocouple probe.
- Retract the nozzle, set injection velocity to ten millimeters per second, and record peak hydraulic transfer pressure during free shot discharge.
- Increase injection speed incrementally in ten equal steps while recording velocity and injection unit pressure outputs.
- Convert machine hydraulic pressure into melt pressure using the specific intensifier ratio of the injection unit stroke.
- Plot log viscosity against log shear rate to identify the plateau zone where viscosity curve slope levels off below minus zero point fifteen.
Because melt viscosity governs fill dynamics, the resulting curve establishes the minimum injection speed needed to reach the shear-thinning plateau. Operating below this critical threshold exposes cavity filling to extreme pressure variations, causing short shots or flash whenever material batch viscosity varies.
Relative viscosity drops by up to sixty percent when shear rates shift from one hundred to one thousand reciprocal seconds in glass-filled polyamide.
| Resin Type | Glass Content (%) | Critical Shear Threshold (1/s) | Viscosity at Plateau (Pa·s) | Power-Law Exponent (n) |
|---|---|---|---|---|
| Polyamide 66 (PA66) | 30 | 850 | 120 | 0.28 |
| Polybutylene Terephthalate (PBT) | 15 | 600 | 180 | 0.34 |
| Polycarbonate (PC) | 0 | 1200 | 310 | 0.42 |
| Polyoxymethylene (POM) | 0 | 450 | 210 | 0.31 |
Determining whether a specific resin batch will maintain flow stability through a multi-cavity hot runner system remains difficult when tool cooling channel layouts restrict localized heat extraction.


Switch
Transitioning control from volumetric stroke to pressure regulation forms the core boundary in scientific molding. Machine control switches from velocity-controlled filling to pressure-controlled packing at the precise moment the cavity reaches nearly full volume. Setting transfer point location too early causes excessive hold pressure dependence, resulting in non-uniform wall shrinkage.
Delaying switchover past full volumetric fill subjects tool parting lines to extreme hydraulic spikes, forcing mold steel apart and creating part flash.
Calibrating the exact transfer position requires decouple molding protocols. Decoupled process architecture splits filling into three distinct phases: volumetric stroke, pressure packing, and thermal holding. Locking ninety-five to ninety-eight percent of component mass into the rapid volumetric fill phase ensures that mold filling remains insensitive to thermal sink shifts during the later holding stage.
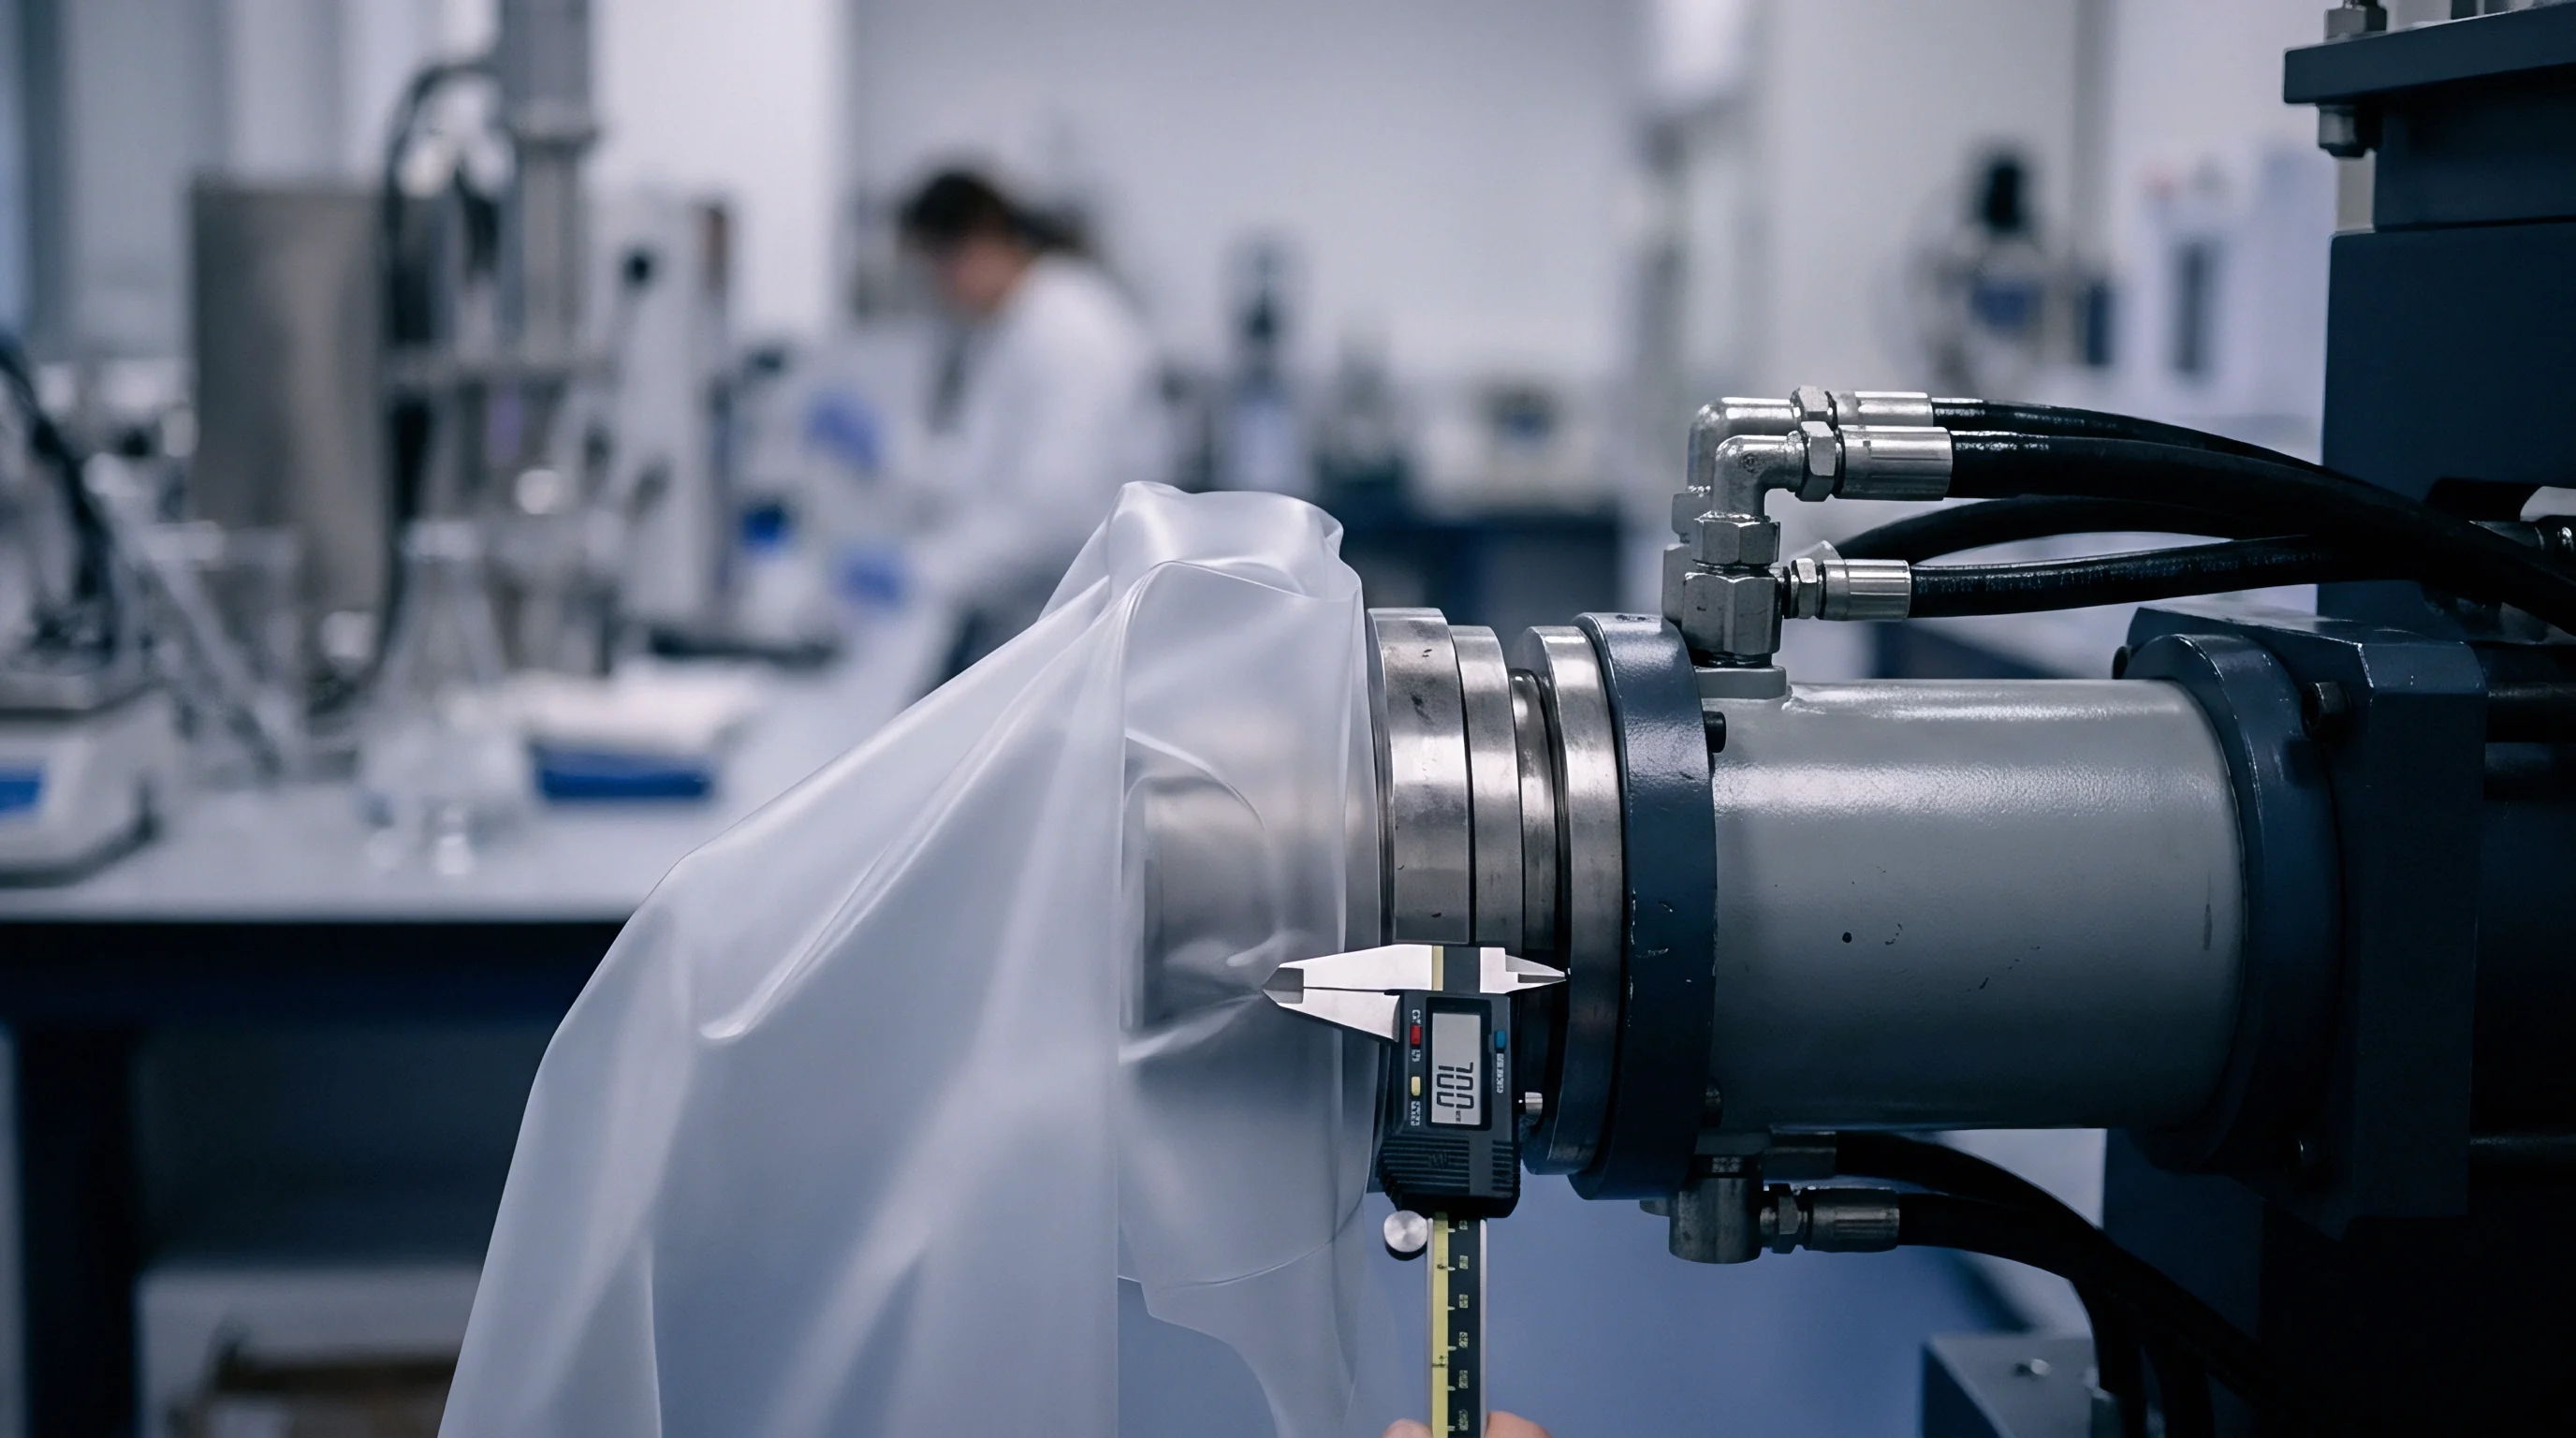
Mechanics of Volumetric Transition Control
Plunger displacement tracking relies on linear transducers sending position signals back to the machine controller. As the screw advances, the encoder monitors physical position down to hundredths of a millimeter. When the screw passes the preset transfer stroke value, the controller commands the hydraulic valve array or servo drive to switch from velocity control to hold pressure control.
Position switchover offers high repeatability when melt cushion remains stable. Cushion variations caused by check ring leakage alter actual volumetric fill at the precise moment of switchover. If cushion size varies by two millimeters, the physical volume delivered to the cavity changes, altering part weight prior to pack pressure application.
Process repeatability improves tenfold when transfer positions hold within zero point zero five millimeters of calibrated stroke targets.
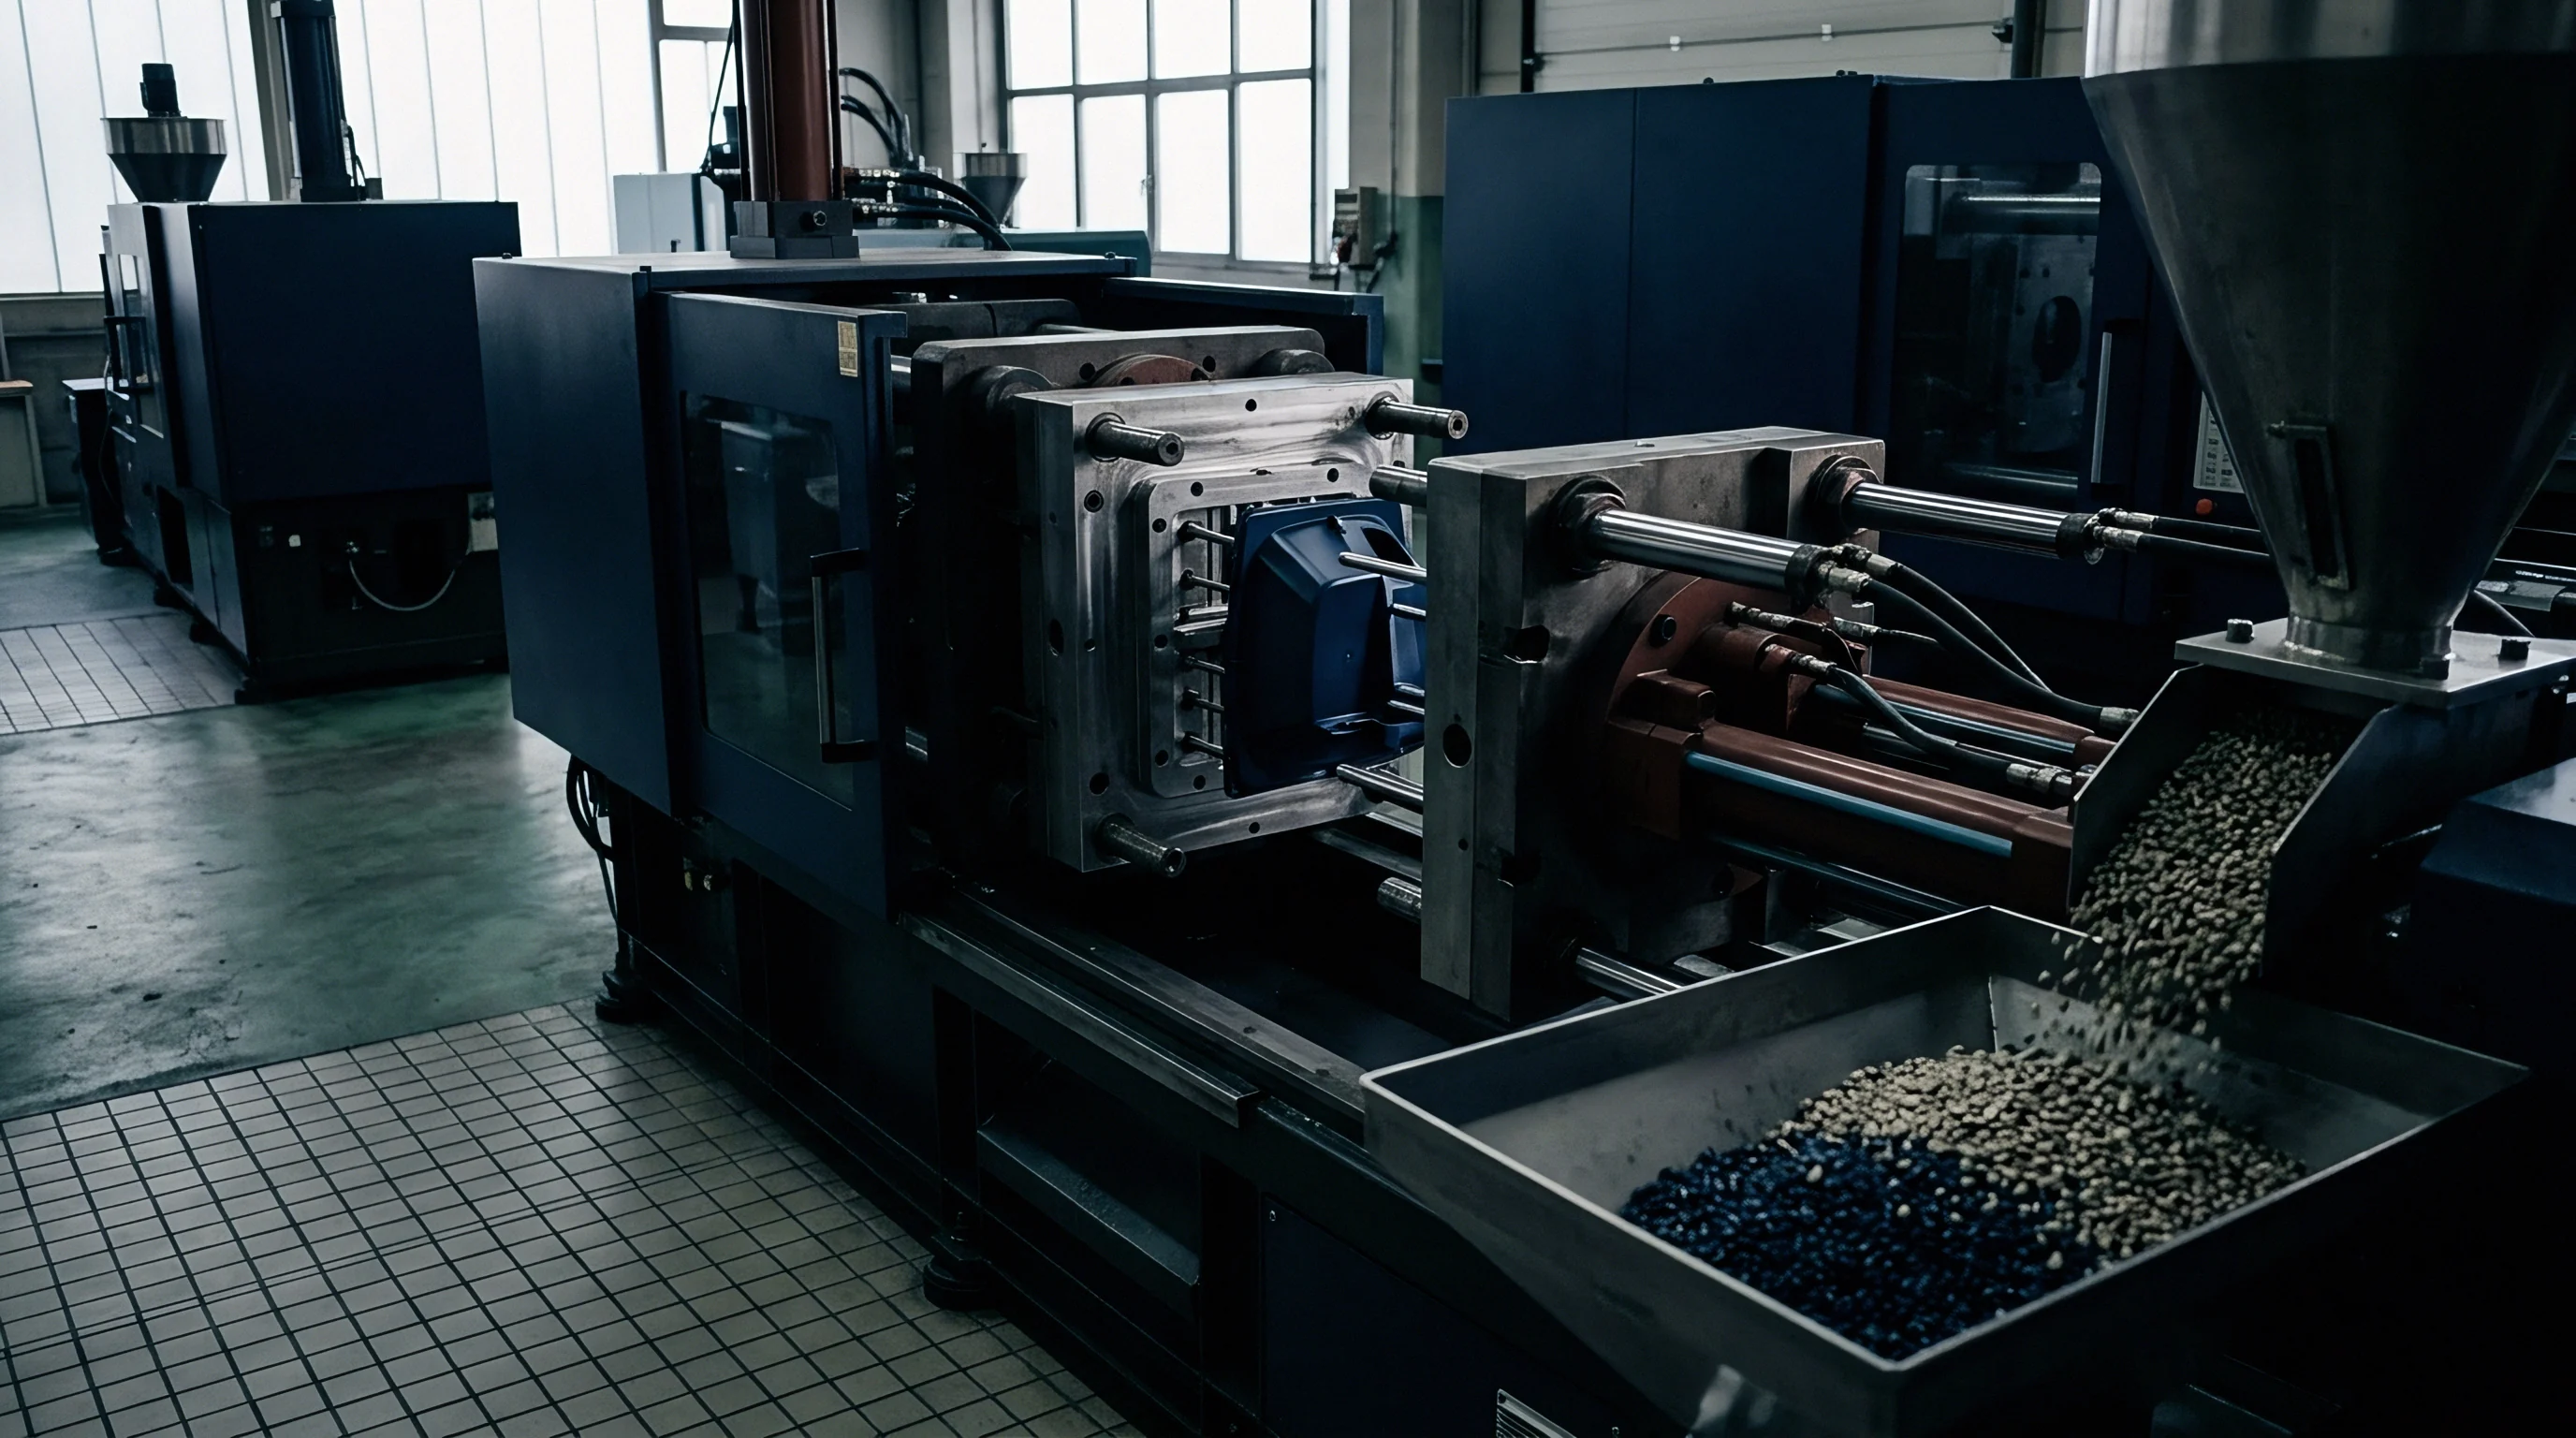
Which Transducer Type Delivers Superior Transfer Precision?
Piezoelectric quartz sensors installed behind cavity ejector pins respond instantaneously to physical melt arrival. Linear position transducers measure screw stroke outside the mold, missing dynamic compression of resin inside the barrel. Hydraulic strain gauges track oil line spikes, introducing temporal delays caused by fluid compressibility.
Cavity pressure switchover eliminates machine mechanical variables by triggering the pressure transition only when resin physically contacts the sensor tip inside the tool cavity.
In-mold sensors trigger switchover independent of cushion fluctuations, check ring slip, or thermal expansion of the injection screw. When resin fills ninety-seven percent of the mold impression, cavity pressure climbs sharply. The sensor detects this rising edge, sending a direct digital signal to switch machine control modes instantly.
- Positional Transfer Trigger ignores material compressibility inside the barrel, leading to shot mass variation when cushion thickness drifts.
- Hydraulic Pressure Trigger senses line pressure spikes caused by mechanical friction inside the injection cylinder rather than cavity fill state.
- Cavity Pressure Trigger measures absolute resin force directly behind the mold wall, delivering peak switchover accuracy regardless of resin viscosity shifts.
- Optical Encoder Trigger captures micro-step position changes along the screw shaft but remains blind to check ring wear and valve slip.
Volumetric transfer point setup relies on stopping the primary fill stage precisely when the short-shot weight reaches ninety-six percent of final component mass without hold pressure engaged.
A two percent shift in transfer stroke volume alters part linear shrink rates beyond DIN 16742 tolerance limits.
Proper transfer point calibration demands setting screw position switchover while hold pressure remains set to absolute zero.


Cavity
Internal mold impression pressure profiles dictate part density and freeze timing. Once melt enters through the gate, continuous pressure transmission packs polymer molecules into sub-micron steel textures. Monitoring cavity pressure decay profiles provides real-time verification of gate seal timing.
Gate seal occurs when resin inside the gate orifice freezes solid, preventing directional backflow of polymer from the cavity into the runner system during screw recovery.
Calibrating hold pressure duration requires a systematic gate seal study. The press operator increases hold time in one-second increments while holding hold pressure constant. Part weight increases linearly with hold time until the gate freezes completely.
Once gate seal forms, additional hold time yields zero part weight increase. Running hold time beyond gate seal wastes electrical power and extends total process cycle time unnecessarily.

Piezoelectric Sensing and Gate Freeze Determination
In-mold strain gauges capture instantaneous force changes as resin fills tool geometries. Modern piezoelectric sensors utilize quartz crystals that generate electrical charges proportional to applied mechanical force. Installed beneath ejector pins or directly facing the cavity wall, these sensors produce voltage curves that mirror real-time internal flow mechanics.
The resulting pressure curve exhibits three key zones: rapid pressure rise during volumetric fill, packing peak under holding pressure, and exponential decay as cooling progresses. Analyzing the decay slope reveals local thermal dissipation rates and identifies non-uniform wall cooling issues before parts exit the press.
| Switchover Mode | Mass Variance (%) | Tooling Cost Increase (%) | Flash Risk Level | Setup Complexity |
|---|---|---|---|---|
| Screw Position (Linear) | ±0.45 | 0.0 | Moderate | Low |
| Hydraulic Pressure | ±0.85 | 1.5 | High | Low |
| Direct Cavity Pressure | ±0.08 | 12.0 | Minimal | High |
| Indirect Cavity Pressure | ±0.12 | 8.5 | Minimal | Medium |

Pressure Losses across Runner Networks and Gates
Flow channel geometries generate substantial energy drops before resin reaches the mold impression. Narrow sub-gates and cold sprues restrict melt movement, requiring higher machine hydraulic force to maintain volumetric fill rates. High pressure drops across gates elevate localized shear heating, localized degradation, and core plate deflection.
Calculating pressure loss across individual runner segments isolates balancing issues in multi-cavity tooling. Symmetrical runner paths ensure equal arrival timing and uniform pressure transfer across all cavities simultaneously.
- Sensor Pin Positioning must sit at the end of the fill path opposite the gate to capture true volumetric completion.
- Pin Clearance Tolerances must not exceed zero point zero08 millimeters to avoid resin flash migration into sensor bores.
- Charge Amplifier Calibration must match sensor pico-Coulomb output ranges to prevent signal clipping at peak packing force.
- Thermal Isolation Shields must surround direct-mount sensors to prevent thermal drift errors during steady-state molding.
Setting hold pressure fifty percent above volumetric transfer pressure without verifying gate freeze causes gate sink, voids, and core pin breakage.
Contractual quality acceptance mandates that cavity pressure curve peak variations remain under five percent across entire lot production runs under ISO 20457.
Skipping gate seal verification during tool commissioning leads directly to sink mark formation and unrecoverable dimensional rejects during volume production.

Drift
Thermal shifts across continuous molding shifts alter polymer viscosity independent of machine control settings. Regrind blend percentage changes, ambient air temperature shifts, and hopper drying variations create resin viscosity fluctuations over twenty-four-hour manufacturing cycles. A process calibrated tightly during morning startup will drift out of dimensional compliance by afternoon if switchover points rely solely on static screw position limits.
Viscosity drift shifts the relationship between screw speed and delivered hydraulic force. When resin viscosity rises due to lower melt temperature, the machine requires higher injection pressure to maintain the set velocity. If transfer relies on hydraulic pressure thresholds, the system triggers switchover prematurely, leaving parts short.

Polymer Degradation and Rheological Shifts across Shifts
Extended residence times inside heated barrel zones break material polymer chains. Thermal degradation lowers material molecular weight, increasing resin flowability. High flowability causes material to fill cavities faster under identical pressure settings, increasing part density and causing tool flashing.
Maintaining constant melt history requires tight control of screw recovery speed, back pressure, and cycle time cadence. Screw recovery must utilize eighty percent of available cooling time to ensure uniform thermal dissipation across the screw flights.

Thermal Equilibrium in High-Speed Molding Cycles
Mold steel temperatures fluctuate until cooling water turbulence stabilizes heat extraction. Reynolds numbers inside cooling circuits must exceed four thousand to maintain fully turbulent water flow. Laminar cooling water flow allows heat boundaries to form along circuit walls, causing mold steel temperatures to creep upward across night shifts.
Thermal balance dictates cycle speed. As steel temperature climbs, resin inside the cavity cools slower. Slow cooling delays gate freeze timing, altering final part shrinkage and linear dimensions unless hold time adjusts dynamically.
- Moisture Content Fluctuations in hygroscopic materials like polyamide cause severe polymer chain scission and dynamic viscosity drops inside the barrel.
- Regrind Percentage Spikes introduce pre-sheared material with lower molecular weight, shifting the baseline shear curve downward unpredictably.
- Color Masterbatch Additives act as internal lubricants, altering melt rheology and shifting shear-thinning plateau limits.
- Barrel Heater Band Cycling generates localized thermal waves along the barrel wall, changing resin core temperature between machine cycles.
Batch-to-batch melt flow rate variations within published datasheet limits, combined with thermal degradation inside the barrel, frequently drive dimensional drift across production shifts.


Toll
Scrap rates and rework cycles directly impair the financial return of production tooling. Tooling built for precision technical parts requires tight process control windows to achieve target piece pricing. Uncalibrated transfer points and dynamic viscosity shifts increase unit reject rates, burning machine hours and raw material budgets without generating sellable inventory.
Quantifying the financial cost of poor process calibration reveals significant loss potential. Consider a typical 32-cavity tool producing precision electrical housings from thirty percent glass-filled polyamide 66 on a 150-tonne electric press. Machine shop rates sit at sixty-five dollars per hour, material costs six dollars per kilogram, and targeted cycle time runs at precisely twelve seconds.

Commercial Economics of In-Mold Process Qualification
Tooling qualification protocol costs yield immediate returns by locking in repeatable cycle times. Without dynamic viscosity mapping and transfer point calibration, process shift scrap rates average four point five percent. Calibrating the process using scientific molding principles reduces scrap below zero point two percent while cutting cycle time by eight-tenths of a second through gate seal optimization.
Flashing mold steel damages delicate core pins and shut-off faces over time. Repeated flash events force early tool refurbishment, consuming maintenance budgets and cutting planned tool life short by hundreds of thousands of cycles.
| Process Calibration Status | Annual Production Volume | Scrap Rate (%) | Cycle Time (s) | Total Cost per 1k Good Parts ($) |
|---|---|---|---|---|
| Uncalibrated Standard Setup | 10,000,000 | 4.50 | 12.8 | 88.40 |
| Position Calibrated Setup | 10,000,000 | 1.20 | 12.2 | 81.10 |
| Cavity Pressure Calibrated Setup | 10,000,000 | 0.15 | 12.0 | 77.20 |

Dimensional Tolerances and Part Mass Stability
Holding precision features under standard ISO 20457 guidelines requires narrow injection cushion windows. Part mass repeatability serves as the primary early indicator of dimensional stability. When part mass variations stay within a three-sigma band of zero point one percent, linear dimensions reliably hold Grade TG4 tolerances under DIN 16742.
Part mass correlates directly with cavity pressure, making cushion stability essential for protecting part density and preventing flash along parting lines. Because high press rates make yield critical to profitability, keeping dimensions from drifting across shifts protects both tooling steel and long-term operating margins.
Master supply agreements for technical components specify that tool ownership transfers only upon presentation of a complete scientific process qualification dossier containing verified dynamic viscosity curves, gate seal studies, and cavity pressure repeatability records.