Constructing Master Curves for Thermoplastic Tensile Creep Modulus Extrapolation
Constructing master curves requires shifting short-term ISO 899-1 isothermal creep data via WLF or Arrhenius models within linear viscoelastic stress boundaries.
Grip
Tensile creep testing begins with clamping mechanics inside an isothermal chamber controlled to within 0.5 degrees Celsius under ISO 899-1. When an axial dead load couples to an injection-moulded ISO 20753 Type 1A multipurpose dogbone, mechanical contact points determine whether the extensometer captures true viscoelastic elongation or gauge seated slip. Pneumatic serrated clamps cold-flow the specimen shoulders during the initial application of weight.
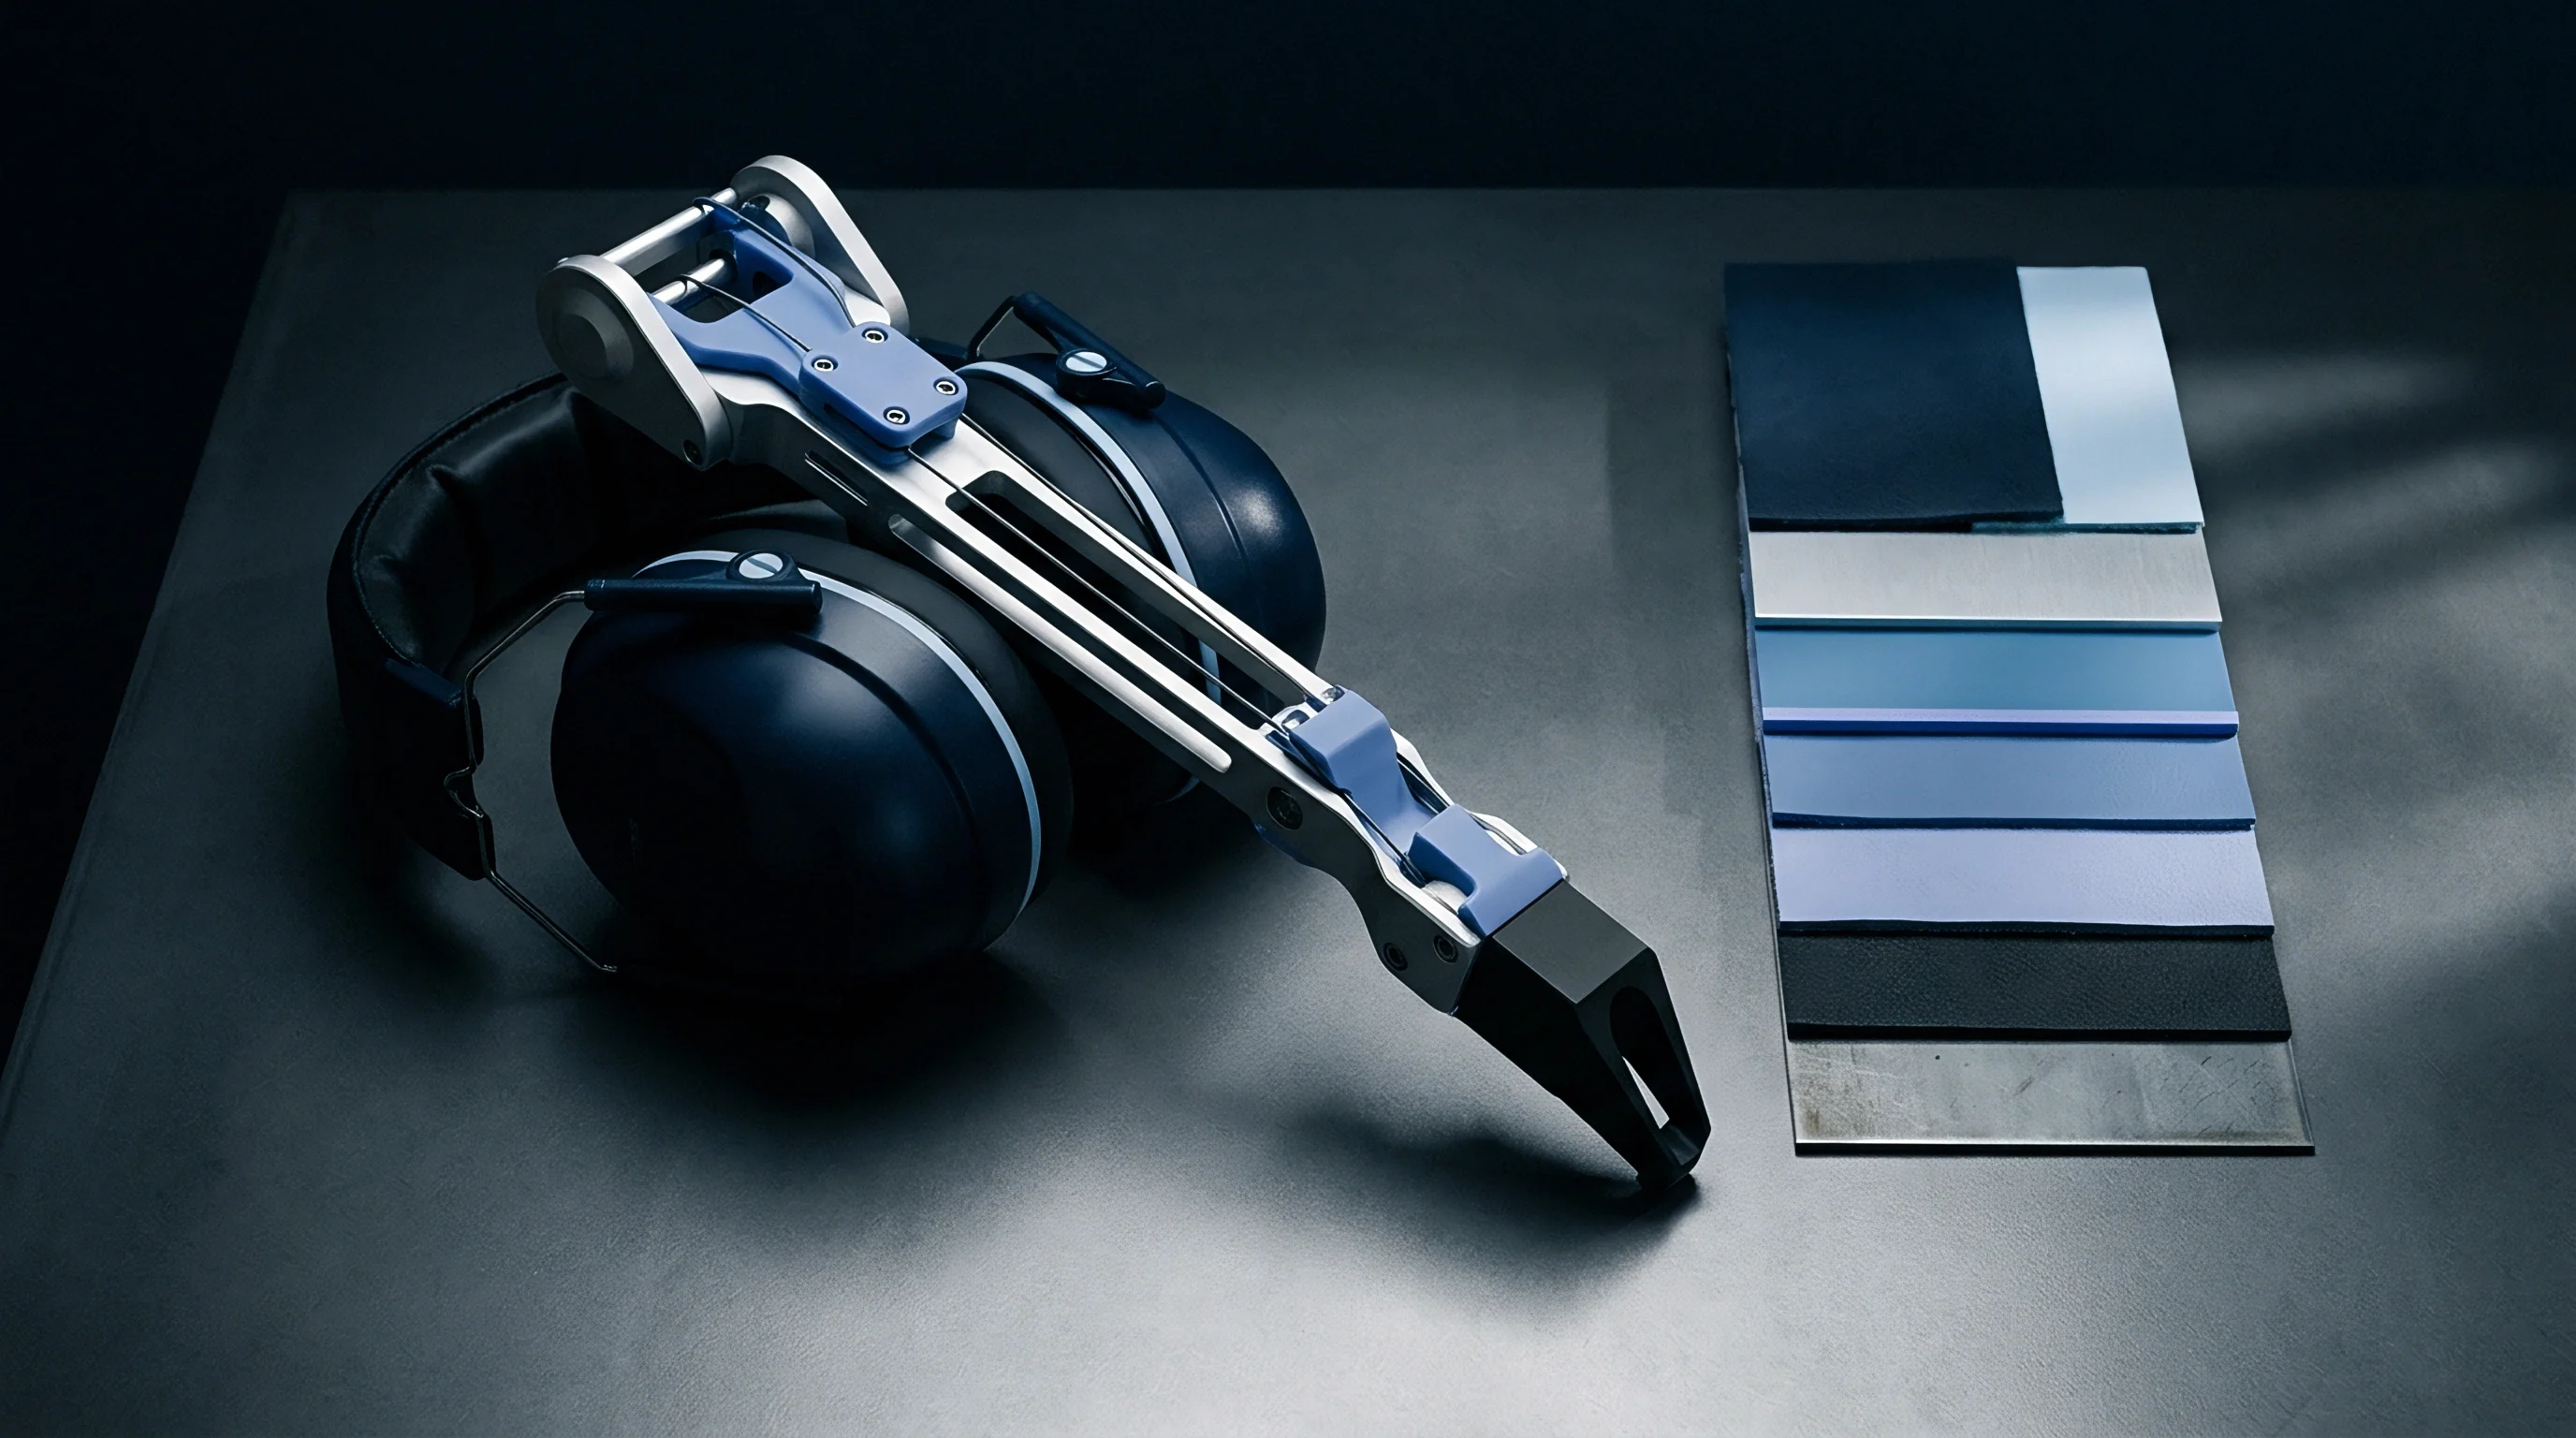
A mechanical wedge grip with self-tightening faces prevents end displacement, transferring the tensile stress directly into the calibrated 50-millimetre gauge length without localized yielding. Extensometer arms knife-edge into the central parallel zone using light spring tension to eliminate knife slip during prolonged thermal dwell periods.
Creep modulus calculation divides the constant tensile stress by the total time-dependent strain recorded at discrete temporal milestones. Thermoplastic response separates into an instantaneous elastic response, a delayed viscoelastic deformation, and eventual viscoplastic flow. Data generation across elevated operational lifespans demands that the chosen stress stays inside the linear viscoelastic regime.
Strain accumulation must stay below 0.5 percent for unreinforced polyolefins, or below 0.2 percent for glass-filled engineering polyamides. Isochronous stress-strain curves constructed across 0.1, 1, 10, and 100 hours determine this linear boundary by revealing where modulus ceases to be independent of applied stress.
Creep rates accelerate exponentially whenever mechanical loads exceed the linear viscoelastic limit of the resin matrix.
Testing shortfalls distort raw creep modulus data before any mathematical treatment can occur:
- Extensometer contact penetration creates micro-notches in notch-sensitive resins like polycarbonate, inducing premature ductile-to-brittle failure under sustained load.
- Thermal chamber stratification induces a top-to-bottom thermal difference exceeding two degrees across the gauge, skewing localized strain accumulation.
- Load frame mechanical vibration transmits high-frequency chatter through dead-weight lever arms, artificially advancing molecular chain disentanglement.
- Premature timing triggers miss the instantaneous elastic response, corrupting the zero-time strain baseline and distorting all subsequent compliance curves.
Isochronous curves require multiple stress levels tested simultaneously in an environmental bank. A specimen set loaded at five megapascals, ten megapascals, fifteen megapascals, and twenty megapascals reveals the stress threshold where isochronous lines deviate from linear proportionality. For unfilled polyoxymethylene copolymer at 23 degrees Celsius, the proportionality limit breaks down above 12 megapascals after 100 hours of continuous loading.
Choosing a test stress above that threshold incorporates tertiary non-linear mechanisms into the raw data, invalidating subsequent time-temperature superposition. Testing within the linear limit ensures that tensile creep compliance represents fundamental molecular relaxation rather than permanent structural damage.
ISO 899-1 Clause 6 specifies that test reports declare the exact gauge displacement measurement method along with verification that bending strain remained below ten percent of axial tensile strain across all specimen faces.

Translation
Time-temperature superposition equates elevated operating temperatures with extended operational lifespans. Accelerating molecular relaxation through thermal activation permits short-term creep compliance curves captured across a ladder of elevated temperatures to shift horizontally along a logarithmic time axis. The resulting curve describes decades of continuous mechanical loading at a selected reference temperature.
Molecular chain mobility follows identical kinetic pathways under prolonged exposure at ambient temperature or short exposures at elevated thermal states, provided no morphological phase shifts occur across the chosen test band.
Horizontal shift factors shift each isothermal compliance segment onto the reference baseline. The Williams-Landel-Ferry equation models temperature dependence above the glass transition temperature, linking structural relaxation directly to fractional free volume expansion. Below the glass transition temperature, or across the secondary transitions of semi-crystalline polymers, an Arrhenius formulation models thermal activation based on the activation energy of the relaxation process.
Combining both regimes requires splitting the superposition range across the glass transition barrier.
A temperature shift factor of twenty-two at seventy degrees Celsius shifts a one-hour creep point to over two years of extrapolated room-temperature performance.
Constructing the horizontal shift sequence follows a strict procedural order:
- Isothermal creep testing collects compliance data across four to seven discrete temperatures spaced between five and ten degrees Celsius apart.
- The reference temperature baseline anchors the dataset, typically set at 23 degrees Celsius for structural components or the maximum steady-state operating environment.
- Individual compliance curves plot on a common logarithmic time scale spanning 1000 seconds to 100,000 seconds per temperature increment.
- Horizontal translation factors slide each isothermal curve along the abscissa until overlapping time regions visually and mathematically merge without inflection changes.
- Shift factors plot against reciprocal absolute temperature or temperature differences to confirm conformity to Arrhenius or Williams-Landel-Ferry models.
Vertical shift factors correct for temperature-induced density changes and entropic elasticity adjustments. Pure horizontal translation assumes constant rubbery entropy and stable crystalline architecture. In reality, thermal expansion alters the number of load-bearing chains per unit cross-sectional area.
Unfilled polyphthalamide demands vertical shift factors matching the ratio of absolute temperatures multiplied by the ratio of densities between the test and reference states. Neglecting vertical shifts produces an upward curve drift that overstates tensile creep modulus by twelve to eighteen percent at long operational horizons.
| Polymer Morphology | Thermal Zone | Governing Shift Model | Empirical Constants or Energy Range | Validity Boundary |
|---|---|---|---|---|
| Amorphous (PC, PMMA) | Glass transition to plus 50 C | Williams-Landel-Ferry | C1 = 17.44, C2 = 51.6 K | Glass transition to Glass transition plus 100 C |
| Amorphous (PS, PVC) | Below glass transition | Arrhenius Formulation | Activation energy: 120 to 280 kJ/mol | Beta transition to Glass transition minus 10 C |
| Semi-Crystalline (PA66, POM) | Sub-glass transition | Arrhenius Formulation | Activation energy: 80 to 190 kJ/mol | Secondary relaxation threshold to glass onset |
| Semi-Crystalline (PBT, PPS) | Above glass transition | Modified Arrhenius / Dual-WLF | Activation energy: 220 to 410 kJ/mol | Glass completion to crystalline melt onset |
| Constants C1 and C2 represent standard universal parameters; resin-specific master curves demand empirical determination via dynamic mechanical thermal analysis. | ||||
Physical aging introduces severe mathematical distortion when extrapolating amorphous or semi-crystalline polymers below their glass transition temperatures. Injection-moulded parts quench rapidly from the melt, freezing excess free volume into the glassy amorphous domains. Over time, chains slowly relax toward thermodynamic equilibrium, increasing part density and shifting relaxation times toward longer durations.
If creep tests run without prior thermal equilibration, the material stiffens during the test itself. Short-term curves captured on freshly moulded parts reflect a non-equilibrium state that cannot superimpose cleanly onto aged parts, causing erroneous horizontal shift factor calculations.
The time-temperature superposition principle applies solely when all relaxation processes share an identical temperature dependence across the entire experimental window.

Spline
Curve alignment begins after extracting discrete horizontal shift values from each isothermal test. Alignment matches overlapping segments of tensile compliance using objective numerical fitting algorithms rather than manual graphical superposition. A generalized Maxwell model or a modified Kohlrausch-Williams-Watts stretched exponential function fits each shifted segment into a unified, continuous relaxation spectrum.
The resulting continuous master curve covers ten to twelve decades of logarithmic time from a collection of experimental runs that each lasted fewer than 300 hours.
Selecting the mathematical model for smooth master curve generation governs the validity of long-term predictions:
- Findley power law representations model primary and secondary creep regimes using stress-independent exponents for linear viscoelastic conditions.
- Stretched exponential formulations capture broad distributions of relaxation times inherent to multi-phase and glass-reinforced resin compounds.
- Generalized Maxwell splines translate viscoelastic compliance into finite element arrays through discrete spring-dashpot Maxwell elements.
- Burger four-element equations describe combined instantaneous elasticity, retarded elasticity, and steady-state viscous flow within low-stress regions.
Mathematical extrapolation carries absolute validity only within the physical boundaries established by the lowest secondary relaxation peak.
Extrapolation accuracy degrades rapidly when empirical curves stretch beyond four decades past the longest actual physical test point. A toolmaker sizing a mould core for a glass-filled nylon pressure housing needs reliable modulus values at 50,000 hours of continuous service. If the longest physical creep test ran for 1,000 hours, extrapolating to 50,000 hours covers 1.7 decades of log time.
This modest extension remains structurally dependable when shift factors match dynamic mechanical thermal analysis data. Attempting to extrapolate a 24-hour creep run out to twenty years represents a jump of nearly four decades, crossing uncharacterized physical aging plateaus and crystalline restructuring regimes.
| Material Grade | Tensile Modulus at 1 Hour (MPa) | Modulus at 1,000 Hours (MPa) | Master Curve Modulus at 10,000 Hours (MPa) | Extrapolated Modulus at 100,000 Hours (MPa) | Total Modulus Retention (Percent) |
|---|---|---|---|---|---|
| Unfilled POM Copolymer | 2,650 | 1,420 | 1,180 | 960 | 36.2 |
| PA66 30% Glass Filled (Dry) | 8,400 | 6,100 | 5,450 | 4,850 | 57.7 |
| PA66 30% Glass Filled (50% RH) | 5,100 | 2,950 | 2,300 | 1,850 | 36.3 |
| Polycarbonate Unfilled | 2,350 | 2,050 | 1,920 | 1,780 | 75.7 |
| PBT 30% Glass Filled | 9,200 | 7,050 | 6,350 | 5,700 | 62.0 |
Glass-fiber reinforcement alters the relaxation spectrum of the base polymer by constraining matrix mobility at the polymer-glass interface. In reinforced polyamides, fiber orientation dominates tensile creep modulus retention. Specimens aligned parallel to the injection flow path exhibit higher initial stiffness and superior modulus retention over decades of log time compared to specimens machined transverse to flow.
Weld lines located inside the gauge length cut long-term modulus retention by up to forty percent because unreinforced resin matrices concentrate at the joining melt fronts. Extrapolation models calibrated purely on longitudinal dogbone specimens overpredict the stiffness of complex parts with transverse orientations and knit lines.
The question of whether secondary crystalline reorganization at elevated field temperatures accelerates chain scission faster than predicted by mechanical shift factors remains an active engineering dispute across outdoor application sectors.
Drift
Tooling steel cut to cold drawing nominals produces out-of-tolerance parts once sustained mechanical service loads engage. A part moulded from 30 percent glass-filled polybutylene terephthalate shrinks by 0.4 percent along the flow path and 0.8 percent across the transverse path during processing in the mould. These shrinkage vectors establish initial part dimensions.
Under an operating load of twenty megapascals, tensile creep modulus declines from 9,200 megapascals at ejection to 5,700 megapascals over ten years of steady deployment. As modulus decays, mechanical strain accumulates, driving gross physical dimensions outside allowable limits established under DIN 16742 tolerance grades.
Tool steel must account for dimensional movement caused by load-induced creep over the working life of the component. Wall sections carrying structural loads require compensation to maintain functional clearances:
- Initial shrinkage calculation sizes core and cavity blocks using standard resin supplier shrinkage bands.
- Extrapolated tensile creep modulus calculations establish total strain accumulated across the projected operating lifespan under peak continuous load.
- Load-induced strain stacks directly onto tool cooling thermal shrinkage, shifting the baseline part geometry.
- Core pins and shut-off faces receive steel safe offsets to compensate for predictable long-term deformation.
- Critical sealing faces receive additional ribbing or localized wall thickening to suppress operational stress below the ten-megapascal threshold.
DIN 16742 Tolerance Group TG4 demands that combined processing variance and service creep strain remain within a total dimensional window of 0.14 millimetres on a fifty-millimetre feature.
Press-side processing parameters directly influence the long-term creep rate of injection-moulded components. Variations in melt temperature, holding pressure, and cooling rate alter the internal morphology of the polymer. Insufficient holding pressure leaves micro-voids in thick wall sections, accelerating localized creep through stress concentration.
Rapid cooling cycles suppress crystalline formation in semi-crystalline materials, leaving low-density amorphous phases that deform rapidly under sustained mechanical loads. Parts processed with optimized holding pressure and hot mould temperatures achieve complete crystallization, yielding higher initial stiffness and resistance to long-term modulus decay.
| Nominal Dimension (mm) | Tolerance Class TG4 Limit (mm) | Initial Moulded Tolerance (mm) | Unfilled POM Creep Drift (mm) | PA66-GF30 Creep Drift (mm) | End-of-Life Compliance Status |
|---|---|---|---|---|---|
| 25.0 | ±0.11 | ±0.04 | +0.16 | +0.05 | POM Exceeds / GF30 Complies |
| 50.0 | ±0.15 | ±0.06 | +0.32 | +0.09 | POM Exceeds / GF30 Complies |
| 100.0 | ±0.22 | ±0.09 | +0.64 | +0.18 | POM Exceeds / GF30 Complies |
| 150.0 | ±0.28 | ±0.12 | +0.96 | +0.27 | POM Exceeds / GF30 Complies |
A designer sizing a snap-fit arm or structural flange who ignores the drop in tensile creep modulus will observe field relaxation that destroys pre-load tension. In snap assemblies, retention force decays in direct proportion to modulus reduction. A clip retaining fifty newtons of clamping force at assembly may retain fewer than twenty newtons after 5,000 hours of continuous service at elevated temperatures.
If the initial design calculations relied solely on the short-term flexural or tensile modulus from resin datasheets, the joint loosens, rattles, and allows fluid ingress through perimeter seals, triggering field warranty recalls and costly tooling modifications.
Relying on initial datasheet modulus values for sustained structural load applications results in catastrophic dimensional failure across product lifecycles.
Ledger
Tooling capital represents non-recoverable expenditure once steel machining commences. Cutting an eight-cavity hardened tool steel mould for an engineering thermoplastic part costs between 60,000 and 150,000 dollars depending on runner systems, lifters, and surface finish requirements. When structural parts fail qualification testing due to unpredicted creep deformation, altering the hardened tool steel requires electric discharge machining modifications, welding, or replacing core inserts entirely.
Tool modifications delay production launches by eight to sixteen weeks, burning working capital while press capacity sits idle.
Raw material resin pricing carries its own exposure. Engineering thermoplastics with complete, verified creep master curves command significant price premiums over generic commodities. Prime-grade polyphthalamide with full time-temperature superposition datasets across multiple temperatures and humidity levels sells for 8.50 dollars per kilogram.
Uncertified near-prime resin costs 5.20 dollars per kilogram. Sourcing teams tempting piece-price reductions by switching to lower-cost resins without long-term creep verification risk high downstream liability. Batch-to-batch molecular weight variations in uncertified lots alter long-term relaxation kinetics, turning compliant tooling into scrap generator assets.
Cavitation economics amplify the stakes of tensile creep modulus extrapolation. A high-cavitation tool running on a twenty-second cycle produces millions of parts annually. If long-term creep compliance predictions underestimate real deformation by twenty percent, every part produced across thousands of press hours carries an unaddressed structural defect.
The amortisation of tooling steel over large production volumes depends on stable part performance. Recalling delivered products due to creep failure costs orders of magnitude more than commissioning rigorous ISO 899-1 creep testing during part design phases.
Procurement contracts must stipulate clear requirements regarding material validation and modulus extrapolation protocols. Sourcing agreements should require raw material suppliers to provide documented time-temperature superposition datasets covering the entire expected thermal and temporal operating range of the product. Specifying these technical requirements in tool-build agreements protects the buyer from assuming liability for structural failures caused by material non-conformance.
Suppliers routinely state that published 24-hour tensile modulus figures reliably predict multi-year component deflection under normal room-temperature service conditions.