Analytical Evaluation Threshold Derivations for Non Target Packaging Screening
Derive the analytical evaluation threshold by dividing toxicological exposure limits by dietary consumption and packaging area, adjusting for detector response.


Threshold
Toxicological safety limits define the quantitative boundary where uncharacterized chromatographic signals demand chemical identification. When non-target screening evaluates food contact articles, analytical chemists encounter hundreds of unknown non-intentionally added substances. These migrants comprise polymer degradation products, side-reaction impurities, additive breakdown fragments, and printing set-off compounds.
Laboratories cannot synthesize or purchase authentic reference standards for every detected peak. The analytical evaluation threshold resolves this impasse by calculating a chromatographic peak area limit below which unknown substances present a negligible toxicological risk to consumers.
Toxicological screening demands exact numerical control. The derivation begins with established toxicological reference values derived from the threshold of toxicological concern. Under European Food Safety Authority guidance and United States Food and Drug Administration food contact notification principles, exposure thresholds vary according to chemical structure.
Cramer Class I substances, representing simple chemical structures with known metabolic pathways, carry an exposure threshold of 1800 micrograms per person per day. Cramer Class II intermediate structures carry a threshold of 540 micrograms per person per day. Cramer Class III structures, consisting of complex chemicals or structures containing reactive functional groups, command a restrictive threshold of 90 micrograms per person per day.
Potential genotoxicants, recognized by structural alerts or cohort of concern classification, drop to 0.15 micrograms per person per day.

Toxicological Foundations of Screening Benchmarks
Analytical chemists default to conservative toxicological tiers when screening uncharacterized packaging extracts. If an unknown peak displays no identifiable mass spectral fragment pattern, the laboratory treats the compound as a Cramer Class III toxicant or a potential genotoxicant. The choice between 0.15 micrograms per day and 90 micrograms per day alters the required analytical sensitivity by six hundred fold.
A migration value of 0.010 milligrams per kilogram defines the legal screening boundary for unlisted substances behind a functional barrier under Regulation (EU) 10/2011 tested after ten days at forty degrees Celsius.
Direct exposure conversions assume a standardized human body weight and daily dietary intake. European food contact testing conventions define a standard adult body weight of 60 kilograms and a daily consumption of 1 kilogram of packaged food. The 0.15 microgram daily threshold yields a dietary concentration limit of 0.15 micrograms per kilogram of food, equivalent to 0.15 parts per billion.
The 90 microgram threshold for Cramer Class III yields 90 micrograms per kilogram of food, or 90 parts per billion. Under European Union Regulation 10/2011, Article 19 instructs producers to evaluate non-intentionally added substances via risk assessment. When functional barriers shield recycled or unlisted virgin resins, migration cannot exceed 10 micrograms per kilogram of food, creating an operational threshold of 10 parts per billion.
| Toxicological Class | Intake Limit (ug/day) | Dietary Allocation (kg/day) | Dietary Limit (ug/kg food) | Screening Application |
|---|---|---|---|---|
| Cohort of Concern / DNA Reactive | 0.15 | 1.0 | 0.15 | Uncharacterized screening with genotoxic structural alerts |
| Organophosphates / Carbamates | 18.0 | 1.0 | 18.00 | Suspected insecticide residues in paper and board |
| Cramer Class III | 90.0 | 1.0 | 90.00 | Default conservative baseline for non-genotoxic unknowns |
| Cramer Class II | 540.0 | 1.0 | 540.00 | Intermediate structures with low direct reactivity |
| Cramer Class I | 1800.0 | 1.0 | 1800.00 | Simple linear hydrocarbons and endogenous metabolites |
| Functional Barrier Benchmark | 10.0 | 1.0 | 10.00 | Regulation (EU) 10/2011 Article 13/14 screening cutoff |
Conversion Mechanics for Dietary Intake
Every chromatographic peak carries analytical liability. Converting dietary exposure values to packaging material concentration demands precise geometric conversion factors. The conventional European contact model assumes that 6 square decimeters of packaging surface contact 1 kilogram of food.
A migration limit of 10 micrograms per kilogram translates to 1.67 micrograms per square decimeter of material surface.
Assigning an incorrect toxicological baseline propagates errors through downstream testing sequences:
- Genotoxicity Default Application imposes an analytical sensitivity target of 0.15 parts per billion, forcing extensive pre-concentration steps that introduce sample loss.
- Arbitrary Cramer Class I Assumption elevates screening cutoffs to 1800 parts per billion, causing analysts to ignore toxic degradation fragments and unreacted photoinitiators.
- Functional Barrier Misclassification assigns the 10 parts per billion barrier limit to monolayer polyolefins, bypassing toxicological evaluations for heavy oligomer fractions.
- Static Surface Modeling applies the 6 square decimeter standard to small-format caps and closures, underestimating migrant concentrations in actual packaged liquids.
Selecting an inappropriate toxicological threshold triggers immediate compliance failures at the customs entry border, landing the importer with contaminated inventory and mandatory container destruction orders.

Concentration
Sample preparation procedures translate bulk packaging polymers into liquid extracts ready for chromatographic separation. Migration testing exposes packaging films or articles to standardized food simulants specified in European standard EN 1186. Simulant A comprises ten percent ethanol in water.
Simulant B uses three percent acetic acid in water. Simulant C utilizes twenty percent ethanol, while Simulant D1 applies fifty percent ethanol for dairy products. Simulant D2 uses vegetable oil, and Simulant E consists of poly(2,6-diphenyl-p-phenylene oxide), known commercially as Tenax, for dry foodstuffs.
Testing laboratories often deploy 95 percent ethanol or isooctane as substitute simulants for Simulant D2 to bypass oily matrices that foul chromatography columns.
Solvent choice alters recovery rates. When an extraction uses 100 milliliters of simulant to contact 1 square decimeter of polymer film, the volumetric dilution factor directly dampens the physical migrant concentration. If the target migration limit stands at 10 micrograms per kilogram of food, and the packaging geometry matches the standard European ratio of 6 square decimeters per kilogram, 1 square decimeter carries 1.67 micrograms of migrant.
Extracting that surface with 100 milliliters of solvent disperses 1.67 micrograms across 100 milliliters, yielding a solution concentration of 0.0167 micrograms per milliliter, or 16.7 parts per billion.
Article 16 of Regulation (EC) 1935/2004 invalidates declarations of conformity lacking verifiable analytical documentation for unlisted degradation products.
Gas chromatography with mass spectrometry detectors registers noise baselines that obscure trace analytes below 100 parts per billion in full-scan screening mode. Laboratories concentrate extracts using gentle nitrogen blow-down or solid-phase extraction cartridges to elevate analyte concentrations into detectable ranges. A volume reduction from 100 milliliters down to 1 milliliter generates a concentration factor of 100.
The resulting solution contains 1.67 micrograms per milliliter, positioning the analyte within linear detector response zones.

Mathematical Derivation of the Instrumental Threshold
Calculating the final instrumental screening cutoff integrates toxicological intake, dietary consumption, packaging geometry, extraction volume, and concentration steps into a unified formula. The calculation establishes the target concentration in the testing vial:
AET_solution = (TTC / Consumption) (Food_Mass / Packaging_Area) (Exposed_Area / Extract_Volume) Concentration_Factor (1 / UF)
In this derivation, TTC represents the toxicological threshold in micrograms per day. Consumption equals the daily human intake of packaged food, standardized at 1 kilogram per day. Food_Mass over Packaging_Area represents the surface-to-mass ratio, fixed at 1 kilogram per 6 square decimeters in general European assessments.
Exposed_Area indicates the polymer area submerged in the extraction bath, expressed in square decimeters. Extract_Volume represents the initial volume of simulant deployed. Concentration_Factor defines the ratio of initial extract volume to final reconstituted volume.
The term UF designates the analytical uncertainty factor.
Consider a practical testing sequence. Take an extraction of 2 square decimeters of multilayer barrier film submerged in 200 milliliters of 50 percent ethanol. The contact protocol runs for ten days at 40 degrees Celsius.
The analytical laboratory concentrates the 200-milliliter extract to 2 milliliters through automated rotary evaporation, establishing a concentration factor of 100. The target toxicological threshold follows the Cramer Class III level of 90 micrograms per person per day. The uncertainty factor stands at 1.5 to account for detector variation.
The resulting analytical evaluation threshold in the final injection solution calculates directly:
AET_solution = (90 / 1.0) (1.0 / 6.0) (2.0 / 200) 100 (1 / 1.5) = 15.0 0.010 100 0.667 = 10.0 micrograms per milliliter.
Volatile oligomers evaporate during concentration. When analysts apply nitrogen streams or heat to concentrate volatile extracts, low-boiling migrants flash off with the solvent. Solvents containing dissolved polyolefins also precipitate wax fractions during evaporation, adsorbing medium-polarity additives onto container walls.
- Extraction Stage records initial simulant volume and surface contact geometry under EN 1186 protocols.
- Evaporation Protocol applies controlled nitrogen gas at 35 degrees Celsius to prevent volatile loss.
- Reconstitution Step dissolves residues in an analytical solvent matched precisely to chromatography mobile phases.
- Screening Injection submits concentrated solutions to high-resolution mass spectrometers for data acquisition.
Supply agreements incorporating DIN EN ISO/IEC 17025 accredited testing clauses penalize non-target screening reports that fail to document recovery losses incurred during extraction concentration steps.

Response
Chromatographic detectors exhibit non-uniform electronic response profiles across divergent molecular structures. An electron ionization source on a gas chromatograph fragments nonpolar linear alkanes with predictable yield, whereas polar aromatic esters undergo extensive fragmentation that distributes ion currents across dozens of mass-to-charge channels. Electrospray ionization on a liquid chromatograph amplifies this disparity.
Basic nitrogenous compounds ionize with extreme efficiency in positive electrospray mode, generating large chromatographic peaks at trace concentrations. Acidic fluorinated compounds or neutral phenolic antioxidants ionize poorly, producing diminutive signals at identical molar concentrations.
Screening protocols cannot deploy certified standards for uncharacterized analytes. Laboratories add internal standards into the analytical vial to calibrate detector sensitivity. The laboratory chooses stable isotope-labeled compounds or non-interfering industrial chemicals such as deuterated polycyclic aromatics, 2-fluorobiphenyl, or chlorobenzene for gas chromatography.
Liquid chromatography utilizes deuterated bisphenol A, 13C-labeled phthalates, or reserpine. The analytical evaluation threshold relies on the internal standard peak area to establish the identification cutoff.

Which Detector Variations Warrant Elevated Uncertainty Multipliers?
Relative response factors quantify the sensitivity spread between unknown migrants and the chosen internal standard. The relative response factor equals the peak area of the target compound divided by its concentration, divided by the peak area of the internal standard divided by its concentration. When an unknown chemical exhibits a relative response factor of 0.20 compared to the internal standard, its chromatographic peak area is five times smaller than the standard at identical concentration.
If the laboratory sets the screening threshold directly at the internal standard peak area without adjustment, that unknown migrant escapes detection even when its true concentration exceeds toxicological thresholds.
Detectors without uniform compound ionization demand wider uncertainty spans to prevent false negative screening outcomes.
The uncertainty factor directly lowers the numerical screening threshold to capture poorly responding analytes. The United States Product Quality Research Institute extractables and leachables guidelines advocate an uncertainty factor of 2.0 to 4.0 for non-target gas chromatography with mass spectrometry screening. For liquid chromatography coupled to electrospray mass spectrometry, where response factors vary across three orders of magnitude, uncertainty factors reach 5.0 to 10.0.
| Analytical Technique | Ionization Method | Relative Response Spread | Standard Uncertainty Factor | Internal Standard Selection |
|---|---|---|---|---|
| GC-FID | Flame Ionization | 0.70 to 1.30 | 1.25 | Aliphatic hydrocarbons (e.g. n-tetradecane) |
| GC-MS | Electron Ionization (70 eV) | 0.30 to 3.00 | 2.00 | Deuterated aromatics (e.g. phenanthrene-d10) |
| GC-MS | Chemical Ionization (PCI/NCI) | 0.10 to 5.00 | 3.50 | Halogenated standards (e.g. 4-bromobiphenyl) |
| LC-MS/MS | Atmospheric Pressure Chemical | 0.10 to 8.00 | 4.00 | Structural analogues (e.g. triphenyl phosphate) |
| LC-HRMS | Electrospray Ionization (ESI+) | 0.01 to 20.00 | 10.00 | Deuterated plasticizers (e.g. DEHP-d4) |
| Values reflect standard relative response factor distributions for non-target screening using single internal reference markers across variable polymer additive chemistries. | ||||
Instrument calibration dictates baseline stability. Incorporating an uncertainty factor of 4.0 cuts the operational analytical evaluation threshold by 75 percent. An instrumental threshold that originally stood at 2.0 micrograms per milliliter drops to 0.5 micrograms per milliliter.
The mass spectrometer must now acquire clean fragment spectra for peaks that barely clear baseline noise. High baseline noise increases false discovery rates, forcing the testing team to deconvolute hundreds of background instrument artifacts.
Mass accuracy confirms empirical formulas. High-resolution accurate-mass instruments such as quadrupole time-of-flight spectrometers deliver mass measurements within 5 parts per million tolerance. This mass accuracy permits the automated calculation of elemental formulas, distinguishing true packaging migrants from column bleed and plasticizer background contaminants.
Without accurate mass confirmation, low screening thresholds bury the analyst under chromatographic interferences.
Whether laboratories can defend uniform uncertainty factors across multi-layer barrier laminates containing reactive polyurethane adhesives remains an unresolved technical dispute in current standardization working groups.

Vial
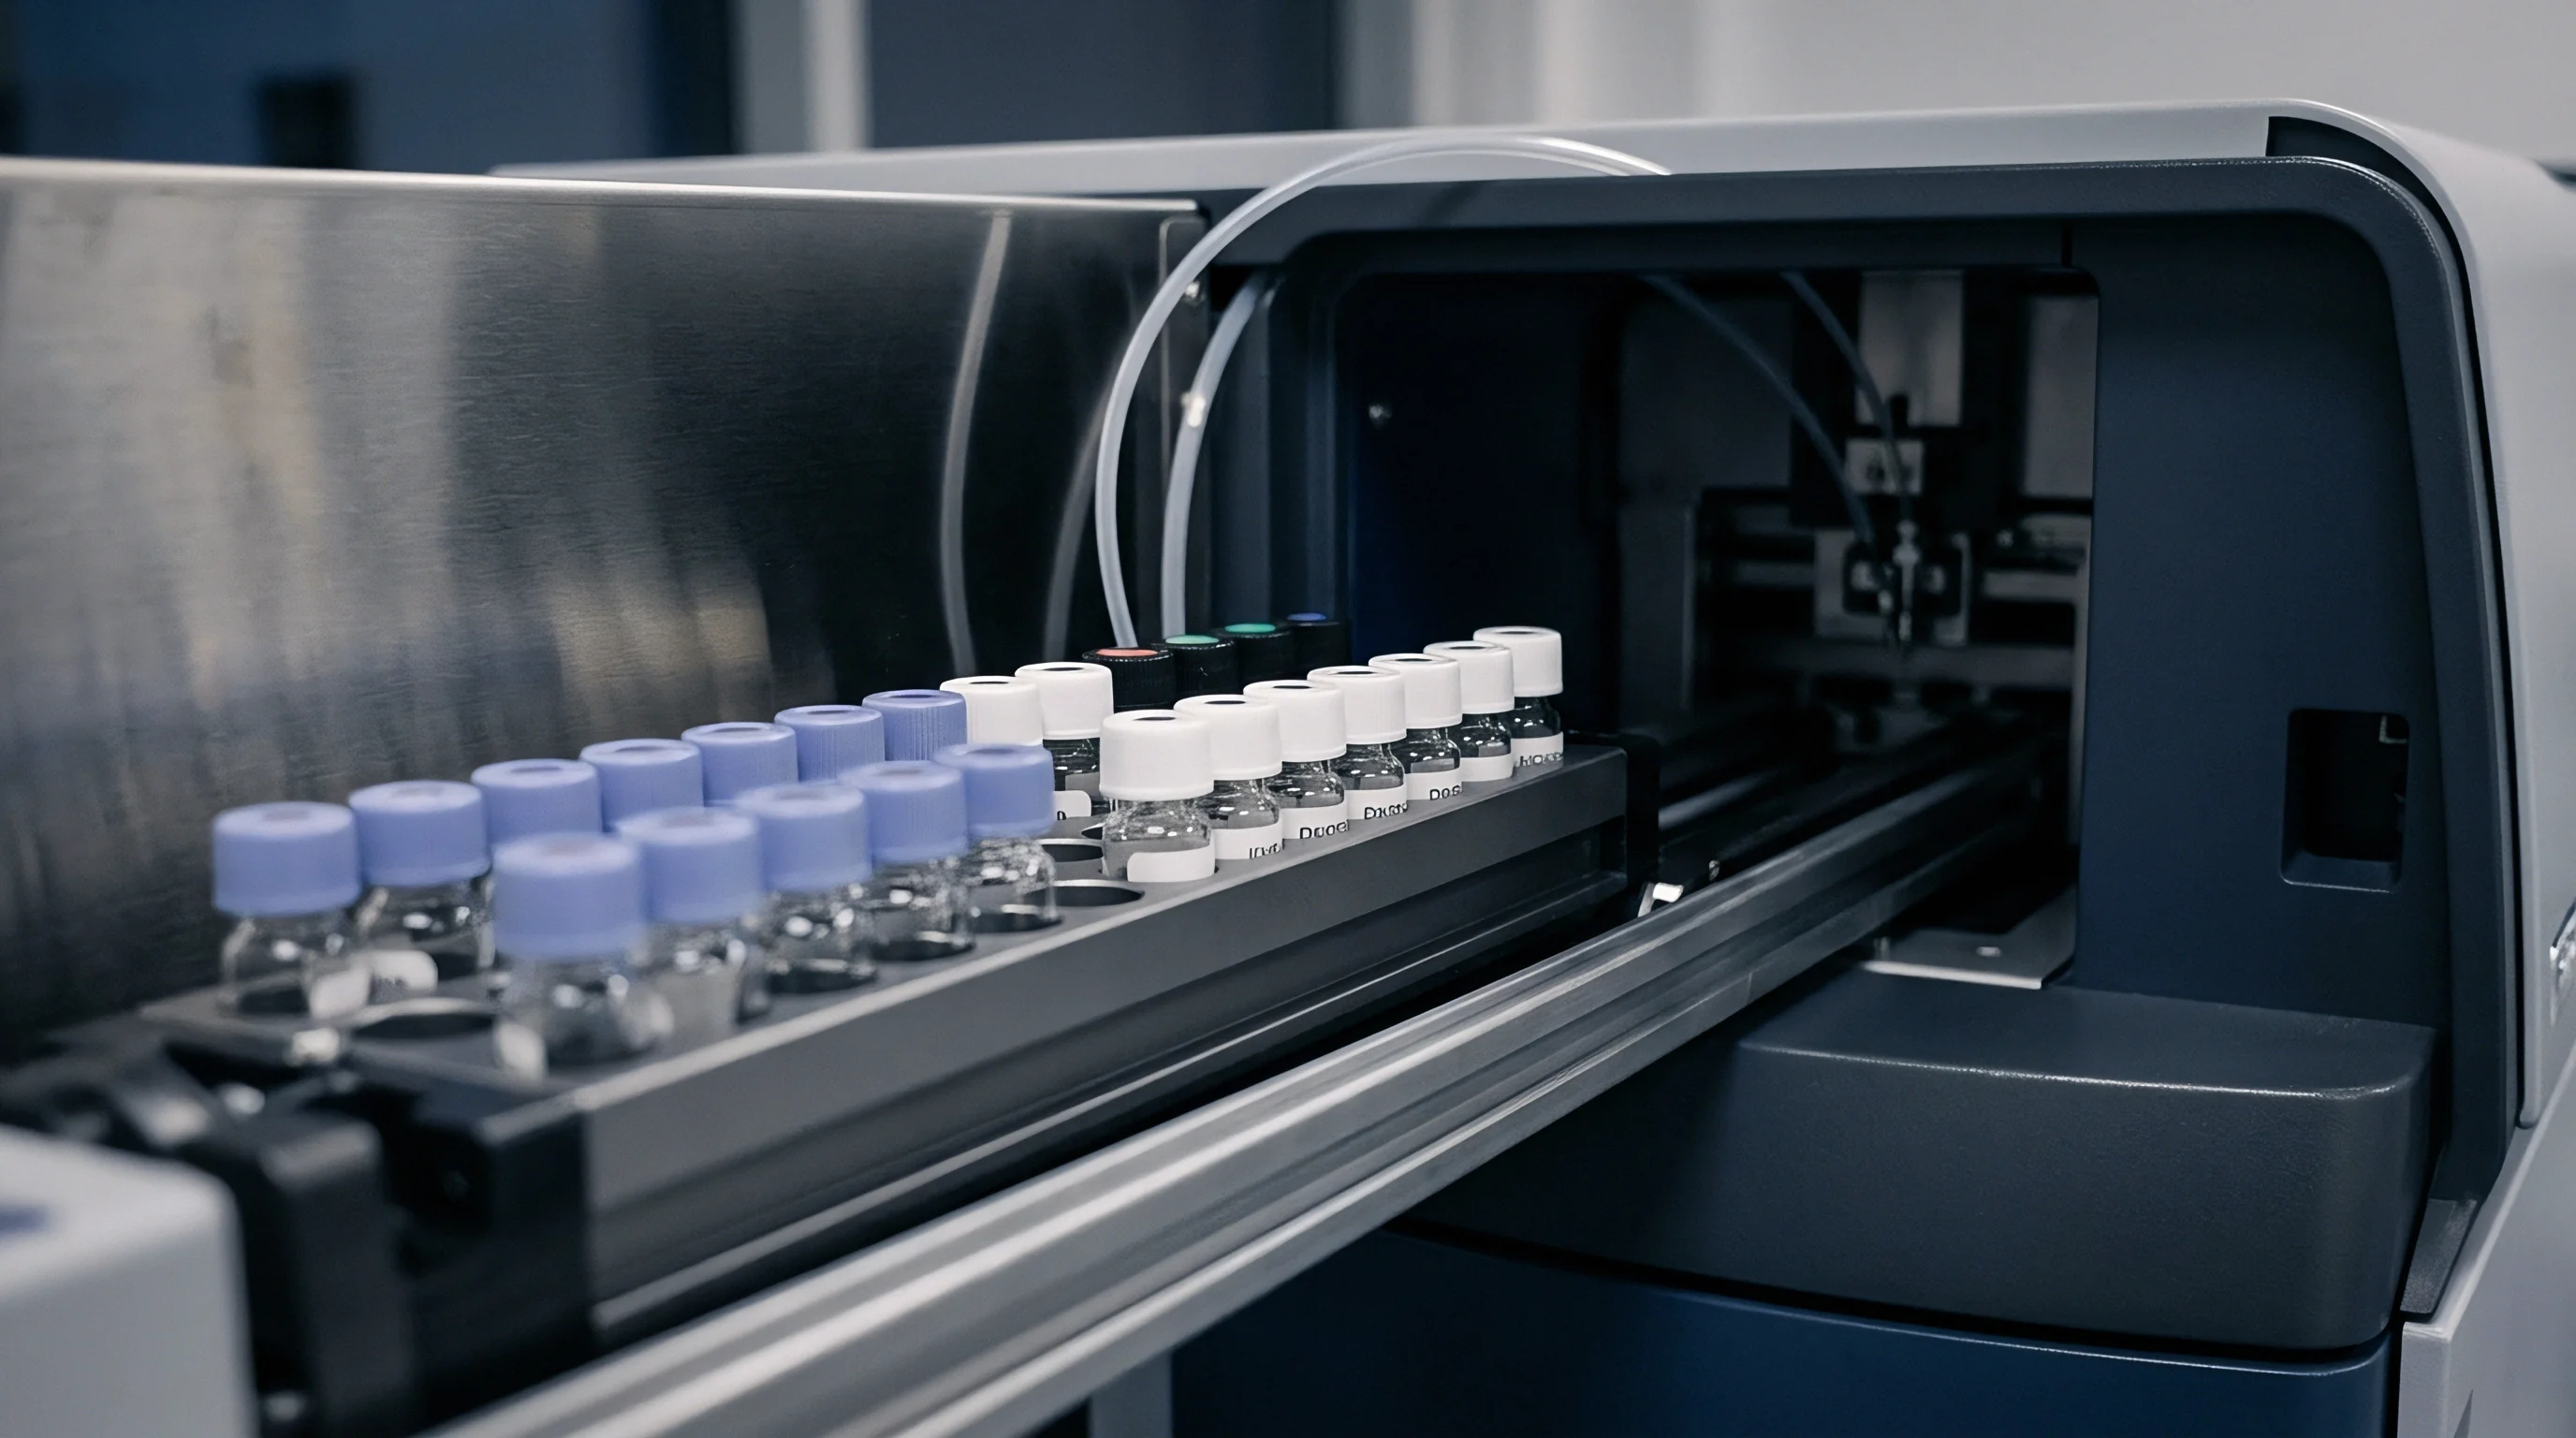
Screening operations converge inside the autosampler container before physical injection into the chromatographic separator. A standard 2-milliliter borosilicate glass container holds the extracted, concentrated simulant alongside its assigned internal standards. Solvent purity dictates baseline noise.
Solvents carrying trace hydrocarbon contamination from storage drum liners create phantom peaks that mimic packaging additives.
Thermal stress releases volatile oligomers. The analytical sequence mounts blank injections alongside solvent controls and matrix blanks. Method blanks expose pure simulant to identical glassware, extraction baths, concentration tubes, and autosampler storage conditions without polymer contact.
If the extraction procedure introduces bis(2-ethylhexyl) phthalate or 2,6-di-tert-butyl-p-cresol (BHT) from laboratory tubing or pipette tips, the method blank flags the background peak. The analyst subtracts blank area contributions from sample peaks before comparing migrant signals against the analytical evaluation threshold.
Automated Processing and Peak Deconvolution
The detector registers electronic current. Modern non-target screening processes data files through automated algorithms that locate peaks, subtract background baseline drift, and integrate peak areas. Total ion chromatograms combine signals across all mass channels.
Extracted ion chromatograms isolate single mass-to-charge ratios to detect trace co-eluting migrants hidden under solvent broad fronts or major polymer peaks.
Screening errors carry severe financial exposure. Automated peak detection algorithms risk rejecting genuine packaging migrants that display peak areas marginally below the numerical evaluation threshold. Split peaks, tailing geometry caused by column active sites, or severe baseline drift lead integration software to calculate diminished peak areas.
When software cuts an integrated area in half, a dangerous migrant escapes toxicological review.
Testing laboratories follow rigorous screening verification checks before finalizing non-target packaging dossiers:
- Solvent Background Auditing eliminates contaminated extraction batches showing ghost peaks above twenty percent of the target threshold.
- Retention Time Locking synchronizes chromatographic retention across extended runs to ensure accurate identification against spectral databases.
- Signal to Noise Qualification confirms that peaks at the analytical evaluation threshold maintain a minimum signal-to-noise ratio of ten to one.
- Internal Standard Recovery Tracking rejects injections where standard recoveries drift outside seventy to one hundred thirty percent boundaries.
Polymer degradation yields unlisted fragments. During polyethylene processing, heat stabilizers such as Irgafos 168 oxidize into oxidized Irgafos 168, while sterically hindered phenolics degrade into quinone methide intermediates. Non-target workflows must capture these transformation products at the analytical evaluation threshold.
Packaging converters frequently claim that unlisted substances represent harmless standard additive blends, but border inspection authorities refuse customs clearance whenever unidentified peaks exceed the legal screening boundary.


Geometry
Packaging dimensions govern final migrant exposure concentrations in real food systems. The standard European assumption assigns 6 square decimeters of contact area to 1 kilogram of food. Real commercial packaging rarely matches this theoretical construct.
Small-format food containers carry vastly expanded surface-to-mass ratios that elevate consumer exposure per unit weight of food. A 50-gram single-portion polypropylene dessert tub exposes approximately 0.8 square decimeters of plastic to 0.05 kilograms of food, yielding an actual contact ratio of 16 square decimeters per kilogram. Conversely, a 25-liter bulk drum exhibits a contact ratio near 2.5 square decimeters per kilogram.
Contamination invalidates low screening limits. Applying the standard 6 square decimeter conversion factor to a 50-gram tub underestimates consumer exposure by a factor of 2.7. If an unknown compound migrates at 1.0 microgram per square decimeter, the standard European model predicts an intake concentration of 6.0 micrograms per kilogram of food.
The actual 50-gram container delivers 16.0 micrograms per kilogram of food to the consumer. For infant packaging, where consumption models assume a lower body weight of 5 kilograms or 7 kilograms and heightened food intake relative to mass, regulatory authorities impose specialized exposure corrections.

What Consumption Patterns Alter Packaging Exposure Limits?
Infant nutrition packaging represents the most restrictive commercial operating arena. European Union Regulation 10/2011 mandates specific restrictions for materials contacting infant food. The European Food Safety Authority assumes an infant consumes up to 0.15 kilograms of dry formula or reconstituted food per kilogram of body weight daily.
For an infant weighing 5 kilograms, consuming 0.75 kilograms of food in high-surface packaging, screening thresholds drop dramatically. An analytical evaluation threshold derived for general adult consumption must be lowered by a factor of up to five when clearing infant contact packaging.
| Container Format | Fill Volume / Mass | Surface Area (dm2) | Ratio (dm2/kg) | Adult Solution AET (ug/mL) | Infant Solution AET (ug/mL) |
|---|---|---|---|---|---|
| Single Portion Cup | 50 g | 0.80 | 16.0 | 0.375 | 0.075 |
| Beverage Bottle | 500 mL | 3.50 | 7.0 | 0.857 | 0.171 |
| Standard EU Cube | 1000 g | 6.00 | 6.0 | 1.000 | 0.200 |
| Family Tub | 2000 g | 9.00 | 4.5 | 1.333 | 0.267 |
| Bulk Liquid Drum | 25000 g | 62.50 | 2.5 | 2.400 | 0.480 |
Surface contact ratios govern the true exposure risk far more directly than raw polymer composition.
Importers shoulder direct enforcement exposure. When packaging converters assemble technical files to support declarations of conformity, engineering teams must incorporate the specific intended fill volume into the analytical evaluation threshold derivation. Presenting an analytical screening report based on adult consumption ratios for a container used commercially for infant purees constitutes a regulatory breach under Regulation (EC) 1935/2004.
Customs authorities inspect the declared intended use against test conditions, issuing automatic rejections when analytical sensitivity fails to reach the required exposure threshold.
Screening protects commercial supply lines. Testing facilities confirm functional barrier efficacy by verifying that unlisted substances migrating from middle adhesive or recycled polymer layers remain below the derived threshold. If an adhesive cleavage byproduct migrates through a virgin inner seal layer at 15 parts per billion, and the infant-adjusted threshold stands at 5 parts per billion, the packaging fails compliance testing.
The converter must reformulate the adhesive, thicken the virgin contact layer, or lower processing temperatures to inhibit degradation kinetics.
Rigorous mathematical derivations of analytical evaluation thresholds ensure that chemical screening protects public health while maintaining commercially viable analytical workflows across global supply chains. A laboratory report provides reliable regulatory protection when its analytical sensitivity reflects actual container geometry rather than theoretical conventions.